Effects of Mo-Rubbing abdomen manipulation on glucose metabolism and inflammatory factors in rats with type 2 diabetes mellitus
2022-10-26XIEZhouyu谢舟煜XUJingsong徐景崧KONGXintian孔心甜WUYunchuan吴云川
XIE Zhouyu (谢舟煜), XU Jingsong (徐景崧), KONG Xintian (孔心甜), WU Yunchuan (吴云川)
School of Acupuncture, Moxibustion and Tuina, Nanjing University of Chinese Medicine, Nanjing 210023, China
Abstract
Keywords: Tuina; Massage; Mo-Rubbing Manipulation; Diabetes Mellitus, Type 2; Inflammatory Factors; Carbohydrate Metabolism
Diabetes, a common chronic metabolic dysfunction disease, has become a major problem in global public health[1]. The number of global diabetic patients increased nearly fourfold from 1980 to 2014[2]. The International Diabetes Federation predicts that by 2030,the global diabetic patients will exceed 435 million, and type 2 diabetes mellitus (T2DM) accounts for more than 90%[3]. Insulin resistance is the key pathogenesis of T2DM. Studies have shown that inflammatory response plays a crucial role and is involved in the whole process of insulin resistance[4-5]. Pro-inflammatory factors induce insulin resistance by depleting β cells. More and more studies have shown that inflammatory response accelerates the occurrence of diabetic vascular complications, such as retinopathy, nephropathy,cardiovascular and cerebrovascular diseases[6].Reducing inflammatory response not only improves glycemic control and slows progressively β-cell secretory dysfunction but also reduces complications[4,7].Evidence suggests that interleukin (IL)-1β, IL-6, and tumor necrosis factor (TNF)-α are the key to inducing various inflammatory responses, resulting in β-cell damage and insulin resistance[8-9].
At present, medication controlling blood glucose is the main T2DM treatment, such as biguanides and sulfonylureas[6]. So far, no complete healing method for diabetes has been developed. Long-term medicine use may cause adverse reactions such as gastrointestinal reactions, anemia, and impaired liver and kidney function[10]. Therefore, it is of great significance to actively explore alternative or adjuvant therapies for T2DM and reduce drug dosages.
Clinical evidence shows that Mo-Rubbing abdomen manipulation can help down-regulate blood glucose[11].In this study, a T2DM rat model was induced by feeding a high-sugar and high-fat diet combined with intraperitoneal injection of streptozotocin (STZ), and Mo-Rubbing abdomen manipulation was performed to explore its effects on glucose metabolism, islet morphology, and the related inflammatory factors.
1 Materials and Methods
1.1 Laboratory animal
Sixty specific-pathogen-free healthy male Sprague-Dawley (SD) rats, 9 weeks old, weighing 300±20 g, were provided by Qinglongshan Animal Breeding Farm,Nanjing, China. All rats were reared in the specificpathogen-free condition with a 12 h/12 h light/dark alternating environment in the Experimental Animal Center of Nanjing University of Chinese Medicine at 20-22 ℃, and the relative humidity was maintained at 50%-60%. After a 1-week adaptive feeding, the rats were divided into two groups by the random number table method. Ten rats in the normal group were fed a routine diet. Fifty rats for modeling were fed with high-sugar and high-fat diet, including 66.5% routine diet, 20.0% lard, 10.0% sucrose, 2.5% cholesterol, and 1.0% bile salt.
The experiment was approved by the Animal Experiment Management Committee of Nanjing University of Chinese Medicine (Ethical Approval No. 201908A015). The experimental process complied with theGuiding Opinions on the Treatment of Experimental Animalsissued by the Ministry of Science and Technology of the People’s Republic of China.
1.2 Main reagents and instruments
1.2.1 Main reagents
STZ (Beijing Soleibo Technology Co., Ltd., China);metformin hydrochloride tablets (Sino-American Shanghai Squibb Pharmaceutical Co., Ltd., China);insulin enzyme-linked immunosorbent assay (ELISA)detection kit (Shanghai Ikesai Biological Products Co.,Ltd., China); IL-1β (Cat. No. CRE0006), IL-6 (Cat. No.CRE0005), and TNF-α (Cat. No. CRE0003) ELISA detection kits (Nanjing Tengke Biotechnology Co., Ltd., China).
1.2.2 Main instruments
Blood glucose meter (Roche, USA); stress test system monitor (PRNewswire, USA); centrifuge (Sigma, USA);fluorescence microscope (OLYMPUS, Japan);embedding machine (Shanghai Yiheng Scientific Instrument Co., Ltd., China); slicer (LEICA, Germany).
1.3 Model preparation and identification
Rats in the model group were fasted for 12 h and weighed after a 4-week feeding with a high-sugar and high-fat diet. The rats received a one-time intraperitoneal injection of STZ solution at a dose of 35 mg/(kg·bw)[12]. The standard for successful T2DM modeling was two random tests of blood glucose≥16.7 mmol/L[13].
1.4 Grouping and intervention
The successful T2DM modeling rats were divided into a model group, a Mo-Rubbing abdomen group, and a metformin group, with 10 rats in each group. During the experiment, 1 rat in the model group and 2 rats in the metformin group died due to unknown reasons. The final actual data included 10 rats in the normal group, 9 rats in the model group, 10 rats in the Mo-Rubbing abdomen group, and 8 rats in the metformin group.
Normal group: The rats were on a common diet,received gavage with 2 mL of pure water every day, and then immobilized with a self-made mouse fixer for 20 min and 8 consecutive weeks.
Model group: The rats were on a high-sugar and high-fat diet, then received gavage with 2 mL of pure water every day, and then immobilized with a selfmade mouse fixer for 20 min and 8 consecutive weeks.
Metformin group: The rats were on a high-sugar and high-fat diet, and received intragastric administration of 2 mL liquor (including a daily dose of ground metformin hydrochloride tablets and pure water) at 200 mg/(kg·bw) every day, and then immobilized with a self-made mouse fixer for 20 min and 8 consecutive weeks.
Mo-Rubbing abdomen group: The rats were on a high-sugar and high-fat diet, and the Mo-Rubbing abdomen manipulation was performed after gavage with 2 mL of pure water every day. Before the Mo-Rubbing abdomen manipulation, the rats were immobilized with a self-made mouse fixer to restrict their movements and expose the abdomen (Figure 1).The rat abdomen was rubbed in a clockwise direction for 20 min using the finger pulps of the index and the middle fingers at a frequency of 100-120 times/min.The force of action was monitored by the stress test system based on touching the rat’s intestinal wall and keeping the rat quiet.
The maximum and the minimum forces determined by the preliminary experiment were 7.65±0.39 N and 7.24±0.10 N. The difference between the maximum and the minimum forces was 0.41±0.12 N, and the period was 0.54±0.03 s. The intervention was continued for 5 d per week with a 2-day rest for 8 consecutive weeks.
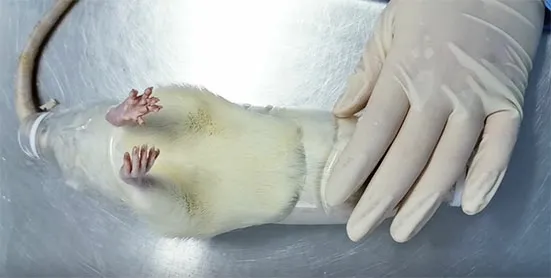
Figure 1. Homemade mouse fixer
1.5 Observation items and detection methods
1.5.1 General condition of rats
The general conditions of rats, such as coat color,body shape, diet volume, and urine volume, were observed and recorded every day, and the body mass of rats was measured and recorded every weekend.
1.5.2 Detection of glucose metabolism indicators
On the 7th, 14th, 21st, 28th, 35th, 42nd, 49th, and 56th days of the intervention, the rats fasted for 6 h from 6:30 a.m., and then blood was collected from the rat tail tip to measure and record the fasting plasma glucose (FPG).
Oral glucose tolerance test (OGTT) was performed before intervention (day 0) and after intervention(day 57) to monitor blood glucose changes. After fasting for 12 h, rats were given 50% glucose solution by gavage at a dose of 2 g/(kg·bw), and the blood glucose values at 0, 30, 60, 90, and 120 min were recorded,respectively. Plotted the changes and calculated the area under the curve (AUC).
After the OGTT on the 57th day, the rats were anesthetized with 20% urethane at 7 mL/(kg·bw).Abdominal aortic blood was collected and centrifuged at 3 500 r/min for 15 min to extract serum and plasma after being left for 4 h, which was then stored at -80 ℃.The level of rat fasting insulin (FINS) was detected by ELISA, and the homeostasis model assessment for insulin resistance (HOMA-IR) of the homeostasis model was calculated according to the formula: HOMA-IR =FINS × FPG ÷ 22.5.
1.5.3 Morphological observation of islets
Rats were sacrificed after blood collection under anesthesia. Then the whole pancreas was excised and fixed in 4% paraformaldehyde. After being repaired, the samples were routinely embedded in paraffin,sectioned, deparaffinized, stained with hematoxylineosin (HE), and mounted with neutral resin for preservation. The morphology of the islet tissue was observed under a microscope.
1.5.4 Inflammatory factor detection
ELISA kits were used to detect the levels of serum IL-1β, IL-6, and TNF-α of rats referring to the instructions.
1.6 Statistical methods
Measurement data meeting the requirements of normal distribution and homogeneity of variance were expressed as mean ± standard deviation (±s).Statistical analysis was performed using SPSS version 26.0 software. Pairedt-test was used for intra-group comparisons, and the independentt-test was used for inter-group comparisons. One-way analysis of variance was used to compare the data of multiple groups, the least significant difference method was used to compare differences between groups for data with homogeneity of variance, and the rank-sum test was used for data with heterogeneity of variance. Pearson correlation was performed to analyze the correlation between indicators.P<0.05 indicated statistical significance.
2 Results
2.1 General conditions
After modeling, the rats in the model group showed weight loss, increased food and water intake, and polyuria, which were the typical symptoms of T2DM. At the same time, the rat hair color was yellow and rough without luster, significantly different from rats in the normal group. In addition, the two random blood glucose levels of the model rats were higher than 16.7 mmol/L, with an average value of 19.43±2.02 mmol/L. All these indicated that the diabetic rat model was successfully established.
During the intervention period, the average weekly food and water intakes of each rat in the model group,the Mo-Rubbing abdomen group, and the metformin group were higher than those in the normal group,while the average weekly food and water intakes of each rat in the Mo-Rubbing abdomen group and the
metformin group were lower than those in the model group (Figure 2 and Figure 3). After the intervention,the body mass of rats in the model group, the Mo-Rubbing abdomen group, and the metformin group was significantly lower than that in the normal group(P<0.01), while the body mass of rats in the Mo-Rubbing abdomen group and the metformin group was greater than that in the model group, but the difference was statistically insignificant (P>0.05). See Figure 4.
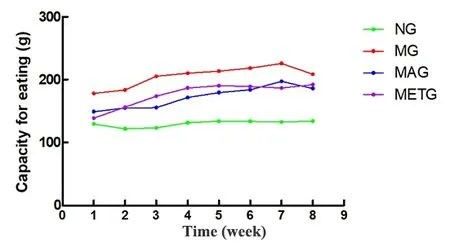
Figure 2. Changes in the weekly food intake per rat of each group during the intervention period
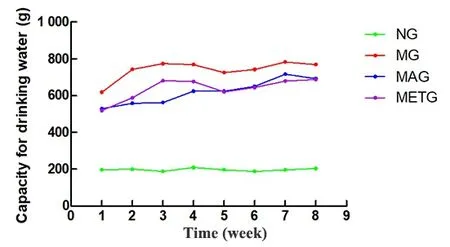
Figure 3. Changes in the weekly water intake per rat of each group during the intervention period
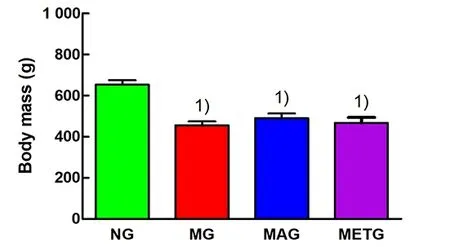
Figure 4. Body mass of rats in each group after intervention
2.2 Changes in glucose metabolism indicators
2.2.1 FPG
As shown in Figure 5, compared with the normal group, the FPG of the modeling rats was significantly increased before intervention (P<0.01). After 8-week intervention, the rat FPG in the model group, the Mo-Rubbing abdomen group, and the metformin group was still significantly higher than that in the normal group (P<0.01); compared with the model group, the FPG of rats in the Mo-Rubbing abdomen group and the metformin group was decreased, showing significant differences only between the Mo-Rubbing abdomen group and the model group (P<0.01); compared with the metformin group, the rat FPG in the Mo-Rubbing abdomen group was decreased, but the difference was statistically insignificant (P>0.05). The rat FPG in the Mo-Rubbing abdomen group and the metformin group after the intervention was significantly lower than that before intervention in the same group (P<0.01,P<0.05).
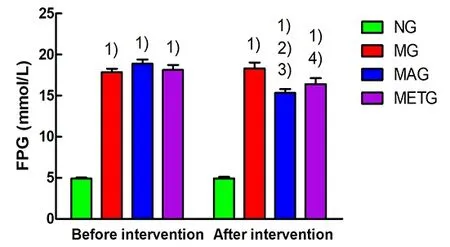
Figure 5. Changes in rat FPG of each group
2.2.2 OGTT
At the pre-intervention OGTT, the blood glucose values at each time point in the model group, the Mo-Rubbing abdomen group, and the metformin group were higher than those in the normal group. The blood glucose at 120 min of each model group was slightly higher than that at 0 min (Figure 6). At OGTT after the 8 weeks of intervention, the blood glucose peak in the normal group, the model group, and the metformin group appeared at 30 min, and appeared at 60 min in the Mo-Rubbing abdomen group. The blood glucose at 120 min in each group was similar to that at 0 min(Figure 7), which is consistent with the current literature[14-15].
As shown in Figure 8, before the intervention, the area under the curve at the oral glucose tolerance test(AUC-OGTT) in the model group, the Mo-Rubbing abdomen group, and the metformin group was significantly higher than that in the normal group(P<0.01). After the 8 weeks of intervention, the AUCOGTT of both the Mo-Rubbing abdomen group and the metformin group showed a downward trend compared with the model group, but only the Mo-Rubbing
abdomen group showed a statistical difference (P<0.05).The AUC-OGTT in the Mo-Rubbing abdomen group after the intervention was significantly lower than that before intervention (P<0.01).
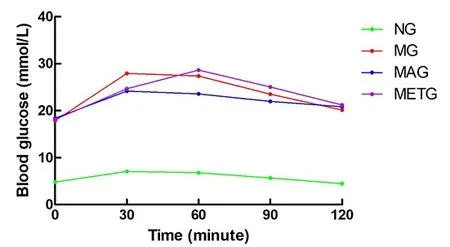
Figure 6. Changes in the blood glucose of each group during OGTT before intervention
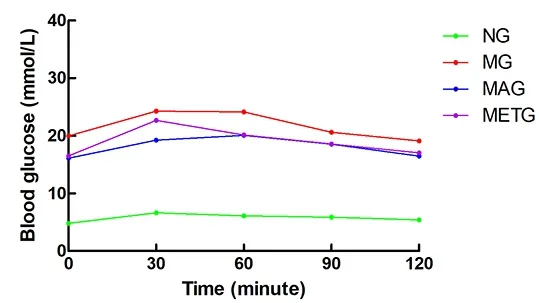
Figure 7. Changes in the rat blood glucose of each group during OGTT after intervention
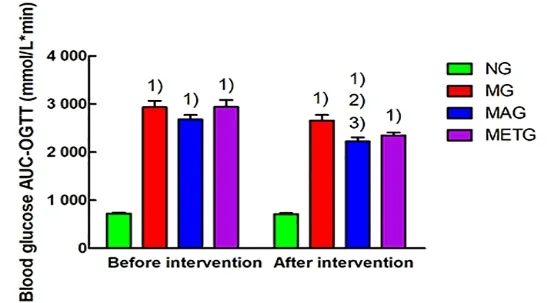
Figure 8. Blood glucose AUC-OGTT results in each group before and after intervention
2.2.3 Insulin resistance index
As shown in Figure 9-Figure 11, after 8 weeks of intervention, the FINS, FPG, and HOMA-IR of the model group were significantly higher than those of the normal group (P<0.01). Compared with the model group, the FINS, FPG, and HOMA-IR of the Mo-Rubbing abdomen group and the metformin group all showed a downward trend, but only the Mo-Rubbing abdomen group showed a statistically significant difference(P<0.05).
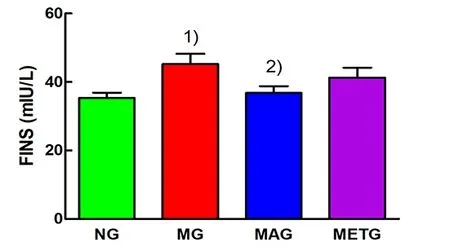
Figure 9. FINS levels of each group after intervention
Note: FPG=Fasting plasma glucose; NG=Normal group;MG=Model group; MAG=Mo-Rubbing abdomen group;METG=Metformin group; compared with the normal group,1)P<0.01; compared with the model group, 2)P<0.05
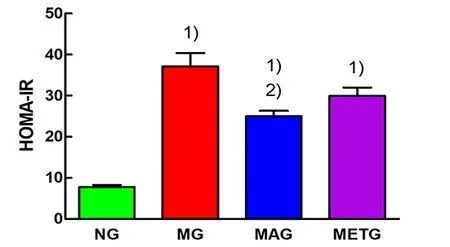
Figure 11. HOMA-IR levels of each group after intervention
2.3 Islet morphological changes
As shown in Figure 12, the rat islets in the normal group were normal in an oval shape, the islet cells were closely arranged, and the nuclear size was basically the same. The islets in the model group were severely damaged with irregular shapes, irregular edges, uneven arrangement of cells, and changes in the nuclear morphology. The islet morphology of rats in the Mo-Rubbing abdomen group was generally intact and mostly oval with clear borders, while a few nuclei showed compensatory enlargement, which was significantly improved compared with the model group.The islet morphology was basically intact, the cells were arranged relatively uniformly, and the nuclei showed compensatory enlargement without obvious damage in the metformin group.
2.4 Changes in inflammatory factors
As shown in Figure 13, after 8 weeks of intervention,compared with the normal group, the serum levels of IL-1β, IL-6, and TNF-α in the model group were significantly increased (P<0.01). Compared with the model group, serum IL-1β (P<0.05), IL-6 (P<0.01), and TNF-α (P<0.01) in the Mo-Rubbing abdomen group were significantly decreased; only serum TNF-α was decreased significantly in the metformin group (P<0.01).The serum levels of IL-6 and TNF-α in the Mo-Rubbing abdomen group were statistically significantly lower than those in the metformin group (P<0.01).
2.5 Correlation between blood glucose and inflammatory factors
As shown in Figure 14-Figure 16, blood glucose was significantly positively correlated with the levels of serum IL-1β (r=0.91), IL-6 (r=0.62), and TNF-α (r=0.83) in T2DM rats (P<0.01).
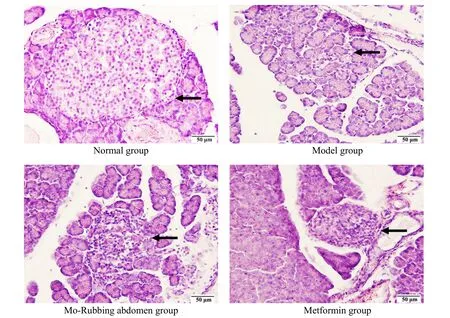
Figure 12. Islet morphology of rats in each group (hematoxylin-eosin staining, ×40)
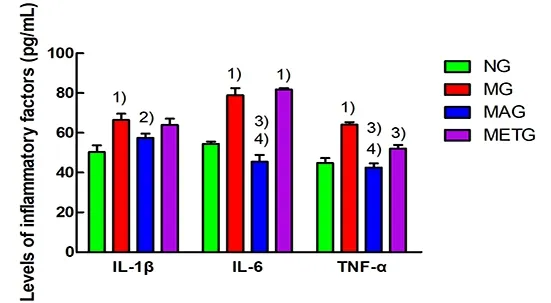
Figure 13. Serum IL-1, IL-6, and TNF-α levels of rats in each
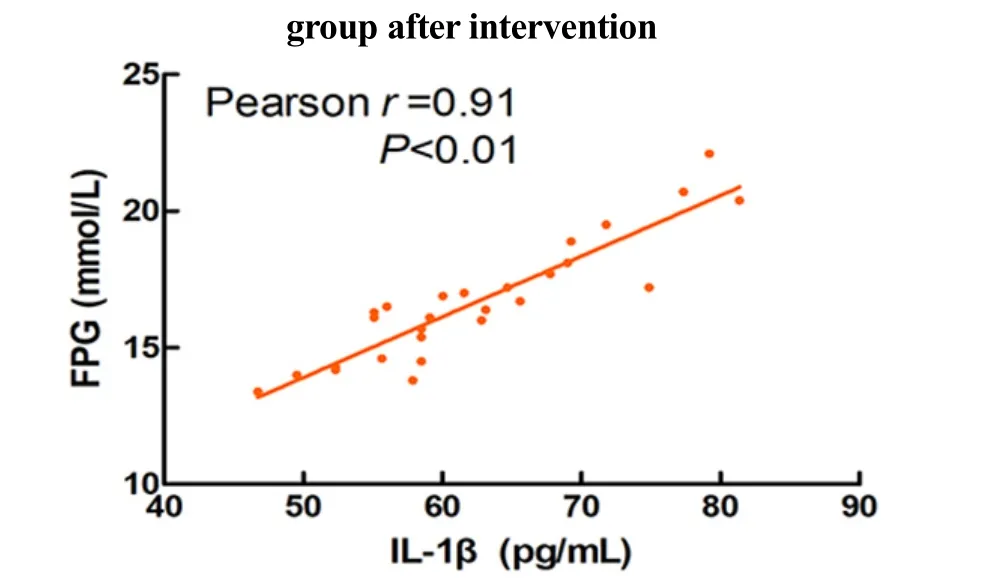
Figure 14. Correlation between the FPG and IL-1β in T2DM rats
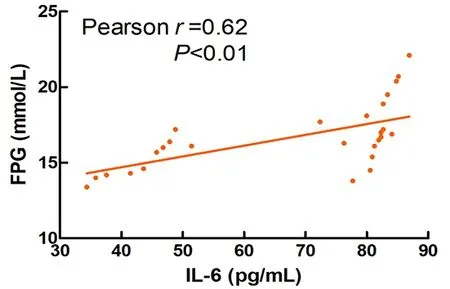
Figure 15. Correlation between the FPG and IL-6 in T2DM rats
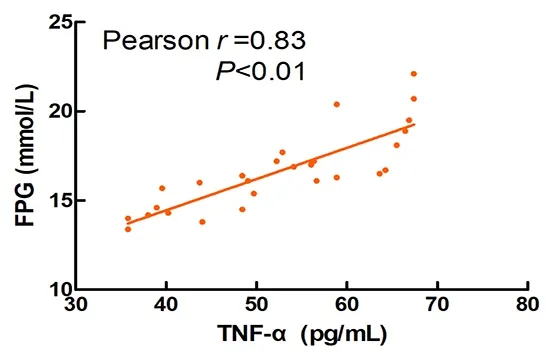
Figure 16. Correlation between the FPG and TNF-α in T2DM rats
3 Discussion
Traditional Chinese medicine believes that the occurrence of diabetes is closely related to spleen dysfunction. Diabetes treatment with Tuina (Chinese therapeutic massage) mostly adopts manipulations on points along the Spleen and Stomach Meridians and Mo-Rubbing abdomen manipulation to strengthen the spleen function, thus promoting digestion and removing stagnated food[16]. Clinical studies have shown that Mo-Rubbing abdomen manipulation controls blood glucose, improves blood lipid metabolism, and increases insulin levels in diabetic patients[16-17]. It has been reported that Mo-Rubbing abdomen manipulation affects the central nervous system by stimulating the gastrointestinal plexus and the vagus nerve, thereby regulating the body’s endocrine function[18-20]. The vagus nerve is an important part of the interconnection between the intestinal tract and the brain and has an anti-inflammatory property, mainly by activating the hypothalamic-pituitary-adrenal axis and promoting cortisol release to treat intestinal inflammatory diseases[21-22].
Inflammation reaction is closely related to diabetes,and chronic systemic inflammation accelerates the occurrence and development of T2DM[9,23-24]. The pro-inflammatory factor IL-1β is most closely related to the occurrence of diabetes among the inflammatory factors[23]. IL-1β can not only induce insulin resistance but also inhibit the function of pancreatic islet β cells,promote cell damage, and accelerate cell apoptosis[23,25].The insulin secretion function is mainly affected by oxidative stress and inflammatory response, among which IL-6 induces the occurrence of low-grade tissue-specific inflammation of pancreatic β cells,inhibits insulin secretion, and aggravates the damage of insulin receptors[9,26]. As another pro-inflammatory factor, TNF-α induces the phosphorylation of insulin receptor substrate 1, thereby preventing the interaction of insulin with its receptor, reducing insulin secretion,and leading to increased blood glucose[26]. Studies have found that the Mo-Rubbing abdomen manipulation reduces IL-1β levels in the pancreas of diabetic rats,down-regulates Caspase-3 expression, and up-regulates the expression of the apoptosis-inhibiting gene Bcl-2,thereby slowing down the process of endogenous cell apoptosis and promoting cell damage repair of pancreatic islets[27]. The Caspase family plays a crucial role in apoptosis and inflammatory signaling[28], which is regulated by the upstream nuclear factor kappa-B(NF-κB) signaling pathway. Studies have found that hyperglycemia activates the NF-κB signaling pathway,promotes the release of NOD-like receptor protein 3(NLRP3) inflammasomes, induces inflammation and oxidative stress, and aggravates the occurrence of apoptosis[29-31]. Elevated fasting blood glucose and impaired tolerance to glucose administration are both manifestations of pancreatic β-cell dysfunction[32].Animal studies have confirmed that the occurrence of inflammatory response increases insulin resistance,resulting in increased blood glucose[3]. Therefore,reducing inflammatory response can not only improve islet function, but is also the key to regulating blood glucose in diabetic patients.
The results of this experiment showed that Mo-Rubbing abdomen intervention reduced the levels of serum IL-1β, IL-6, and TNF-α in T2DM rats. At the same time, it was found that the levels of inflammatory factors IL-1β, IL-6, and TNF-α were positively correlated with FPG in T2DM rats. This suggests that Mo-Rubbing abdomen manipulation may promote glucose metabolism and control blood glucose by reducing inflammation. In addition, Mo-Rubbing abdomen manipulation reduced the AUC-OGTT and the levels of glucose metabolism indicators such as FPG, FINS, and HOMA-IR, while it improved the islet cell morphology and reduced the islet structural damage, which suggests that Mo-Rubbing abdomen manipulation reduces the occurrence of insulin resistance in T2DM rats and promotes the repair of islet β-cell function. We speculate that the effect of Mo-Rubbing abdomen manipulation on glucose metabolism and inflammatory response may be caused by stimulating the gastrointestinal plexus and the vagus nerve, activating the hypothalamic-pituitary-adrenal axis, inducing the cortisol release, inhibiting the inflammatory response,and regulating the endocrine. This conjecture provides new ideas and directions for further investigation of related pathways.
Our study found that Mo-Rubbing abdomen manipulation reduced blood glucose in T2DM rats,which is contrary to the literature[18]and may relate to the following points. First, the intervention methods are different. The stroking massage on the rat abdomen was used in the literature, while we used Mo-Rubbing abdomen manipulation along the intestinal wall with mechanical stimulation by applying certain pressure. At the same time, we used the stress test system to control the intervention strength to ensure a quiet and comfortable state of rats, which is consistent with the clinical application. Second, the research subjects are different. Normal SD rats were used in the literature,while we only observed the diabetic SD rats and not the normal rats. Therefore, we speculate that the action mechanism of Mo-Rubbing abdomen manipulation on normal rats and diabetic rats may be different. Third,the intervention duration and frequency were different.The duration of each intervention was 5 min, and the effects after the 3th and the 14th interventions were observed respectively in the literature. In comparison,the duration of each intervention in our study was 20 min, and the intervention effect was observed for 8 weeks. The stress response during abdominal massage in rats promotes the release of cortisol from the adrenal glands, which are sensitive to increased blood glucose[21-22,33]. We speculate that long-term Mo-Rubbing abdomen intervention will induce rat’s adaptation to reduce stress, thus producing a different effect than short-term intervention. Diabetic patients need long-term maintenance treatment to control their blood glucose, so the long-term intervention we adopted is also closer to clinical treatment.
In conclusion, the findings of this study suggest that the Mo-Rubbing abdomen manipulation may reduce systemic inflammatory responses, improve islet morphology, and reduce insulin resistance, so as to achieve the effect of controlling blood glucose in T2DM rats. This provides a certain theoretical basis for controlling blood glucose in T2DM patients with Mo-Rubbing abdomen manipulation. Further research on the drug intervention combined with Mo-Rubbing abdomen manipulation in T2DM rats can be conducted to optimize the treatment strategy and reduce the adverse reactions of long-term medication in the future.
Conflict of Interest
The authors declare that there is no potential conflict of interest in this article.
Acknowledgments
This work was supported by the Second Batch of Scientific Research Project of the National TCM Clinical Research Base of the State Administration of Traditional Chinese Medicine (国家中医药管理局国家中医临床研究基地业务建设第二批科研专项课题, No. JDZX2015127);Postgraduate Research & Practice Innovation Program of Jiangsu Province (江苏省研究生培养创新工程研究生科研与实践创新计划, No. KYCX20_1538); Undergraduate Innovation and Entrepreneurship Training Program of Jiangsu Province (江苏省大学生创新创业训练计划, No.201910315071Y).
Statement of Human and Animal Rights
The treatment of animals conformed to the ethical criteria in this experiment.Received: 20 January 2021/Accepted: 27 September 2021
猜你喜欢
杂志排行
Journal of Acupuncture and Tuina Science的其它文章
- Efficacy of mild moxibustion combined with surgery for meniscal injury and its effect on TGF-β1 and PDGF levels in the fluid of knee joint
- Clinical study on tube moxibustion plus point-toward-point needling method in treating refractory facial paralysis
- Effect of electroacupuncture at different time points on the recovery of gastrointestinal function after surgery for gastrointestinal malignant neoplasms
- Influence of buccal acupuncture on analgesic effect,immune indicators, and expression of Survivin and Livin proteins in patients with advanced-stage primary liver cancer
- Effect of acupuncture-like transcutaneous electrical nerve stimulation on labor pain in nulliparous women: a randomized controlled trial
- Influence of herbal cake-partitioned moxibustion on lumbar functions and inflammatory factors in patients with lumbar disc herniation due to kidney deficiency and blood stasis