In Situ Observation of Silt Seabed Pore Pressure Response to Waves in the Subaqueous Yellow River Delta
2022-10-24SONGYupengSUNYongfuWANGZhenhaoDUXingSONGBinghuiandDONGLifeng
SONG Yupeng, SUN Yongfu, WANG Zhenhao, *, DU Xing, SONG Binghui, and DONG Lifeng
Observation of Silt Seabed Pore Pressure Response to Waves in the Subaqueous Yellow River Delta
SONG Yupeng1), 2), SUN Yongfu1), 2), WANG Zhenhao1), 2), *, DU Xing1), 2), SONG Binghui1), 2), and DONG Lifeng1), 2)
1),,266061,2),,266237,
Thepore pressure response of silt under wave action is a complex process. However, this process has not been well studied because of limited field observation techniques. The dynamic response process is closely related to engineering geological hazards; thus, this process must be urgently explored. A long-termobservational study of the silt sediment pore water pressure response process under wave action was conducted in the subaqueous Yellow River Delta. The response characteristics of pore water pressure are affected by tidal level and wave height. Tidal level affects the overall trend of the pore water pressure response, while wave height influences the amplitude of the pore water pressure response. This study revealed a significant lag effect in the pore pressure response. The transient pore pressure in the seabed did not respond immediately to the wave-induced pressure stress on the seabed surface. This phenomenon may be attributed to the change in soil permeability. The maximum response depth was approximately 0.5m with a 2m wave height. A concept model of silt soil pore pressure response under different types of wave action was developed. The accumulation rate of the pore pressure is less than the dissipation rate; thus, the developed model highlights the oscillation pore pressure response mechanism. The highlighted response process is of considerable importance to transient liquefaction and the startup process of pore pressure response.
silt seabed; pore pressure response;observation; the subaqueous Yellow River Delta
1 Introduction
Submarine soil liquefaction is a common phenomenon of geological disasters. The loss of the soil bearing capacity after liquefaction will have a significant impact on submarine pipelines, submarine cables, and offshore platforms. Pore water pressure, abbreviated as pore pressure, plays an important role in the dynamic response and liquefaction process of the external load in submarine soil (Sumer and Fredsøe, 2002; Jia., 2020). The cyclic loading of waves produces excess pore water pressure in the seabed, and its amplitude is the main controlling factor affecting seabed liquefaction (Liu., 2006). Research on the dynamic response and liquefaction of the seabed under wave action began in the 1940s. Early studies were conducted using sand soil as the research object. Theoretical studies of wave- seabed interactions led to the construction of the constitutive model (Putman, 1949; Sleath, 1970; Yamamoto., 1978). The properties of silt, such as clay content and per- meability, lie somewhere between sand and clay. Disintegration may occur upon silt-water interaction, except for the cases with sufficient viscosity. Thus, considering silt as an elastic or viscous medium is impossible. The mechanism of wave-induced silty seabed failure and pore pressure response is complicated (Li., 2012) and not well understood.
With the development of high-precision laboratory simu- lation tests, the stress-strain relationships, pore pressure accumulation, and dissipation processes of submarine soil have been extensively studied by simulating wave action on the seafloor. Common laboratory simulation test methods include the dynamic three-axis test (Wu and Sun, 2013), dynamic-loading ring shear test (Sassa., 2012), tank model test (Sumer and Cheng, 2006), centrifugal modeling test (Chen, 2013), and shaking table test (Zhang., 2016). The laboratory simulation tests are the most common research methods. However, the size effect and expe- rimental boundary conditions cannot simulate the real conditions, which limits the interaction of the simulated wave and the seabed soil.
data obtained from field monitoring of the pore pressure of submarine soil under wave action can accurately reflect the influence of wave action on the internal stress of soil and deduce the mechanism of the liquefaction process. Therefore, obtaining the pore pressure data in real time is crucial. However, field monitoring of the pore pressure of submarine soil is progressing slowly because of the high research cost and technical difficulty associated with this type of research. Few studies exist on the monitoring of pore pressure and the liquefaction process in a silt seabed during storms (Bennett, 1977; Okusa and Uchida, 1980; Liu., 2006; Wang., 2017).pore pressure monitoring of a silt seabed under the action of strong wind and waves was conducted in the current study. The obtained data were further analyzed for the porepressure variation characteristics and process of the siltunder the action of the strong wind and waves. The results will provide a basis for subsequent liquefaction research.
2 Monitoring Equipment
The pore pressure monitoring equipment was self-deve- loped. The core part is a pore pressure monitoring probe (Fig.1a). The pore pressure monitoring probe is a 4.2m long segmented multisection structure with four pore water pressure sensors. Sensor numbers 1–4 correspond to depths of 0.5, 1.5, 2.5, and 3.5m, respectively. The probe is inserted into the seafloor using a penetration device (Fig.1b). After the probe is inserted to a predetermined depth, the penetration device is brought back on board, and the probe is set to acquire and store data automatically.Three minutes of data are automatically recorded every 30min with a frequency of 0.5Hz during the monitoring period. The pore pressure monitoring probe was deployed in February 2015. Wave, tidal, and current data were collected during the monitoring period.
3 Selection of Monitoring Position
Silt is widely distributed in the Yellow River Delta and is prone to liquefaction under wave action, which affects the stability of established facilities on it. The Chengdao Oilfield (a major offshore oil and gas development in the Shengli Oilfield) was selected as the study area. This oilfield was formed by flow from the Yellow River through Shenxiangou and Diaokou Basins. The aforementioned flowis characterized by a shallow layer of silt with a short consolidation time. Monitoring seafloor silt pore pressure under wave action in this area will have strong theoretical sig- nificance and application value. The position of the monitoring station and a 200m×200m topographic map of the study area are shown in Fig.2.
Before the monitoring probe was deployed, a bathymetric survey, shallow profile survey, and geological drilling wereconducted at the monitoring position. The monitoring position topography is flat with a mean water depth of 9.5m, which is suitable for the deployment and recovery of the monitoring equipment. The soil layer structure of the moni- toring site is undisturbed with high homogeneity. A 4.5m thick disturbed area is adjacent to the monitoring site (Fig.3a). The cone resistance results show a high-strength layer at a depth of 0.7–2m (Fig.3b). The surface soil is a typical silt deposit with a thickness of 5.0m based on a core sample at the site. The geotechnical characteristics of the surface silt are shown in Table 1.
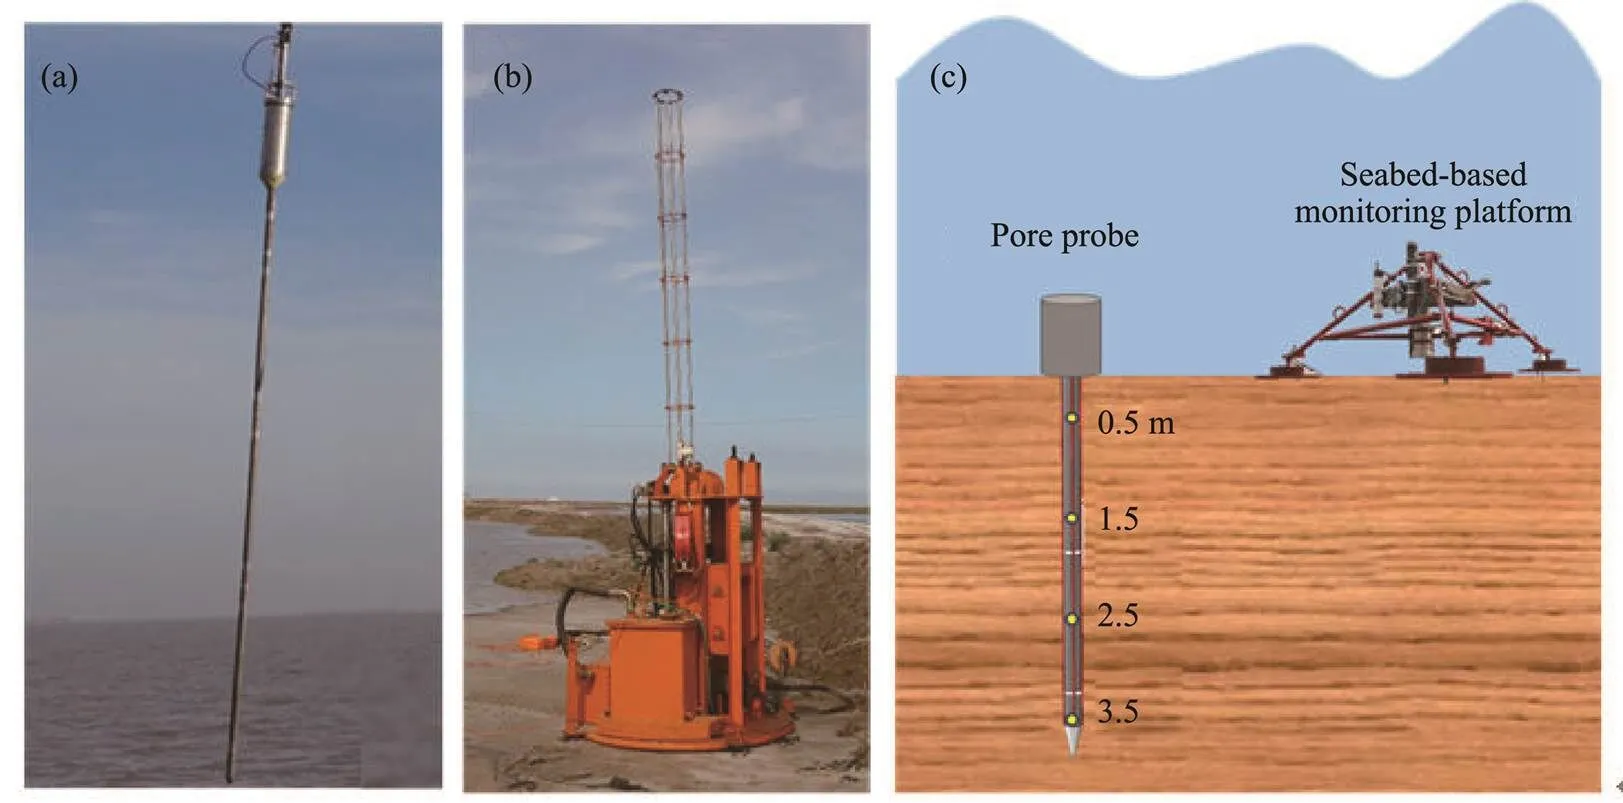
Fig.1 Pore pressure monitoring equipment: (a), pore monitoring probe; (b), penetration equipment; and (c), emplacement sketch of the monitoring instruments, including pore probe and seabed-based monitoring platform (carrying hydrodynamic sensors).
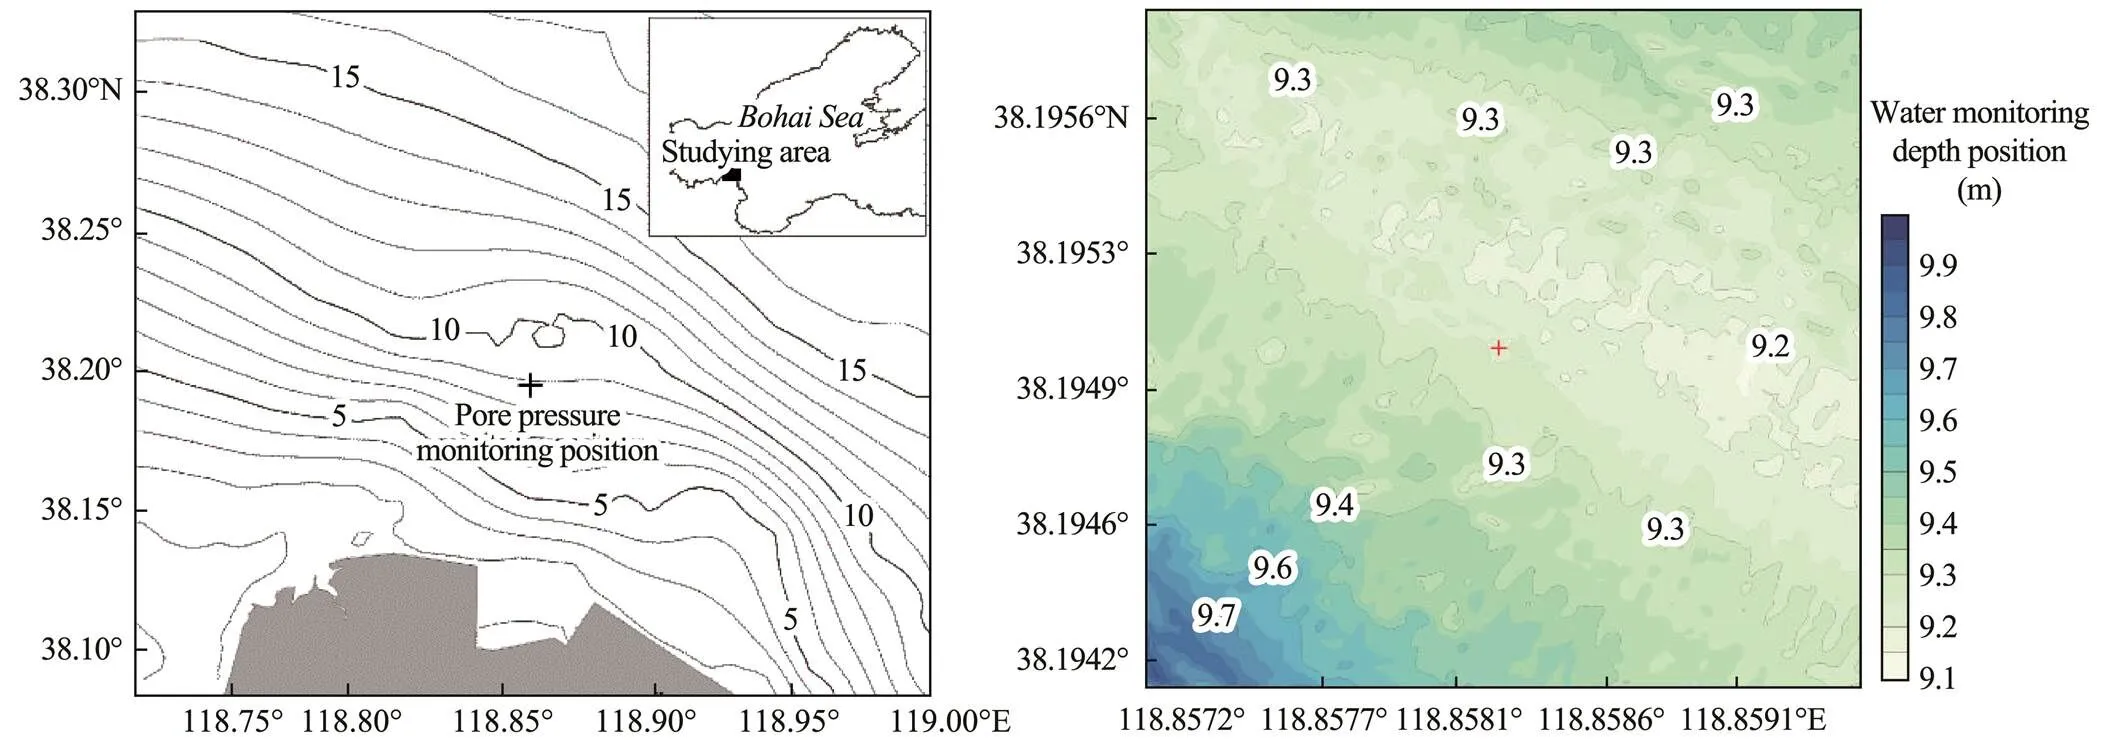
Fig.2 Position and topographic map of the monitoring site.
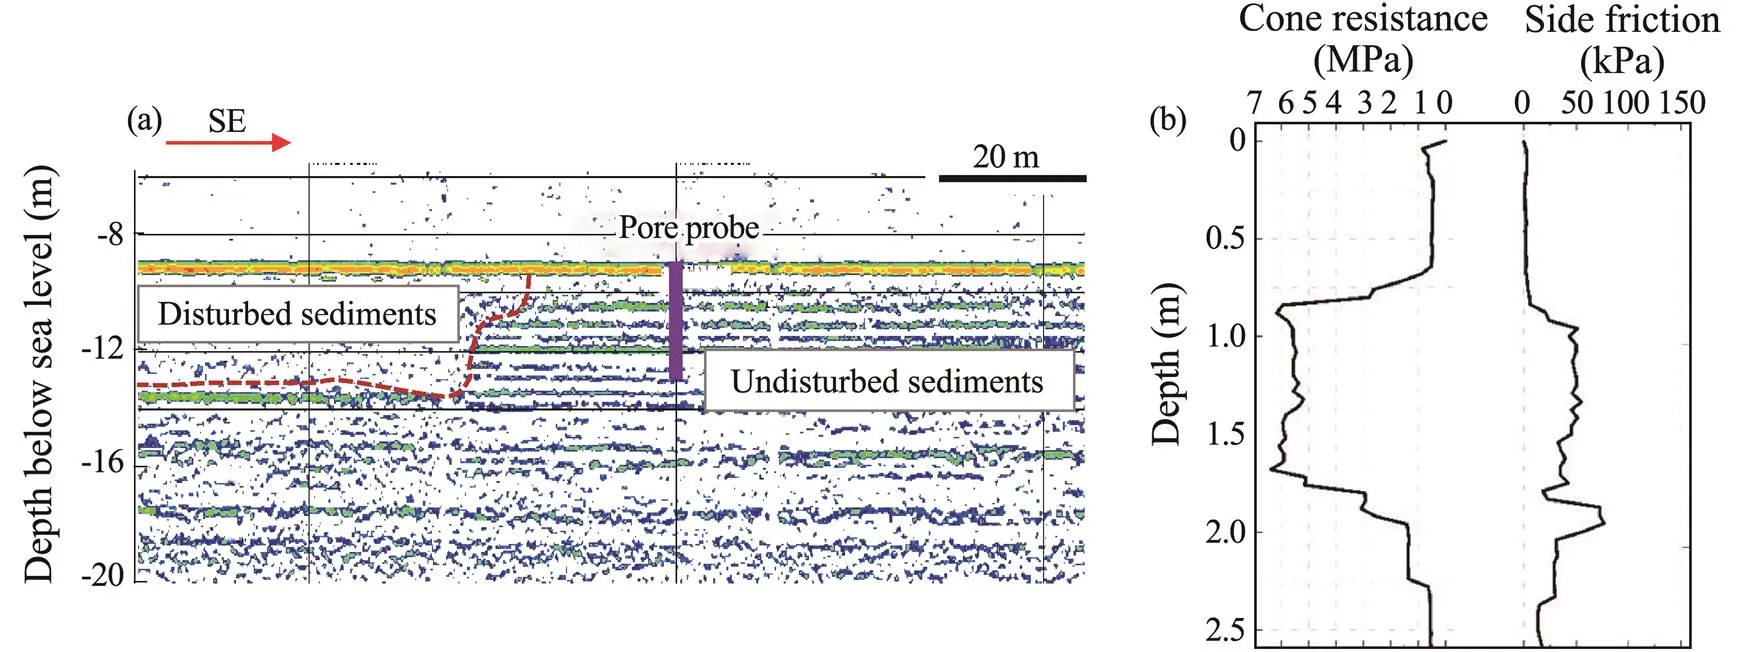
Fig.3 Sub-bottom profile and cone penetration test results from the observation site.

Table 1 Characteristics of silt at monitoring positions within a depth of 5m
Note: The data in the table were obtained from laboratory geotechnical tests following the standard for soil test method (GBT 50123-1999).
4 Characteristics and Process of Pore Pressure Response
One typical high wave process is chosen as the study period (March 8th at 14:00 to March 10th at 10:30); during this period, the pore water pressure variation characteristics were comprehensively analyzed. The duration of the high wave processes was over 30h. The significant wave height was up to 2.2m. The pore pressure, wave height, and tidal level time history curves are shown in Fig.4. Data collected at three-minute intervals were used to draw a continuous curve to observe the overall variation trend of the pore pressure.
The variation trend of the pore pressure measured by thefour sensors was remarkably similar, differing by only approximately 10kPa. When the hydrodynamic effect chang- ed the pore pressure of the seabed soil, the No.1 sensor responded first, followed by sensor Nos.2–4. This pattern was determined by the permeability of the soil. The curve shows a period of oscillating pore pressure with a high amp- litude (March 8th at 17:30 to March 9th at 21:00) corresponding to the high wave period (Fig.4).
The variation trend of the pore pressure is consistentwith that of the tidal level, which indicates that tide level variations may be the dominant factor causing increasing and decreasing trends of the pore pressure. Pore pressure generally responds to waves and tide. Pore pressure includes hydrostatic and excess pore water pressure. However, only the excess pore water pressure plays a role in soil liquefaction. Changes in tidal level are relatively slow and stable, which is unlikely to induce the formation of excess pore water pressure. Moreover, these changes only endow the hydrostatic pressure with a corresponding response, as shown in the curve trend in Fig.4. Compared with changes in the tidal level, the period of waves is short. Therefore, the cyclic loading of waves will lead to a high amplitude oscillation in pore pressure and the formation of excess pore water pressure in the soil.
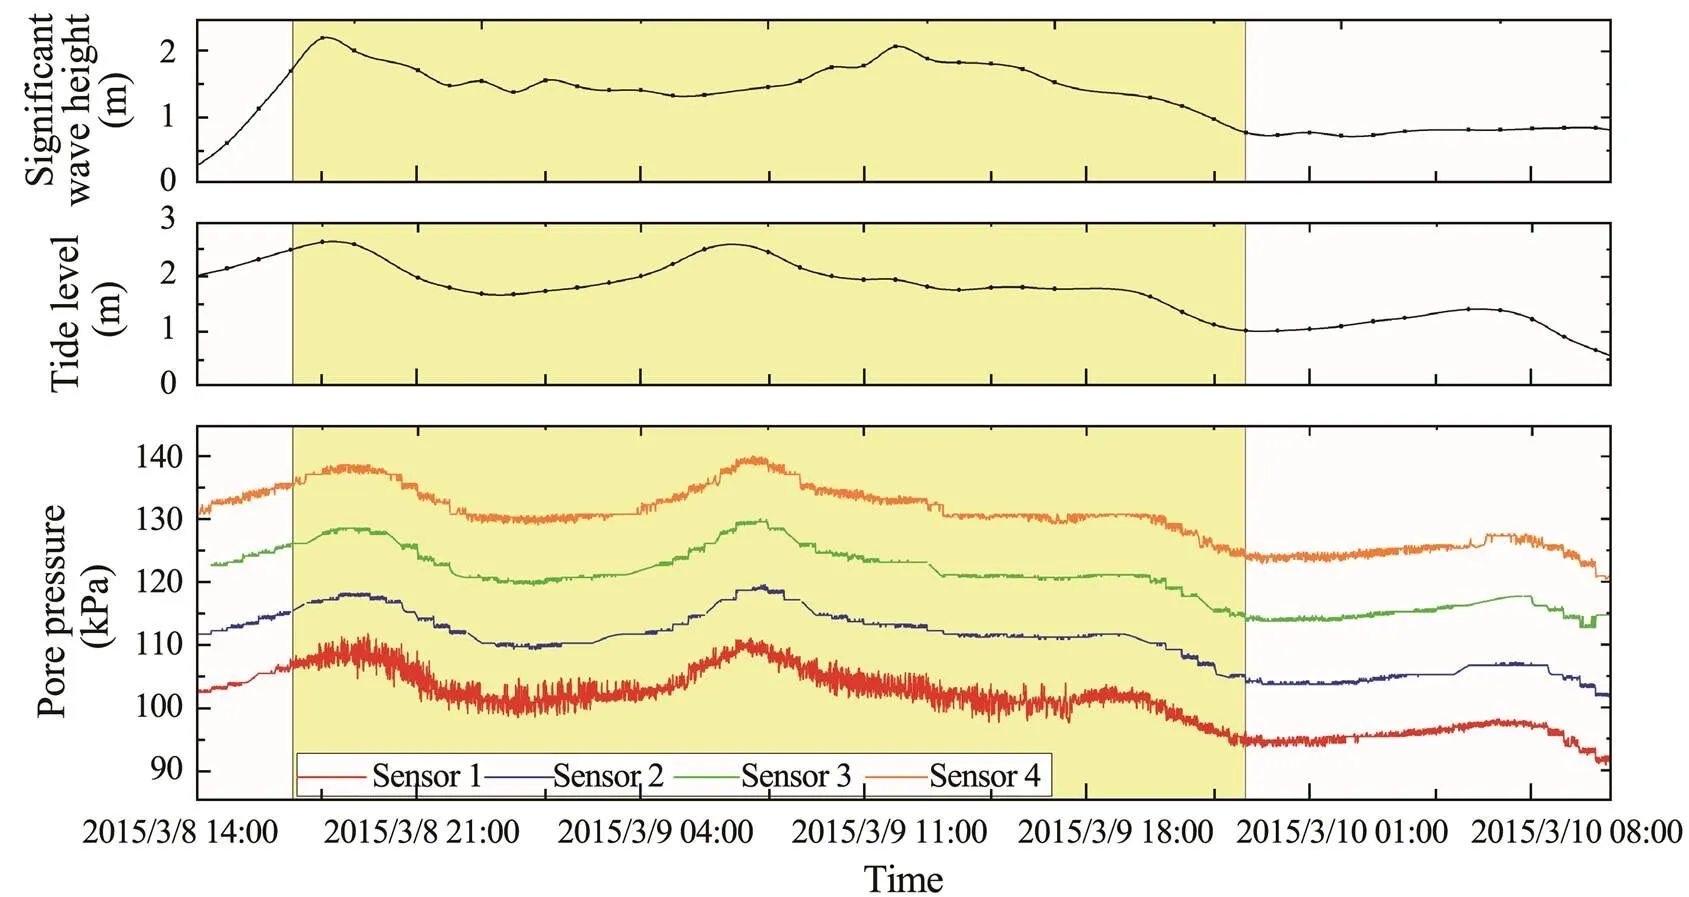
Fig.4 Time history curve of wave height, tide level, and pore pressure.
The pore pressure changes due to tidal levels were eli- minated to study pore pressure in the silt under wave action. Fig.5 shows that the overall trend of wave-induced pore pressure responses was flat.
Figs.4 and 5 show that the pore pressure measured by the No.1 sensor was strongly affected by wave action. The amplitude of the pore pressure trend drastically increased during the period of high wave height, indicating that pore pressure had a significant response to wave action. The porepressure response gradually weakened when the wave heightdecreased. However, the influence of waves on pore pressure at depths larger than 1.5m was insignificant. Notably, the wave height was initially substantially small (Fig.4), which cannot possibly induce a pore pressure response. Meanwhile, the data of each sensor demonstrateda certain degree of oscillation, which should be regarded as sensor background values. Therefore, the depth of the silt that can be significantly affected under wave action (1.5–2m significant wave height) is approximately 0.5–1.5m. An occasional slight fluctuation at depths larger than 1.5m is also observed.
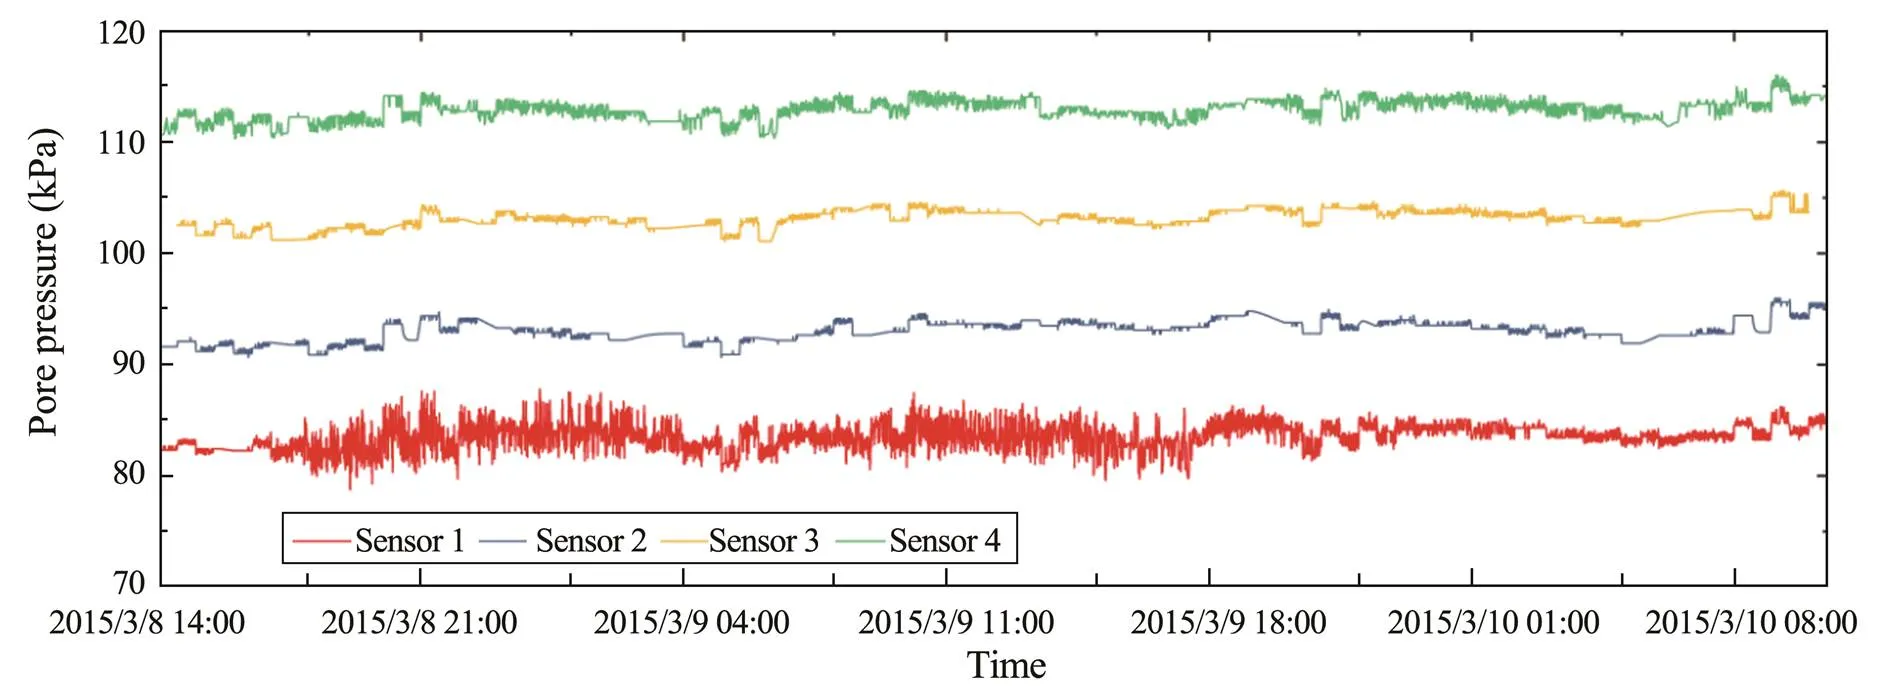
Fig.5 Wave-induced change in pore pressure.
5 Discussion
5.1 Lag Effect of Pore Pressure Response
The oscillation response of pore pressure is dominated by the cyclic action of wave crests and troughs.observational data revealed a significant lag effect in the porepressure response during the high wave period. The oscillation response of the pore pressure did not immediately appear as the wave height increased under an approaching storm. Similarly, when the wind and waves were reduced, the pore water pressure oscillation amplitude did not decrease immediately but continued to oscillate for a period.
During the high wave period in March, periods of increasing and decreasing wave height were chosen to analy- ze the evolution of pore pressure response to wave actions (Fig.6). The results showed that the pore pressure did not increase or oscillate rapidly when the wave height increasedrapidly. Instead, the pore pressure remained relatively stable for a period before the intense oscillation began (Fig.7). When the significant wave height was larger than 2m at the beginning of the oscillation response, the oscillation was in a high-amplitude status throughout the entirehigh wave process, even though the wave height was lower than that at the startup of the pore pressure response. As the storm neared its end, the wave height decreased rapidlywhile the pore pressure oscillation response was maintained until the wave height was lower than 0.8m (Fig.7).
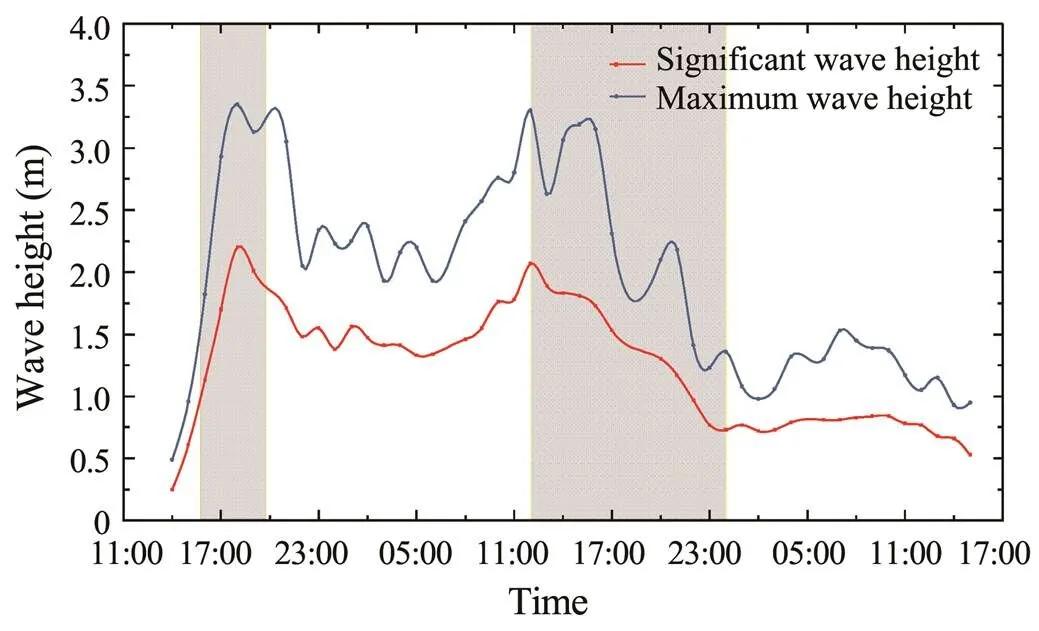
Fig.6 Periods of wave height increase and decrease (March 8th to 9th).
Different from the pore pressure phase-lag effect, which is a conspicuous phase lag in the pressure that emerges as depth increases (Wang., 2014), the lag effect highlighted in this study indicates that the transient pore pressure in the seabed does not respond immediately to the wave-induced pressure stress on the seabed surface possibly due to the change in soil permeability. The collected data during the 17:30–18:00 period (Fig.7) show the sudden initiation of significant transient pore pressure response at the 0.5m depth. The pore pressure response before the initiation was weak, even negligible, and without pore pre- ssure accumulation. Theobservation data revealed a significant difference between the wave heights associated with the initiation and end periods of the pore pressure response. This finding indicated that the permeability of sediment above 0.5m depth changed under wave action,increasing the sensitivity of the pore pressure dynamic response. Therefore, the pore pressure oscillation could be significant under wavelet action near the end of the storm. Theobservation and wave flume test results of Wang. (2020) demonstrated that the failure zone gradually expanded under wave action after the initiation of sediment failure. The failed sediments underwent oscillating motion governed by wave actions. The large shear strain facilitated the rearrangement of sediment grains and the increase in pore volume during this process. Consequently, the porosity and permeability of the sediments increased. Thepore pressure data in this study support the conclusion of Wang. (2020). The mechanism of the transient pore pressure response lag effect is also explained by this theory.
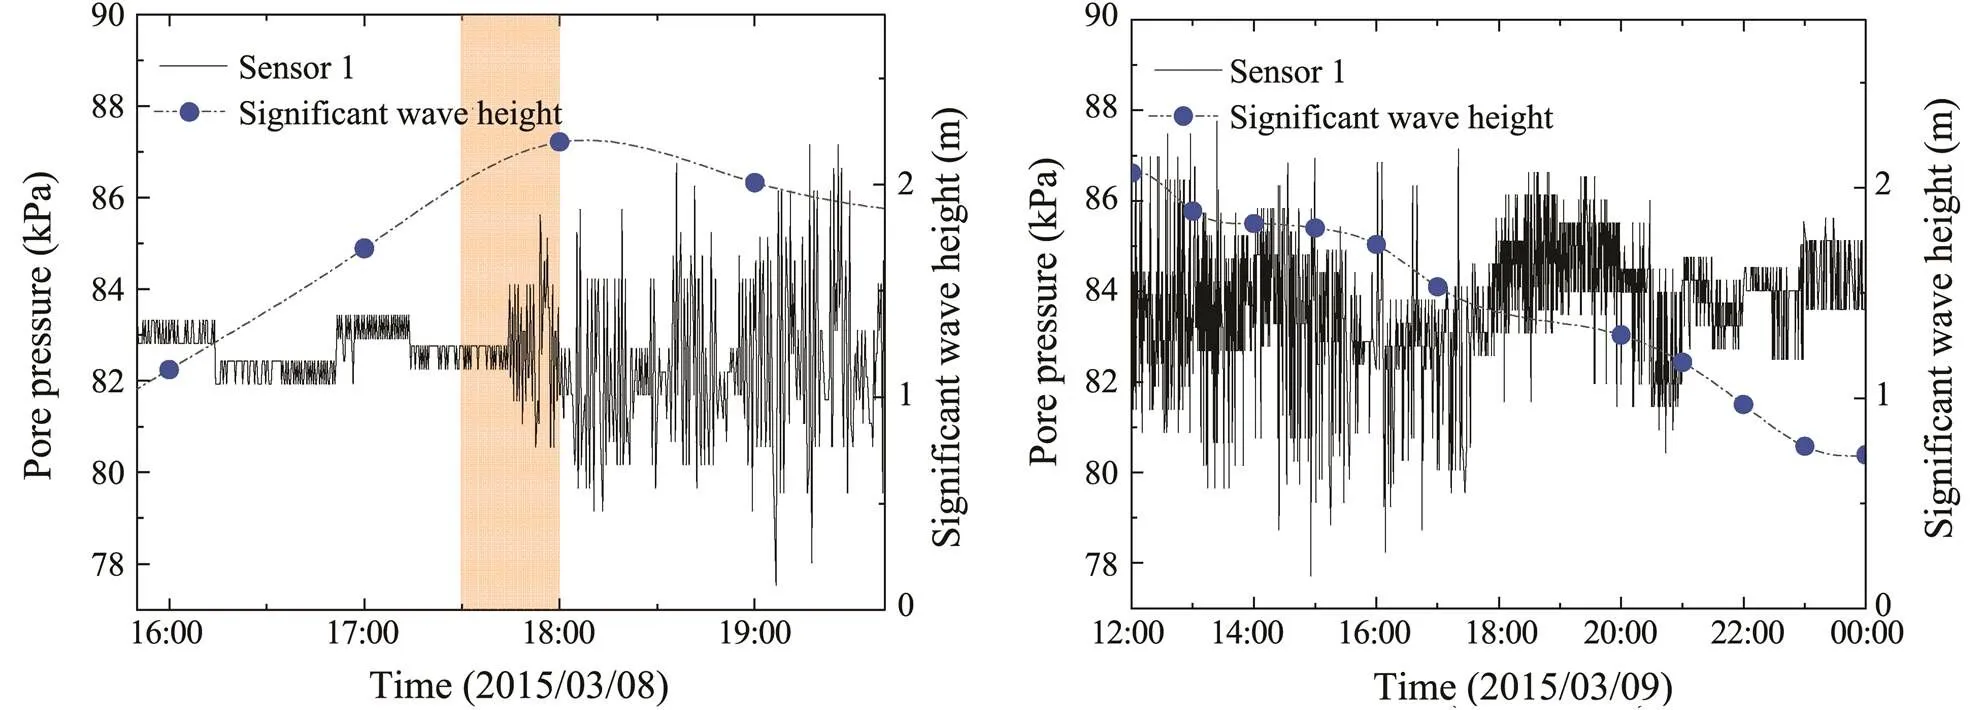
Fig.7 Change process of pore pressure with the increase and decrease of wave height.
5.2 Characteristics of Excess Pore Pressure Response
Two phenomena, including the transient and cumulative responses of the soil under the action of waves, have been found through field monitoring and indoor simulation experiments (Nago., 1993;Jeng and Seymour, 2007; Jeng, 2012).The transient response is also called the oscillating response. This response is the real-time pulsation of the pore water pressure in the soil to the wave action, which is often accompanied by amplitude attenuation and phase retardation of the pore pressure (Yamamoto., 1978; Jeng, 1997). The cumulative response is the residualpore pressure increasing or decreasing effect of submarine soil under the wave circulation action. This phenomenonis caused by the compression deformation of soil skeletonsand is similar to the soil liquefaction caused by earthquakes (Seed and Rahman, 1978; Sumer., 1999). In contrast to residual liquefaction, instantaneous liquefaction (also called ‘momentary liquefaction’) is induced by upward seepage in the upper layer of the seabed under wave troughs. Similar to the quicksand phenomenon, the instantaneous liquefaction may particularly occur in a sandy or nonplastic silty seabed. The buoyant weight of the soil is balanced by the seepage force, and the confining stress vanishes during instantaneous liquefaction (Qi and Gao, 2018).
The excess pore pressures at each depth were obtained in the current study by subtracting the overlying static pore pressure from the total pore pressure. Notably, the excess pore pressure shown in Fig.8 can only reflect the accumulation or dissipation trend of the excess pore pressure due to the lack of dynamic water pressure parameters on the seabed surface. The oscillation amplitude cannot quantitatively describe the transient or accumulation of the excess pore pressure inside the seabed. The sensor data at four depths reveal that only sensor No.1 had a dynamic response, which is a transient oscillation response accompanied by a slight accumulation and dissipation of pore pressure. Sensor No.2 had only a slight accumulation and dissipation of pore pressure, with almost no oscillation re- sponse. Excess pore pressure does not typically accumulate under weak wave action due to its relatively high dissipation rate. In addition, no significant excess pore pressure gradients compared with those of each depth exist, indicating that the wave actions were insufficiently strong to induce seepage in the deep soil. Thus, these gradients can not produce excess pore pressure oscillation, accumulation, or subsequent soil liquefaction. No wave-induced excess pore pressure in the soil under 0.5m below the seabed is observed, and the soil deeper than 0.5m below the seabed could not be easily liquefied.
As mentioned above, the permeability of the shallow soil gradually changed under cyclic wave loading, leading to a sudden increase in the transient pore pressure amplitude. While no significant pore pressure accumulation wasobserved, the transient and residual pore pressure responses may not have occurred simultaneously. The transient response of the pore pressure is sensitive to the silt soil, which is highly significant for the pore pressure response and the silt liquefaction process.
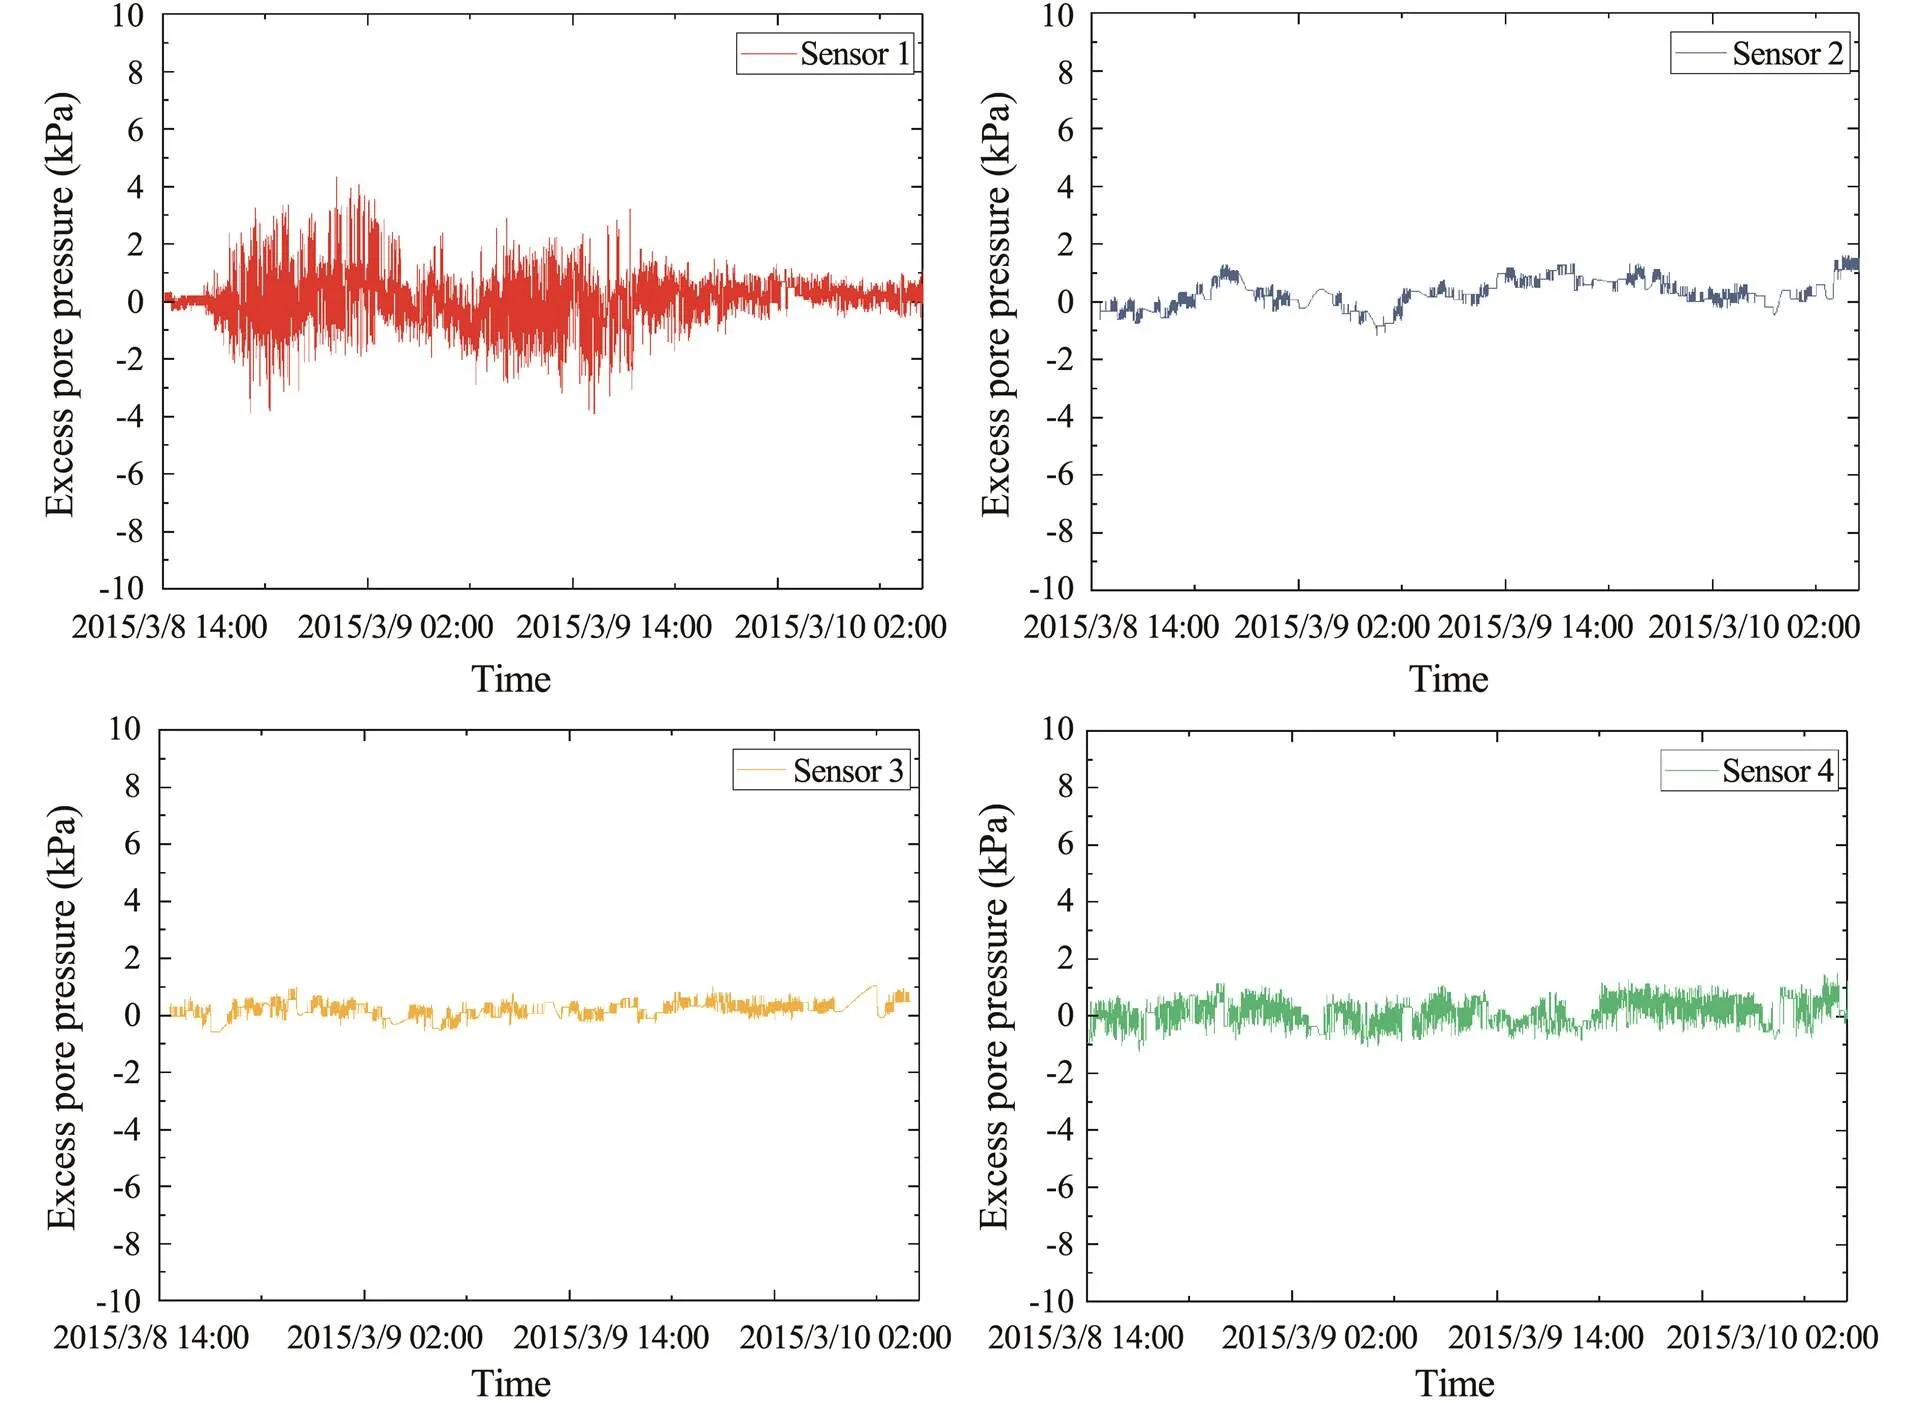
Fig.8 Change in excess pore pressure from each sensor.
5.3 Concept Model of Pore Pressure Response
Wave action will change the stress state inside the soil and then influence the pore pressure in the seabed silt.The stress within the soil due to waves is gradually transferred into the soil particles through the pore water.The cyclic stress induced by the wave will increase the pore pressure in the silt. The pore water pressure will then continue to de- crease through pore permeability.Therefore, the variation in pore pressure development depends on the difference be- tween the rate of pore pressure accumulation and dissipation.When the depth of the seabed deepens, the increase in pore pressure caused by waves is weakened and the pore permeability decreases. Meanwhile, the pore pressure no longer responds when the depth of the seabed exceeds the scope of the wave action.Under different soil conditions, amaximum depth of pore pressure response is observed under different conditions of wave action.
The current study summarizes a concept model of silt soil pore pressure response under different wave actions, as shown in Fig.9. Within the scope of the wave action in- fluence depth, an oscillation response with a small amplitude occurs when the wave action intensity is substantiallysmall. The oscillation response persists with increased amplitude as the wave height rises. However, the pore pressure has no cumulative response because its accumulation rate is less than the dissipation rate. Oscillation and cumulative response in the pore pressure emerge when the wave action is sufficiently strong. Soil failure occurs when the cumulative pore pressure reaches the critical value of instability (Wang and Liu, 2016). Notably, the process of pore pressure accumulation has been covered in previous research (Sumer., 2006). However, the process of pore pressure oscillation response without an accumulating response is often ignored. This process is of considerable im- portance for transient liquefaction (Qi and Gao, 2018) and the initiation of the pore pressure response.
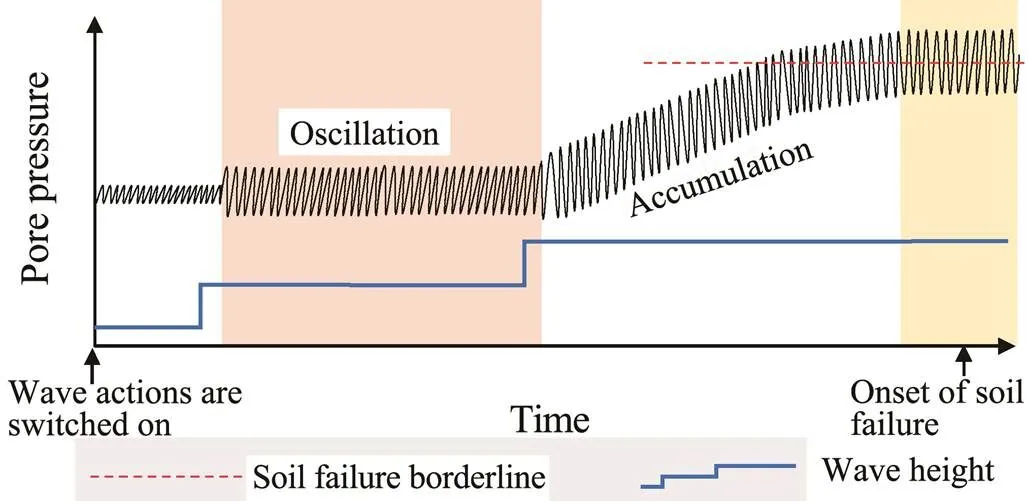
Fig.9 Concept model of pore pressure response under different wave actions (lag effect of pore pressure response is considered in the model).
6 Conclusions
Independently developed pore pressure monitoring equip- ment was used to collectobservations of pore pressure responses in the subaqueous Yellow River Delta during a period of strong waves. Theobservation me- thods are advanced. Valuable data were accurately record- ed at different depths. The complete process of pore pressure response from initiation to the end during a storm was revealed.
The trend of total pore pressure is controlled by changesin tidal level. Wave-induced pore pressure response is main- ly an oscillation response without accumulation due to the insufficiently strong wave action. The maximum response depth was approximately 0.5m with 2m wave heights. A significant lag effect is observed in the pore pressure response. The transient pore pressure in the seabed does not respond immediately to the wave-induced pressure stress on the seabed surface, which is caused by the change in soil permeability.
A concept model of silt soil pore pressure response under different wave actions was developed. The accumulation rate of pore pressure is less than the dissipation rate, and the oscillation pore pressure response without accumulation is highlighted in the model. The highlighted response process is of considerable importance for transient liquefaction and the initiation of the pore pressure response.
Acknowledgements
This work was sponsored by the National Special Project for Marine Public Welfare Industry (No. 201005005), the National Natural Science Foundation of China (Nos. 42107207, 41876066), the Natural Science Foundation of Shandong Province (No. ZR2020QD067), and the Post- doctoral Innovation Project of Shandong Province (No. 20 2002042).
Bennett, R. H., 1977. Pore-water pressure measurements: Mississippi Delta submarine sediments., 2 (1): 177-189.
Chen, Z. C., 2013. Centrifugal modeling test on wave-induced dynamic response of seabed. Master thesis. Dalian University of Technology.
Jeng, D. S., 1997. Soil response in cross-anisotropic seabed due to standing waves., 123 (1): 9-19.
Jeng, D. S., 2012.. Shanghai Jiao Tong University Press and Springer-Verlage, Shanghai, 289pp.
Jeng, D. S., and Seymour, B. R., 2007. Simplified analytical approximation for pore-water pressure buildup in marine sediments., 133 (4): 309-312.
Jia, Y. G., Liu, X. L., Zhang, S. T., Shan, H. X., and Zheng, J. W., 2020.. Springer Oceanography, Springer, Singapore, 292pp.
Li, A. L., Li, G. X., Lin, L., and Xu, G. H., 2012. Experimental study on pore pressure responses to wave action on silt seabed., 31 (1): 15-20 (in Chinese with English abstract).
Liu, T., Feng, X. L., and Lin, L., 2006. Study of seabed pore water pressure based ontest and numerical simulation.
, 28 (3): 173-176 (in Chinese with English abstract).
Nago, H., Maeno, S., Matsumoto, T., and Haehiman, Y., 1993. Li- quefaction and densification of loose deposited sand bed underwater pressure variation.. Singapore, 578-584.
Okusa, S., and Uchida, A., 1980. Pore-water pressure change in submarine sediments due to waves., 4 (2): 145-161.
Putman, J. A., 1949. Loss of wave energy due to percolation in apermeable sea bottom.,30 (3): 349-356.
Qi, W. G., and Gao, F. P., 2018. Wave induced instantaneously-li- quefied soil depth in a non-cohesive seabed.,153: 412-423.
Sassa, K., He, B., Miyagi, T., Strasser, M., Konagai, K., Ostric, M.,., 2012. A hypothesis of the Senoumi submarine me- gaslide in Suruga Bay in Japan–based on the undrained dyna- mic-loading ring shear tests and computer simulation., 9: 439-455.
Seed, H. B., and Rahman, M. S., 1978. Wave-induced pore pressure in relation to ocean floor stability of cohesionless soils., 3 (2): 123-150.
Sleath, J. F. A., 1970. Wave-induced pressures in beds of sand., 96 (2): 367-378.
Sumer, B. M., and Cheng, N. S., 1999. A random-walk model for pore pressure accumulation in marine soils.. Brest, 521-526.
Sumer, B. M., and Fredsøe, J., 2002.. World Scientific Publishing, Singa- pore, 552pp.
Sumer, B. M., Hatipoglu, F., and Fredsøe, J., 2006. The sequenceof sediment behaviour during wave-induced liquefaction., 53 (3): 611-629.
Wang, H., and Liu, H. J., 2016. Evaluation of storm wave-induced silty seabed instability and geo-hazards: A case study in the Yellow River Delta., 58: 135-145.
Wang, Y. F., Gao, F. P., and Qi, W. G., 2014. Cyclic pore pressure generation in silty soils under the action of combined waves and current., 45 (4): 40-45.
Wang, Z. H., Jia, Y. G., Liu, X. L., Wang, D., Shan, H. X., Guo, L.,., 2017.observation of storm-wave-induced seabed deformation with a submarine landslide monitoring system., 77: 1091- 1102.
Wang, Z. H., Sun, Y. F., Jia, Y. G., Shan, Z. G., Shan, H. X., Zhang, S. T.,., 2020. Wave-induced seafloor instabilities in the subaqueous Yellow River Delta–initiation and process of sediment failure., 17: 1849-1862.
Wu, B., and Sun, D. A., 2013. Study of liquefaction characteristics of unsaturated silt., 34 (2): 411- 416.
Yamamoto, T., Koning, H. L., and Sellmejjer, H., 1978. On the response of a poro-elastic bed to water waves., 87 (1): 193-206.
Zhang, X. L., Wang, Z. H., and Xu, Z. W., 2016. Shaking table tests on flow effects of liquefied sands., 37 (8): 2347-2352.
November 18, 2020;
November 29, 2021;
May 26, 2022
© Ocean University of China, Science Press and Springer-Verlag GmbH Germany 2022
. E-mail: wzh-ouc@foxmail.com
(Edited by Chen Wenwen)
杂志排行
Journal of Ocean University of China的其它文章
- Variations in Dissolved Oxygen Induced by a Tropical Storm Within an Anticyclone in the Northern South China Sea
- Intensity of Level Ice Simulated with the CICE Model for Oil-Gas Exploitation in the Southern Kara Sea, Arctic
- Learning the Spatiotemporal Evolution Law of Wave Field Based on Convolutional Neural Network
- Development and Control Strategy of Subsea All-Electric Actuators
- Acoustic Prediction and Risk Evaluation of Shallow Gas in Deep-Water Areas
- Composition, Source and Environmental Indication of Clay Minerals in Sediments from Mud Deposits in he Southern Weihai Offshore,Northwestern Shelf of the South Yellow Sea, China
