Transient analysis and optimization of passive residual heat removal heat exchanger in advanced nuclear power plant
2022-09-16YanBinLiuXiangYuMengXueShengWangQiMingMenYuYangYuanJiaMingCao
Yan-Bin Liu· Xiang-Yu Meng · Xue-Sheng Wang · Qi-Ming Men ·Yu-Yang Yuan · Jia-Ming Cao
Abstract The transient performance and optimization of a passive residual heat removal heat exchanger (PRHR HX)were investigated. First, a calculation method was developed for predicting the heat transfer of the PRHR HX.The calculation results were validated through comparisons with ROSA experimental data. The heat-transfer performance of the AP1000 PRHR HX in the initial period was predicted,and it satisfied the design requirements.Second,the distributions of the heat flux, tube-inside/outside heattransfer coefficients, and heat load for the AP1000 PRHR HX over 2000 s were examined. Third, an optimization study was conducted by adjusting the horizontal length and tube diameter. Their effects on the four main heat-transfer parameters and the heat-transfer area were analyzed. Furthermore, the influence of the initial in-containment refueling water storage tank (IRWST) temperature was investigated using an established simulation procedure.The results indicated that it significantly affected the trends of the IRWST temperature and reactor outlet temperature.Finally, the minimum required flow rates over time to maintain the reactor outlet temperature at the safety line were determined for different start-up times. The trends of the minimum required flow rate and the peak flow rate were analyzed.
Keywords Heat transfer·PRHR HX·Transient analysis·Optimization investigation
1 Introduction
Passive safety systems for nuclear power plants (NPPs)have received increasing attention—particularly after the Fukushima nuclear accident, which has significantly influenced the development policies of nuclear power in different countries. Reactors have increasingly adopted various passive safety systems to reduce the probability of accidents, such as AP1000 [1], CAP1400 [2], CPR1000[3], HPR1000 [4], and the molten salt reactor [5]. The passive core cooling system (PXS) is one of the passive safety systems designed in AP1000 and CAP1400 to remove the decay heat of fuel in the case of meltdown.The PXS provides core residual-h at removal, safe injection,and depressurization. The in-containment refueling water storage tank (IRWST) is an important facility located directly above the reactor coolant system loops that provides long-term safe water injection by exploiting gravity.In addition, the IRWST can provide a heat sink for a passive residual heat removal heat exchanger(PRHR HX),which is submerged in the IRWST. After the PRHR HX starts operating, the core decay heat is transferred to the IRWST water. Once the IRWST water begins boiling, the steam rises and condenses, and the water is drained back into the IRWST [1, 2].
Once a trigger signal is received during a reactor shutdown accident,the PRHR HX starts working to remove the residual heat through natural circulation. The transient heat-transfer characteristics outside the irregular C-tube bundle of the PRHR HX submerged in the IRWST exhibit complex changes among the three heat-transfer mechanisms of natural convection, subcooled boiling, and saturation boiling with time. The transient heat-transfer performance of the PRHR HX affects the reactor safety.Therefore, several experimental facilities have been constructed to investigate the transient characteristics of the PRHR HX.ROSA[6]in Japan,APEX [7]at Oregon State University, SPES-2 [8] in Italy, and ACME [9] in China are four representative experimental facilities for performing component tests and integral system tests. However, not all the test data were released. Among these experiments,the published materials on the PRHR HX and IRWST were the most detailed for the ROSA test [10].Therefore, ROSA test data were selected for comparison and validation in this study.
The transient performance of the PRHR HX and that of the circulation loop critically affect the system safety. The transient performance of the PRHR HX under the design and operation conditions requires an in-depth analysis. To investigate the transient characteristics of the PRHR HX,experimental methods have been utilized in recent years,and scaled down setups have been established [2, 11].However, experimental studies have high costs; thus, various codes have been developed to perform simulations under different working conditions or assumed accidents for different reactors [12–15]. Different types of codes have been reported in the literature, such as the one-dimensional system analysis code [16] and multi-physics coupling code [15]. In addition, the CFD method has been adopted in several investigations to simulate the complex fluid flow and heat-transfer characteristics of the PRHR HX[17, 18]. The one-dimensional system analysis code can quickly calculate the required parameters and has long been employed in nuclear engineering. In this study, we applied a one-dimensional system analysis method to investigate the transient performance and optimization of a PRHR HX.
The heat loads of different sections of the C-tube bundle exhibited significant differences under transient conditions[19]. Therefore, it may be possible to improve the heattransfer performance of the PRHR HX by optimizing the length ratios of the horizontal and vertical sections of the C-tube bundle. Additionally, the transient performance of the PRHR HX may be improved with optimization of the tube diameter.The establishment of a simplified circulation loop between the reactor and the PRHR HX is essential for analyzing the safety of the passive residual heat removal system(PRHRS).Previous studies indicated that the initial cooling water temperature of the IRWST influences the tube outlet temperature and has obvious effects on the heattransfer performance of the PRHR HX [20, 21]. In addition, the required flow rate inside the tube for keeping the reactor under the safety temperature line must be investigated to provide support for the operation boundary and safety of the reactor.
This study focuses on the transient performance and optimization of the PRHR HX in AP-series NPPs. Section 2 introduces the calculation models for the different heat-transfer mechanisms inside and outside the C-tubes.Section 3 describes the calculation procedure, including the unit division and iterative calculation. In Sect. 4, the accuracy of the developed calculation method is verified by comparing the results with ROSA experimental data. In Sect. 5,the heat-transfer characteristics in the initial period and the variation trends over 2000s for the AP1000 PRHR HX are predicted.In Sect. 6,optimization is performed by adjusting the horizontal lengths and tube diameters, and their effects on the main heat-transfer parameters and heattransfer area are examined. Section 7 presents the simulation procedure for the circulation loop to investigate the effect of the IRWST initial temperature on reactor operation. The tendencies of the minimum required flow rates and fitted curve of the peak flow rate were obtained.Conclusions are presented in Sect. 8. This work provides important design and optimization support for the PRHR HXs in AP-series NPPs.
2 Calculation model
2.1 Heat-transfer calculation model for inside of tube
The Dittus–Boelter correlation [22] was used for the calculation of the single-phase convection heat transfer inside the tube.

The tube-inside fluid Reynolds number is calculated as follows:

The tube-inside fluid Prandtl number is calculated as follows:

In these equations, the symbols are defined as follows:hA—heat-transfer coefficient of tube-inside fluid, W/(m2·K); W—total mass flow rate of tube-inside fluid, kg/s;kA—thermal conductivity of tube-inside fluid, W/(m·K); ReA—Reynolds number of tube-inside fluid; PrA—Prandtl number of tube-inside fluid; d1—tube inner diameter m;uA—velocity of tube-inside fluid,m/s;ρA—density of tube-inside fluid,kg/m3;μA—dynamic viscosity of tubeinside fluid,Pa·s;cpA—specific heat of tube-inside fluid,J/(kg·K); n—number of heat-transfer tubes.
2.2 Tube-outside heat-transfer calculation model
2.2.1 Single-phase natural convection
The McAdams correlation [23] was used in this study.For a horizontal tube,

For a vertical tube,

Here, the symbols are defined as follows: NuB—Nusselt number of tube-outside fluid; GrB—Grashof number of tube-outside fluid; PrB—Prandtl number of tube-outside fluid; g—local gravitational acceleration, m/s2; βB—tubeoutside fluid volume expansion coefficient, 1/K; l—tube length for a vertical tube or tube outer diameter for a horizontal tube,m;Tw—temperature of tube outer wall,K;TB—temperature of tube-outside fluid, K; υB: Kinematic viscosity of tube-outside fluid, m2/s; μB—dynamic viscosity of tube-outside fluid, Pa·s; cpB—specific heat of tube-outside fluid, J/(kg·K); kB—thermal conductivity of tube-outside fluid,W/(m·K);The qualitative temperature is(Tw+TB)/2 here.
2.2.2 Subcooled pool boiling
The Bergles–Rohsenow correlation [24] was used to predict the tube outer wall onset of nucleate boiling(ONB)temperature, as follows:
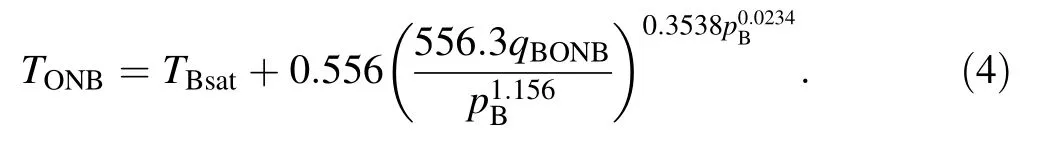
Here, the symbols are defined as follows: TONB—ONB temperature of tube outer wall, K; TBsat—saturation temperature of tube-outside fluid, K; qBONB—corresponding heat flux at ONB point, W/m2; pB—tube-outside fluid pressure, Pa.
It has been reported [22] that when Tw<TONB, boiling does not occur. NuBcan be calculated using Eqs. (2) and(3).
For Tw≥TONBand TB<TBsat, the Rohsenow correlation [24] was used to calculate the subcooled pool boiling heat transfer.

Equation (9) is used to calculate hBnfor both vertical and horizontal tubes.
2.2.3 Saturated pool boiling

3 Calculation procedure
3.1 Calculation method for a certain moment
Several units were separated from the tube inlet. Figure 1 illustrates the unit division method. The inlet temperature of the tube was set as the initial dry condition.Prior to the calculations, the following assumptions were made.
1. The PRHR HX functions only under accident conditions in which the fouling resistance is negligible.
2. The central tube of the PRHR HX was adopted for the heat-transfer analysis.
3. The temperature difference of the IRWST water in the same horizontal plane was ignored.
3.2 Calculation procedure
Figure 2 shows the calculation model for unit i. The following iterative method was adopted for the calculations.
(1) Assume a value for TA(i)′, i.e., the qualitative temperature of unit i.
(2) Calculate the temperature of the tube-outside wall Tw(i)of unit i using the heat balance equations.

Fig. 1 Unit division method

Fig. 2 Calculation model for unit i

By solving Eqs. (10)and(11),Tw(i)can be expressed as
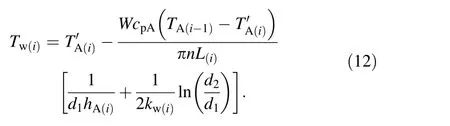
Here, the symbols are defined as follows: Q(i)—heat-transfer capacity of unit i, W; L(i)—calculated tube length of unit i, m; TA(i)—qualitative temperature of unit i, K; Tw(i)—tube outer wall temperature of unit i, K; hA(i)—tube-inside fluid heat-transfer coefficient of unit i, W/(m2·K); kw(i)—tube thermal conductivity of unit i,W/(m·K);TA(i-1)—qualitative temperature of unit i - 1, K.
(3) Compare Tw(i), TB(i), and TBsat, and then use the corresponding equation to calculate the tube-outside fluid heat-transfer coefficient of unit i, i.e., hB(i).
(4) Calculate the qualitative temperature of unit i, i.e.,, using the following equations.


Figure 3 shows a diagram of the iterative calculation procedure,which started from the unit adjacent to the inlet and ended at the unit next to the outlet. The iterative calculation procedure was performed for each unit. Through the iterative calculation, important parameters were obtained, including TA(i), Tw(i), hA(i), and hB(i).
4 Validation of calculation method
The calculation results were compared with the experimental results of the ROSA test facility [10] to verify the applicability and accuracy of the proposed method. The temperature distributions at different times during the operation of the PRHR HX were examined. The computational model of the C-tube used in the calculations was identical to the central tube of the tube bundle in the ROSA experimental facility. Additionally, the boundary conditions used in the calculation process,such as the mass flow rate,IRWST temperature,and tube inlet temperature,were set according to the ROSA experimental data. Table 1 presents the parameters of an AP600 PRHR HX. The related physical parameters of water under different conditions were acquired from IAPWS-IF97 [25]. The accuracy of the proposed iterative calculation method was verified by comparing the results with the ROSA data.The length of the central tube was set as the approximate average value for all PRHR HX C-tubes in AP600. The number of tubes used in the calculation did not include an 8%design margin.Four unit sizes(lengths of 300,100,30,and 10 mm) were used to check the mesh independence,and the outlet temperature(400 s)for each unit length was calculated.The results are shown in Fig. 4.The unit length of 10 mm was selected for the calculations presented in the following sections.
The comparison results for 400, 1500, and 3000 s are shown in Fig. 5a–c. In these figures, the X coordinate indicates the normalized length, and the Y coordinate indicates the temperature. In the legend, ‘‘IRWST’’ refers to the water temperature,‘‘ROSA center tube’’and‘‘ROSA outer tube’’ refer to the ROSA experimental data, and‘‘Calculated value’’ refers to the results obtained via the proposed iterative calculation method.
In the ROSA IRWST,the water level was approximately 8.0 m. The local pressure increased with the water depth,and the saturation temperature of the water also changed with respect to the water depth. In the following comparison, the saturation temperature influenced by the water depth in the IRWST was considered.
The comparison results indicated that the calculated values at the three times were slightly higher than the ROSA experimental data. For the results calculated under the two conditions where the influence of water depth on the saturation temperature was considered and ignored,the maximum error was 0.77%. In the following analysis, the effect of the water depth was ignored. Furthermore, the maximum error between the ROSA experimental and calculated temperatures was 7.4% and occurred at 400 s.Considering that there are several influencing factors,such as errors in the predicted correlations and errors in the ROSA data, the proposed iterative calculation method is acceptable and applicable.
The heat-transfer rates (single tube) were compared to assess the proposed calculation method, as shown in Fig. 5d. The heat-transfer rate of a single tube was underestimated by ~7%. The maximum error between the two calculation methods (Ref. [10]and this study)was approximately 2%. The proposed method is acceptable for the transient performance analysis and optimization of the PRHR HX. Importantly, the model tube in Ref. 10 consisted of 25 cells (5 cells used for modeling the upper horizontal section, 5 for the lower horizontal section, and 15 for the vertical section), and it was unclear for which cell each Nu number (in Ref. 10, Figs. 10, 11) was calculated.Furthermore,the Nu number changes along the axial direction of the tube—particularly in the vertical section.Therefore,it was difficult to compare the Nu numbers in the ROSA experiment with the calculation results of the proposed method. However, a rough comparison was conducted, and the average Nu numbers of the vertical section and lower horizontal section calculated via the proposed method were on the same order of magnitude as the ROSA experimental data. For the upper horizontal section, the data points (in Ref. [10] and Fig. 13) were highly scattered, and the corresponding relationship with each cell was not clearly identified.The predicted heat flux and ROSA experimental results were on the same order of magnitude and exhibited a reasonable trend.
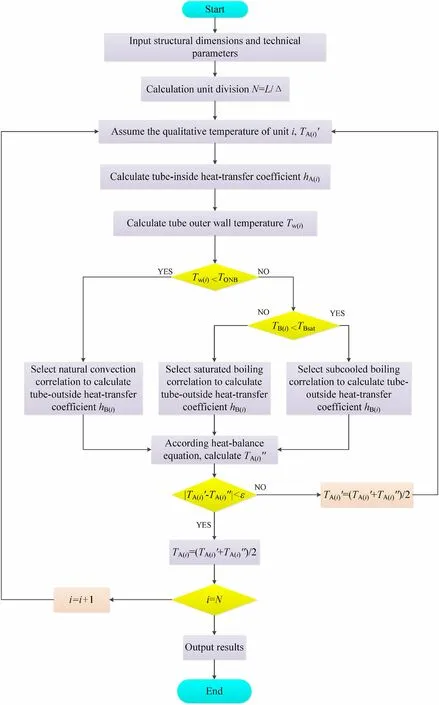
Fig. 3 Iterative calculation diagram

Table 1 General parameters of the AP600 PRHR HX
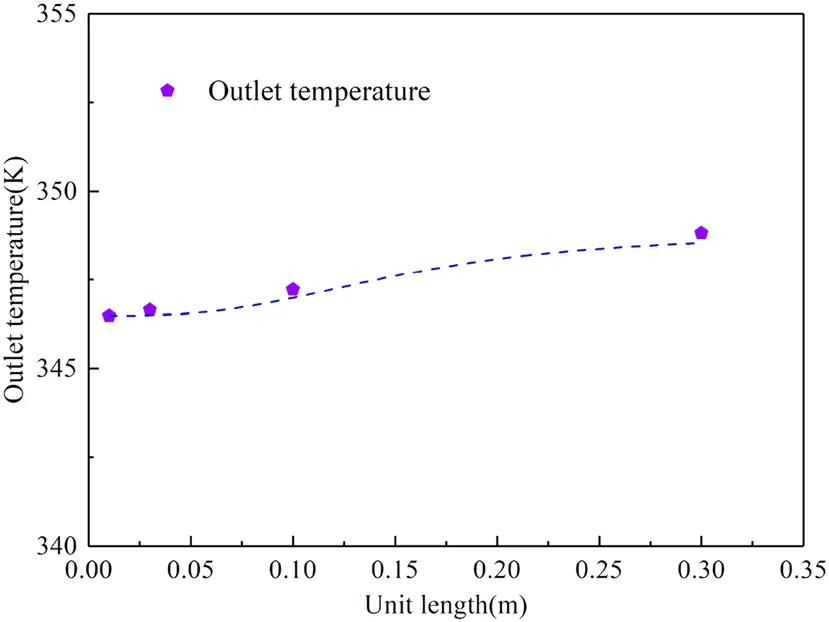
Fig. 4 Mesh independence analysis
5 Heat-transfer performance of AP1000 PRHR HX
5.1 AP1000 PRHR HX
Table 2 presents the general parameters of the AP1000 PRHR HX. In the calculation process, the length of the central tube was set as the approximate average value for all PRHR HX C-tubes. The number of tubes used in the calculation did not include an 8% design margin.
Figure 6a presents the inside fluid temperature, outer wall temperature, and IRWST temperature distributions of the AP1000 PRHR HX. The X-coordinate indicates the normalized length, and the Y-coordinate indicates the temperature. The tube-inside fluid temperature decreased significantly along the flow direction.The inlet temperature was 570.4 K and finally reached 366.7 K. The wall temperature decreased slowly;the initial wall temperature was 389.5 K,and the wall temperature decreased to 353.2 K at the outlet. The IRWST temperature remained at 322.2 K.
Figure 6b presents the tube-inside and tube-outside heat-transfer coefficient distributions of the AP1000 PRHR HX.The X-coordinate indicates the normalized length,and the Y-coordinate indicates the heat-transfer coefficient.With an increase in the normalized length, the tube-inside heat-transfer coefficient decreased slowly, and it remained between 7522.2 and 4408.9 W/(m2·K). The tube-outside heat-transfer coefficient decreased rapidly before the normalized length reached 0.52, and then it decreased slowly with an increase in the normalized length from the tube inlet. The tube-outside heat-transfer coefficient decreased from 9280.2 to 1024.6 W/(m2·K). The tube-outside heattransfer coefficient within the normalized length range of 0–0.52 exceeded that within the normalized length range of 0.52–1.0, owing to the differences in the heat-transfer mechanism and calculation correlation. Within the normalized length range of 0–0.52, the heat-transfer mechanism was subcooled boiling.
Figure 6c presents the heat flux distribution of the AP1000 PRHR HX. The X-coordinate indicates the normalized length, and the Y-coordinate indicates the heat flux. The calculated heat flux was in the range of 624,073.2–31,895.6 W/m2.The heat flux decreased rapidly within the normalized length range of 0–0.52 and then decreased slowly with an increase in the normalized length from the tube inlet, indicating that the heat-transfer capacity of the PRHR HX changed significantly along the flow direction.
Table 3 presents the calculation results. The calculated tube outlet temperature was 366.7 K, and the calculated heat load was 61.4 MW, which satisfied the design requirements.
The proposed calculation method was used to predict the heat-transfer performance of the AP1000 PRHR HX in the initial period. The change trends of the tube-inside fluid temperature, tube outer wall temperature, IRWST temperature, tube-inside heat-transfer coefficient, tube-outside heat-transfer coefficient, and heat flux with respect to the normalized length were obtained. Furthermore, the calculated tube outlet temperature and heat load satisfied the design requirements.
5.2 Prediction of heat-transfer performance over time
Hot test data [26] were used in this study. The inlet temperature, inlet flow rate, and average IRWST test temperature were used to calculate the outlet temperature,tube-inside and tube-outside heat-transfer coefficients, and heat flux.
We loved each other so tenderly, and our tastes and interests were so much alike that we determined never to marry, but to spend our entire lives together
The inlet temperature, inlet flow rate, and average IRWST test temperature change over time, and the fitted curves are expressed as follows:

Fig. 5 (Color online) Comparison of calculated values with ROSA data

Table 2 General parameters of the AP1000 PRHR HX
(1) Inlet temperature (K)

(2) Inlet flow rate (kg/s)

(3) Average IRWST (K)

The change tendencies of the main parameters were obtained according to the above boundaries and the calculation method presented in Fig. 3. Figure 7a shows the changing tendencies of the inlet, outlet, and IRWST temperatures over 2000 s. The outlet temperature was calculated under the corresponding inlet temperature and IRWST temperature boundaries at each moment. It gradually decreased and became stable. Figure 7b shows the changes in the heat flux at different moments.Figure 7c,d shows the changing tendencies of the tube-inside and tubeoutside heat-transfer coefficients at different moments.Over time, the three heat-transfer parameters decreased continuously. With an increase in the normalized length from the tube inlet,significant reductions were observed.In addition, the difference between the maximum and minimum values at a particular moment in Fig. 7b–d decreases continuously.

Fig. 6 (Color online) Heat-transfer performance of the AP1000 PRHR HX at the initial moment

Table 3 Calculation results
To visualize the heat load distribution, three heattransfer sections were considered: upper and lower horizontal sections and a vertical section. Figure 8a shows the division of the heat-transfer sections of the PRHR HX.Figure 8b shows the changing tendencies of the heat load in the three sections over 2000s. The total heat load exhibited a downtrend, as expected. Among the three sections, the upper horizontal section had the largest heat load, and the lower horizontal section undertook the smallest heat load.
6 Optimization investigation
In the foregoing analysis,the upper horizontal section of the PRHR HX had the largest heat load.It may be possible to increase the capacity of the heat exchanger by adjusting its horizontal and vertical tube lengths.
6.1 Performance with different horizontal and vertical tube lengths
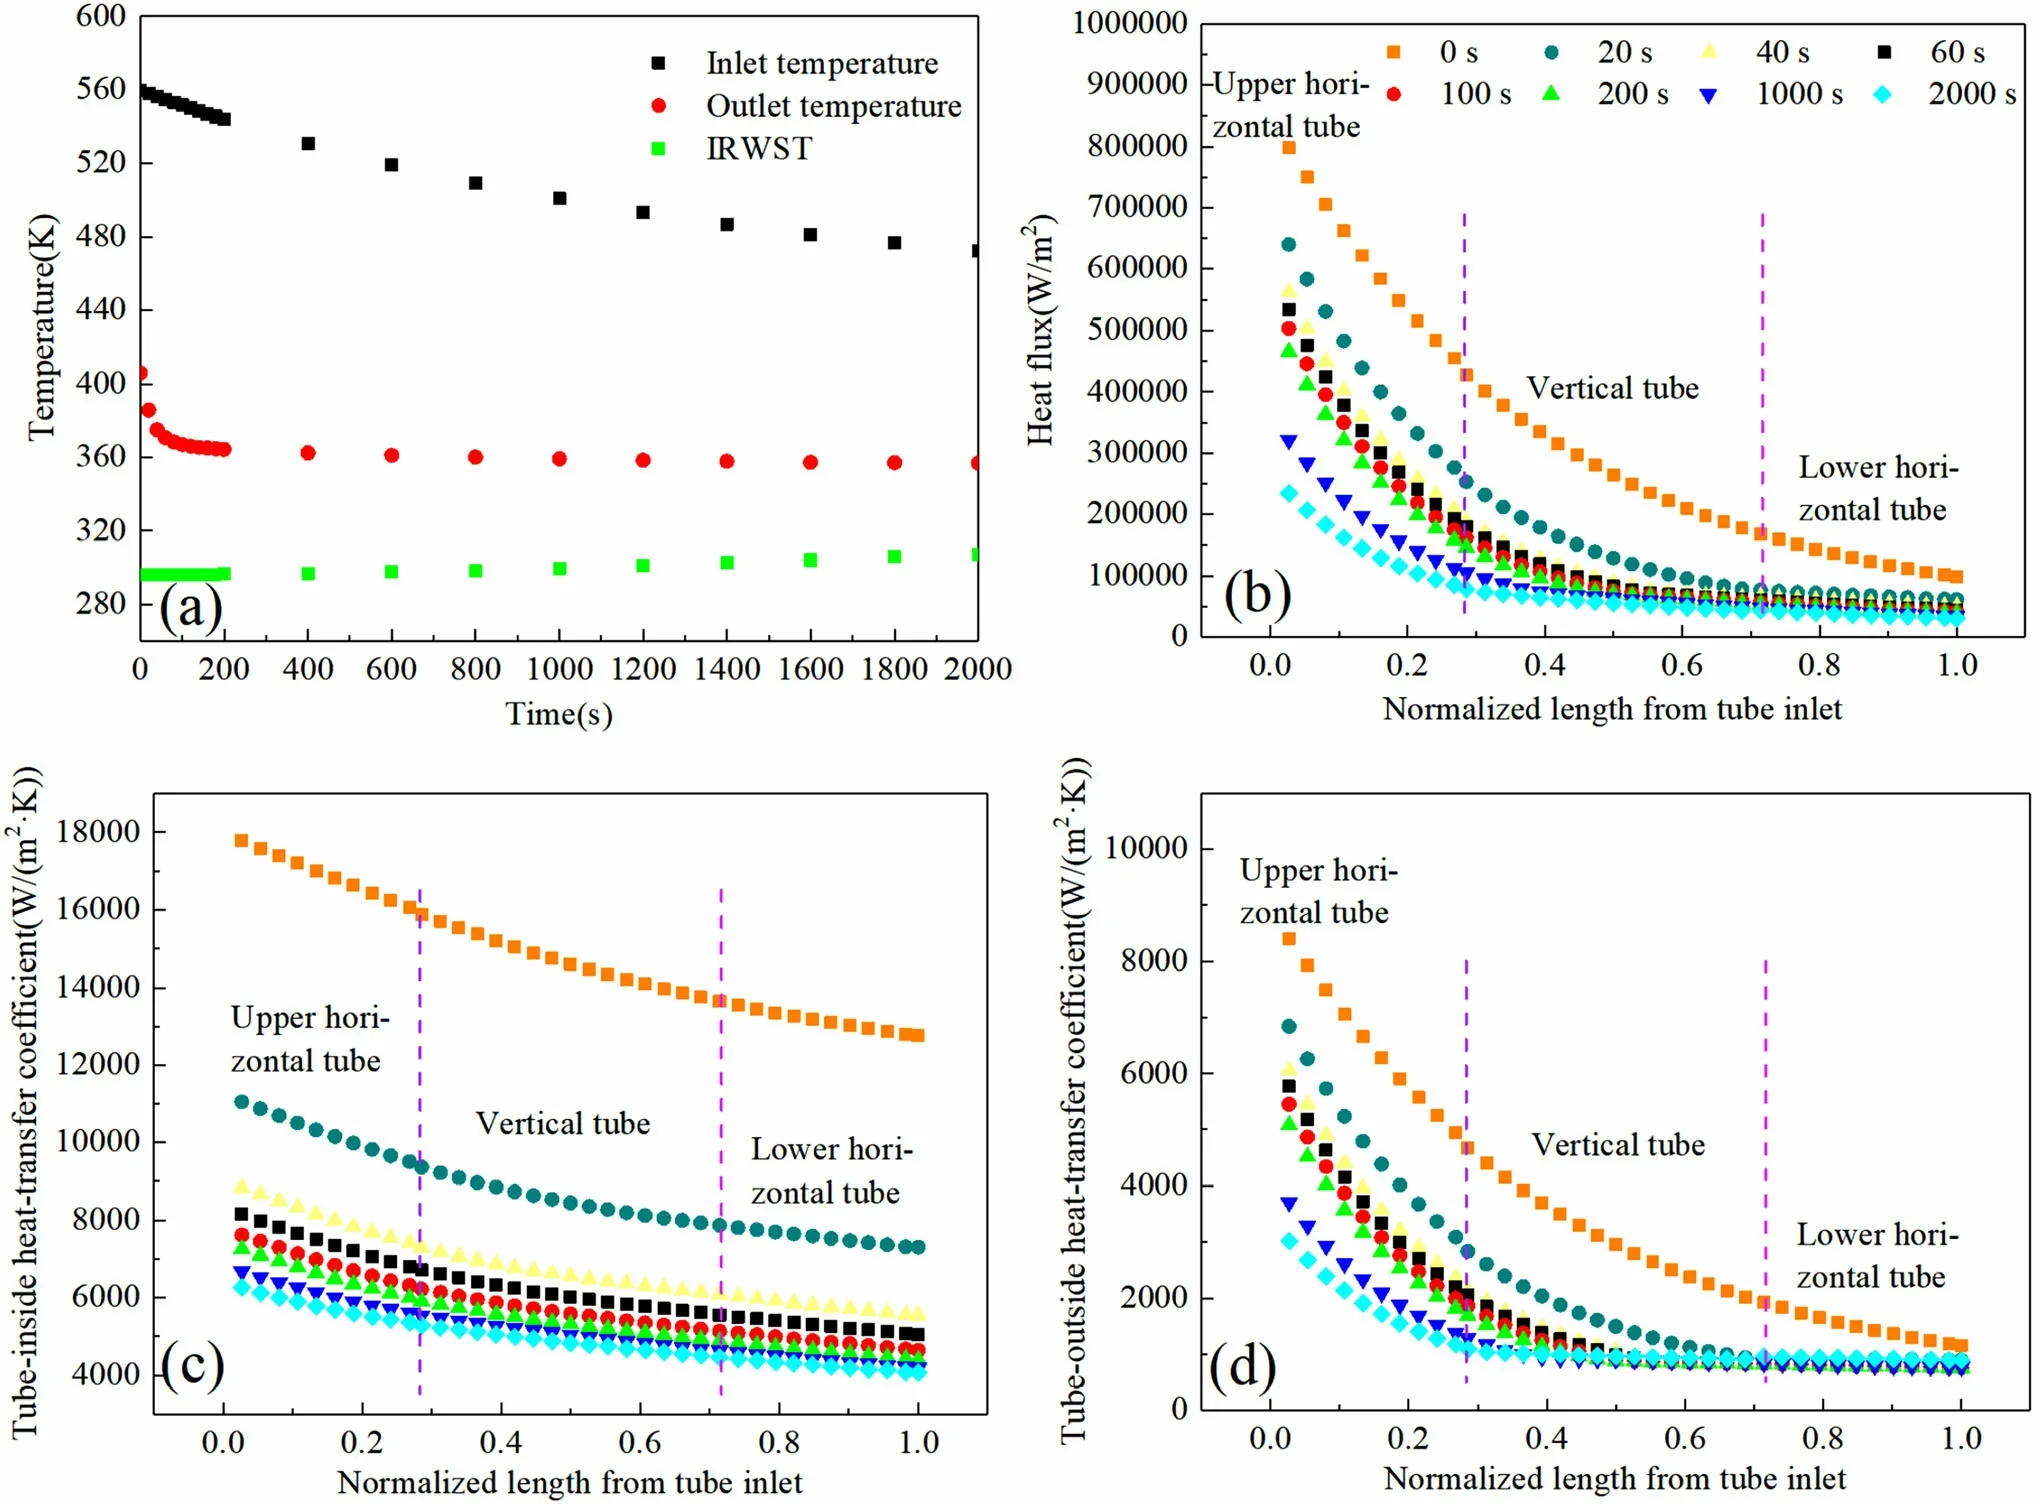
Fig. 7 (Color online) Changing tendencies of the AP1000 PRHR HX heat-transfer performance

Fig. 8 (Color online) Heattransfer section division and changing tendencies of the heat load of the PRHR HX
To investigate the PRHR HX heat-transfer performance with different horizontal and vertical tube lengths,the main heat-transfer parameters were analyzed under different conditions. The heat-transfer tube diameter was set as 19.1 mm, and the horizontal lengths were set as 1000,2000,3000,and 4000 mm.In the analysis,the vertical tube length was adjusted to keep the total heat load constant(design value) under each condition.

Fig. 9 (Color online) Changing tendencies of heat-transfer parameters with an increase in the normalized length from the tube inlet with four horizontal section lengths
Figure 9a–c presents the changing tendencies of the heat flux and tube-inside/outside heat-transfer coefficient with four horizontal section lengths. As shown, there were no significant differences in the calculated heat flux or heattransfer coefficient among the different lengths. Figure 9d shows the heat loads in the three sections and the total heat load with the four horizontal section lengths. With an increase in the horizontal section length, the heat loads of the upper/lower horizontal sections continuously increased,with the former increasing faster.However,the heat load in the vertical section decreased sharply. The results indicate that the horizontal section length of the PRHR HX had negligible effects on the distributions of the heat flux and heat-transfer coefficient along the tube but significantly affected the heat load distribution of the three heat-transfer sections.
6.2 Performance with different tube diameters
In general, the specifications (such as the diameter) of the heat-transfer tube significantly affect the heat-transfer performance. In this study, three types of tubes with different outer diameters(14.0,19.1,and 25.0 mm)were used to investigate the heat-transfer performance. The length of the horizontal section was kept constant (3000 mm).
Figure 10a–c shows the changing tendencies of the heat flux and tube-inside/outside heat-transfer coefficients with different tube outer diameters. All the parameters decreased with an increase in the diameter, and the heat flux curves were similar. However, the tube-inside/outside heat-transfer coefficient curves exhibited obvious differences.The tube-inside heat-transfer coefficient of the 14.0-mm-diameter tube significantly exceeded those of the other two tubes. The tube-outside heat-transfer coefficient of the 14.0-mm-diameter tube was initially the largest but was eventually equal to those of the other tubes. Figure 10d shows the changing tendencies of the heat loads in the three sections with the different tube outer diameters.Within the same section, the heat loads exhibited small differences.For a given tube diameter,the heat load distribution of the three heat-transfer sections exhibited a trend similar to that shown in Fig. 9d.From the tube inlet to the outlet,the heat loads of the three sections decreased continuously.

Fig. 10 (Color online) Changing tendencies of heat-transfer parameters with an increase in the normalized length from the tube inlet with different tube outer diameters
6.3 Comparison of required heat-transfer areas
Under the design heat load, the initial IRWST temperature was 322.15 K. The heat-transfer areas with the three tube outer diameters (14.0, 19.1, and 25.0 mm) were determined, as shown in Fig. 11. With a reduction in the tube diameter, the required heat-transfer area decreased.The main reason for this is that a reduction in the tube diameter does not cause a wide change of heat fluxes.However, the tube-inside/outside heat-transfer coefficients differed significantly among the three types of tubes. For the same tube, there were no obvious changes in the required heat-transfer area with different horizontal section lengths. This is easily explained by Fig. 9a–c: with different horizontal section lengths, the heat flux and heattransfer coefficient did not change significantly with an increase in the normalized length from the tube inlet.
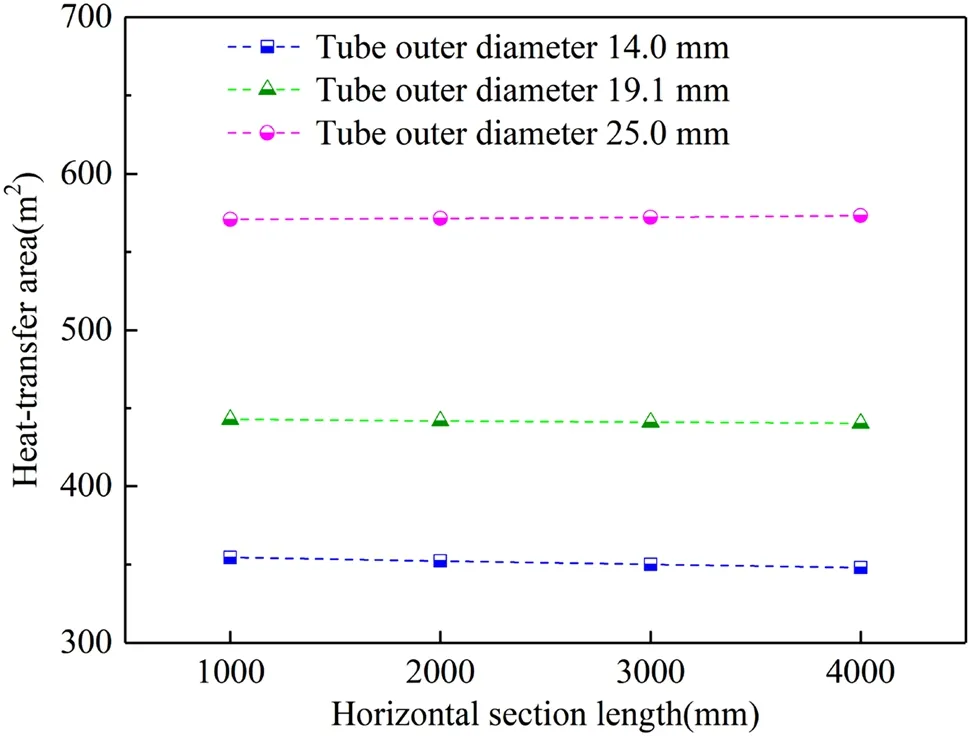
Fig. 11 Changing tendencies of the heat-transfer area with different tube outer diameters
7 Effects of operating conditions
7.1 Effect of initial IRWST temperature
To analyze the influence of the initial IRWST temperature on minimum required flow rate, a heat-transfer calculation procedure was established for the circulation loop between the reactor and PRHR HX in the IRWST. Figure 12 shows the heat-transfer process diagram for the circulation loop.
The heat-transfer calculation procedure for the circulation loop was as follows:
1. The coolant in the primary loop flowed into the PRHR HX inlet at a design temperature of 570.15 K,transferred the residual heat to the water in the IRWST through the C-tube bundle, and was then recycled to the reactor.
2. In the reactor,the coolant absorbed residual heat,and it was assumed that all the residual heat was absorbed by the coolant.
3. The heated coolant brought the residual heat out of the reactor and entered the PRHR HX inlet through the connecting line (considering that there were insulation layers outside the pipeline, the heat loss was ignored).It then transferred the heat to the IRWST water again.
4. The primary coolant flowed into the reactor again and absorbed residual heat. The cycle continued until the coolant satisfied the safety requirements.
Initially, the residual heat was high and could not be transferred by the PRHR HX in time;therefore,the primary coolant temperature of the reactor outlet increased.As time progressed, the residual heat continuously decreased and could be removed immediately. The reactor outlet temperature decreased over time. Meanwhile, the water temperature in the IRWST increased, resulting in saturated boiling of the water.
If there is no major interruption before the reactor shutdown, the residual decay power after the shutdown of the NPP can be modeled by the following equation [27]:

Fig. 12 (Color online) Heat-transfer process diagram for the circulation loop

Here,the symbols are defined as follows:Qres—residual decay power, MW; Q0—power of reactor under normal operation before shutdown, MW; t—time since reactor shutdown, s.
For AP1000, the designed thermal power is 3400 MWt;therefore, in Eq. (19), Q0is 3400 MWt, t is assumed to be 120 s [28], and the residual decay power is described by the curve in Fig. 13.
To be practical and conservative, the flow rate was calculated using Eq. (17), and the initial PRHR HX inlet temperature was set as 570.15 K. According to the heattransfer calculation procedure for the circulation loop, the changing tendencies of the PRHR HX inlet, outlet, and IRWST temperatures were obtained under different initial IRWST temperatures. The main parameters used in the calculations are presented in Table 4.
Figure 14a–d shows the changing tendencies of the PRHR HX inlet and outlet temperatures and the IRWST temperature under four different initial IRWST temperatures. Table 5 presents the calculation results. When the initial IRWST temperature increased from 278.15 to 322.15 K,the time required for the IRWST temperature to reach the saturation temperature decreased from 23,710 to 10,740 s.
7.2 Effect of start-up time
As shown in Fig. 14a–d, the PRHR HX inlet temperature first increased and then decreased. A peak was observed in the temperature curve.During the residual heat removal process, the maximum reactor outlet temperature must be maintained below the design temperature(616.15 K) of the reactor vessel to avoid damage to the vessel body and other accidents. Therefore, after the reactor is shut down,the flow rate in the primary loop must control the highest temperature. According to Eq. (19),after the control rod drops, the influence of the PRHR HX start-up time on minimum required flow rate must be considered.

Fig. 13 Residual decay power curve

Table 4 Main parameters used in the calculation process

Fig. 14 Changing tendencies of the PRHR HX inlet and outlet temperatures and the IRWST temperature under four different initial IRWST temperatures

Table 5 Calculation results
Simulations were conducted with six different start-up times to investigate the tendencies of the minimum required flow rate. The reactor outlet temperature was maintained at the vessel design temperature of 616.15 K during the simulation. Figure 15a shows the changing tendencies of the required primary coolant flow rate for the different start-up times. In each curve, the flow rate first increased to its highest value and then continuously decreased. Earlier start-up corresponded to a higher peak flow rate.Figure 15b shows the changing tendencies of the peak flow rate for the different start-up times. The peak flow rate approximately followed an exponential distribution Fmax=atb, and through the nonlinear fitting method with the Origin software, the coefficients a and b were determined to be 176.86333 and - 0.17189, respectively.The maximum fitting deviation was 0.83%.
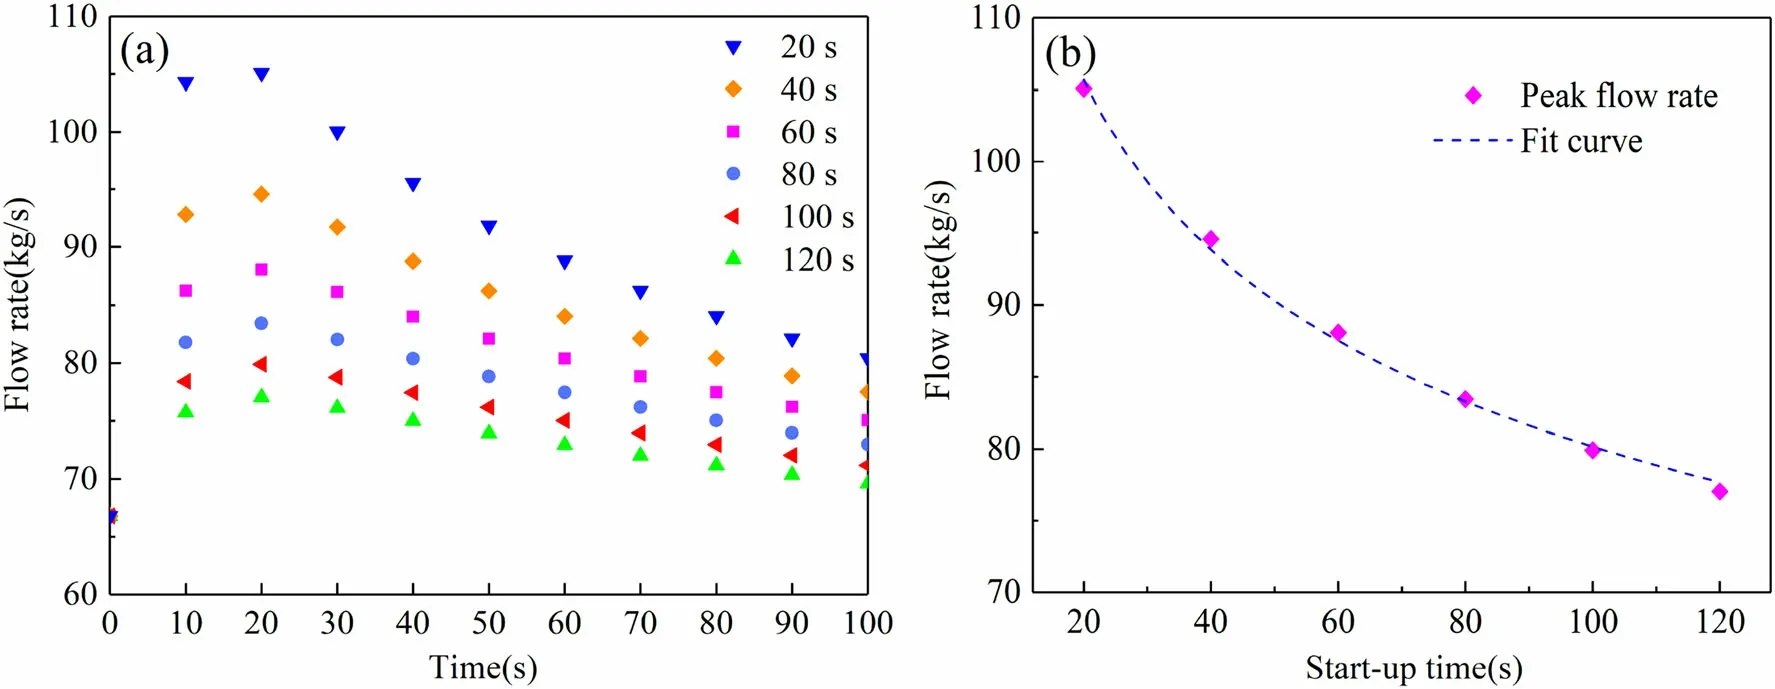
Fig. 15 Changing tendencies of the required primary coolant flow rate and peak flow rate at different start-up times
8 Conclusion
1. A calculation method for the AP1000 PRHR HX was developed. The distributions of important parameters such as TA(i), Tw(i), hA(i), and hB(i)were acquired. The results were compared with the ROSA experimental data, and the maximum error was acceptable. Furthermore, the calculated tube outlet temperature and heat load satisfied the design requirements.
2. The heat-transfer performance of the PRHR HX over 2000s was calculated. The PRHR HX outlet temperature gradually decreased and stabilized under the corresponding boundary conditions. Over time, the heat flux and the tube-inside and tube-outside heattransfer coefficients continuously decreased with an increase in the normalized length from the tube inlet.In addition,the differences between the maximum and minimum values of the three parameters continuously decreased at each moment.
3. The PRHR HX heat-transfer performance was analyzed for four different horizontal lengths:1000,2000,3000, and 4000 mm. The results indicated that the horizontal section length significantly affected the heat load distribution of the three heat-transfer sections but had negligible effects on the distributions of the heat flux and heat-transfer coefficient.
Three types of tubes (with outer diameters of 14.0,19.1,and 25.0 mm)were compared,and the horizontal section length was kept constant(3000 mm).The 14.0-mm-diameter tube had the largest tube-inside heattransfer coefficient. The tube-outside heat-transfer coefficient of this tube was the largest initially but it was eventually equal to those of the other tubes. The heat loads exhibited small differences within each of the three heat-transfer sections.
Under the design heat load, the required heat-transfer area decreased with a reduction in the tube diameter.For the same tube, there were no obvious changes in the required heat-transfer area with different horizontal section lengths.
4. Through a heat-transfer simulation procedure developed for the circulation loop between the reactor and the PRHR HX, the influence of the initial IRWST temperature on the time required to reach saturation temperature was investigated. With an increase in the initial IRWST temperature, the time required for the IRWST temperature to reach the saturation temperature decreased from 23,710 to 10,740 s. In addition,the reactor outlet temperature was significantly affected.
5. The minimum required flow rate to control the reactor outlet temperature at the vessel design temperature for different start-up times was determined. The flow rate first increased to the peak value and then decreased continuously at each start-up time. The peak flow rate was analyzed, and it approximately followed an exponential distribution. The maximum fitting deviation was 0.83%.
Author contributions All authors contributed to the study conception and design. Material preparation, data collection and analysis were performed by Yan-Bin Liu, Xiang-Yu Meng and Xue-Sheng Wang. The first draft of the manuscript was written by Yan-Bin Liu and all authors commented on previous versions of the manuscript.All authors read and approved the final manuscript.
杂志排行

Nuclear Science and Techniques的其它文章
- Recent progress in two-proton radioactivity
- Selection diagram of design algorithms for neutron-focusing supermirrors
- Flow field effect of delayed neutron precursors in liquid-fueled molten salt reactors
- A high fidelity general purpose 3-D Monte Carlo particle transport program JMCT3.0
- New flexible CsPbBr3-based scintillator for X-ray tomography
- Correction to: Shortening the delivery time of proton therapy by real-time compensation method with raster scanning