Cell-free mitochondrial DNA quantification in ischemic stroke patients for non-invasive and real-time monitoring of disease status
2022-09-07NusrathFathimaSandhyaManorenjSandeepKumarVishwakarmaAleemAhmedKhan
Nusrath Fathima, Sandhya Manorenj, Sandeep Kumar Vishwakarma, Aleem Ahmed Khan
Nusrath Fathima, Sandeep Kumar Vishwakarma, Aleem Ahmed Khan, Central Laboratory for Stem Cell Research and Translational Medicine, Centre for Liver Research and Diagnostics,Deccan College of Medical Sciences, Hyderabad 500058, Telangana, India
Sandhya Manorenj, Department of Neurology, Princess Esra Hospital, Deccan College of Medical Sciences, Hyderabad 500058, Telangana, India
Abstract BACKGROUND Acute ischemic stroke (AIS) is one of the major causes of the continuous increasing rate of global mortality due to the lack of timely diagnosis, prognosis, and management. This study provides a primitive platform for non-invasive and cost-effective diagnosis and prognosis of patients with AIS using circulating cellfree mitochondrial DNA (cf-mtDNA) quantification and validation.AIM To evaluate the role of cf-mtDNA as s non-invasive, and affordable tool for realtime monitoring and prognosticating AIS patients at disease onset and during treatment.METHODS This study enrolled 88 participants including 44 patients with AIS and 44 healthy controls with almost similar mean age group at stroke onset, and at 24 h and 72 h of treatment. Peripheral blood samples were collected from each study participant and plasma was separated using centrifugation. The cf-mtDNA concentration was quantified using nanodrop reading and validated through real-time quantitative polymerase chain reaction (RT-qPCR) of NADH-ubiquinone oxidoreductase chain 1 (ND1) relative transcript expression levels.RESULTS Comparative analysis of cf-mtDNA concentration in patients at disease onset showed significantly increased levels compared to control individuals for both nanodrop reading, as well as ND1 relative expression levels (P < 0.0001). Intergroup analysis of cf-mtDNA concentration using nanodrop showed significantly reduced levels in patients at 72 h of treatment compared to onset (P < 0.01). However, RT-qPCR analysis showed a significant reduction at 24 h and 72 h of treatment compared to the disease onset (P < 0.001). The sensitivity and specificity were relatively higher for RT-qPCR than nanodrop-based cfmtDNA quantification. Correlation analysis of both cf-mtDNA concentration as well as ND1 relative expression with National Institute of Health Stroke Scale score at baseline showed a positive trend.CONCLUSION In summary, quantitative estimation of highly pure cf-mtDNA provides a simple, highly sensitive and specific, non-invasive, and affordable approach for real-time monitoring and prognosticating AIS patients at onset and during treatment.
Key Words: Cell-free mitochondrial DNA; NADH-ubiquinone oxidoreductase chain 1; Ischemic stroke;Circulating biomarker; National Institute of Health Stroke Scale score; Stroke assessment; Severity and outcome
lNTRODUCTlON
Stroke is one of the leading causes of morbidity and mortality worldwide[1]. Global Burden of Diseases, Injuries, and Risk Factors Study (GBD) 2017 has reported stroke as the third major cause of death and disability[2]. According to the World Health Organization, the effective prevention approaches to stroke involve decreasing the risk of hypertension, lipid levels, fasting plasma glucose levels, smoking, reduced physical activity, unhealthy diet, and high body-mass index, which is similar to the observations from GBD 2016 and GBD 2017[3,4]. The findings of GBD 2019 Stroke Collaborators indicate that the majority of the global stroke burden (86% of deaths and 89% of disability-adjusted life-years [DALYs]) persists in lower-income and lower-middle-income countries[5]. Globally, over the past three decades, the number of stroke related DALYs has increased substantially (by 33.5 million, from 91.5 million in 1990 to 125 million in 2019).
Emergency stroke treatment depends on the type of stroke, either ischemic or hemorrhagic. The hemorrhagic stroke treatment depends on controlling the amount of bleeding and reducing pressure in the brain caused by the excess fluid. While intravenous administration of tissue plasminogen activator (TPA) remains the gold standard treatment for ischemic stroke[6]. Although progress in treating acute ischemic stroke (AIS) has been slow over the last decade, the goals for treating this frequent condition have grown. The therapeutic window should be increased from 3 to 6 h to improve the therapeutic efficacy because a small proportion of patients arrive for treatment after three hours. Hence, the beneficial clinical outcome of stroke patients relies on examining the proportion of patients receiving a timely and effective diagnosis.
Recently several studies have demonstrated that blood circulating cell-free DNA (cfDNA) analysis can efficiently distinguish ischemic stroke patients from other types of strokes or healthy populations[7,8]. CfDNA is extremely fragmented and circulates freely in the blood. As a result, cfDNA can be quantified easily in the blood through standard blood DNA extraction methods[9]. Blood has been one of the most widely used biofluids for both clinical and research purposes, mainly due to its abundance and easy access; however, both plasma and serum are considered reliable sources due to their stability after long-term storage at ultra-low temperatures (-20 °C or -80 °C). Under normal physiological conditions, small DNA fragments can cross the blood-brain barrier (BBB) and reach into plasma or serum[10]. However, pathological conditions may cause disruption of BBB which increases its permeability and allows the open flow of several molecules, cells, and DNAs between the central nervous system (CNS) and the peripheral circulation[10]. Therefore quantification of cfDNAs in circulation can reflect pathological processes that occur in the CNS[9,11,12]. Although several studies have reported the significance of cfDNA quantification in distinguishing stroke patients[13], none of the studies have evaluated its role before and after treatment with TPA or any other mode of acceptable treatment. Further, blood cfDNA has not traditionally been considered an ideal test for a condition like a stroke[14].
The above-mentioned limitations are accompanied by total DNA estimation in circulation which includes both nuclear and mitochondrial DNA. Accumulating evidences have shown that cell freemitochondrial DNA (cf-mtDNA) is released from damaged mitochondria into circulation which acts as damage-associated molecular patterns (DAMPs) with inflammation in several pathological conditions[15,16]. Moreover, alterations in mitochondrial dynamics affect energy metabolism and post-stroke neuronal function by regulating the number, morphology, and function of mitochondria. The increased interest in mapping several crucial pathways linking stress, mitochondria, and pathophysiology is fueled by recent discoveries implicating mitochondrial signaling in cellular and physiological stress management and mental health[17].
Although cf-mtDNA haplogroups have been demonstrated for their association with stroke onset, the impact of other differential roles of cf-mtDNA on stroke outcomes remains unclear. Hence, individual quantification of cf-mtDNA in circulation may provide a more clear and sensitive tool to overcome the current dilemma of cfDNA in stroke patients[18,19]. However, an ideal clinical evaluation of cfDNA using a simple procedure with good predictive values is required which could be utilized in both prehospital and emergency departments. More importantly, for early and accurate diagnosis of stroke patients specifically with ischemic stroke using cf-mtDNA is critical for early access to interventional therapy and to increase the likelihood of a favorable outcome.
Hence, in this study, quantitative estimation of circulating cf-mtDNA has been performed and validated through quantifying mitochondrial oxidative phosphorylation gene, NADH-ubiquinone oxidoreductase chain 1 (ND1) expression analysis in plasma samples of patients with ischemic stroke. Furthermore, the patients with onset of ischemic stroke have been differentiated from the control population using cf-mtDNA quantity and relative expression levels of ND1 before and after 24 h and 72 h of treatment with either TPA or antiplatelet medications. The diagnostic and prognostic significance of both cf-mtDNA concentration and relative expression levels of ND1 has been evaluated and correlated among the different categories of stroke patients. The results of this study may provide a crucial early and non-invasive tool for diagnosis and prognosis of ischemic stroke patients in real-time for tracking clinical response and improved clinical management.
MATERlALS AND METHODS
Study participants
All study procedures were carried out with the approval of the Institutional Review Board of Deccan College of Medical Sciences, Hyderabad. Informed consent forms were collected from each study participant. Our study group consisted of patients with AIS who were admitted to the stroke unit of our centre within the window period of 4.5 h after the onset of the stroke-related symptoms. A total of 88 individuals including 44 patients with AIS (27 men and 17 women) and 44 healthy controls (29 men and 15 women) with a mean age of 57.46 ± 13.16 years for AIS and 55.46 ± 11.13 years for healthy control were enrolled. All patients underwent a complete analysis of their neurological assessment. Stroke severity was assessed at the time of admission (referred to as baseline) using the National Institute of Health Stroke Scale (NIHSS)[20]. We included only those patients who showed positive treatment responses to either TPA or to antiplatelet therapy. All other patients who were non-responsive to these treatments were excluded. Further, patients with encephalitis, multiple trauma, sepsis, meningitis, hypertensive encephalopathy, migraine, intracranial tumor, post-cardiac arrest, organ failure, endocrine disorders, psychiatric syndromes, shock with hypoperfusion, or drug overdose were also excluded. We also excluded those patients in which the time from the symptom onset to blood collection was more than 12 h.
Sample collection and extraction of circulating cf-mtDNA
A total of 2 mL of venous blood samples were collected in ethylenediaminetetraacetic acid (EDTA)-coated vacutainers from control individuals, and patients with AIS within 2 h window period (i.e., within 4.5 h, referred to as a disease at onset), and after treatment at 24 h and 72 h. To ensure cell-free plasma collection, EDTA vacutainers were centrifuged at 3000 rpm for 15 min at room temperature. The circulating cf-mtDNA was isolated from 300 µL of plasma sample using an in-house protocol established in our laboratory. Briefly, 300 µL of plasma was mixed with 1mL of mitochondrial isolation buffer (pH 7.8) and centrifuged at 3000 rpm for 10 min at 4 °C. After centrifugation, the supernatant was collected and again centrifuged at 10000 x g for 10-15min to collect the pellet containing mitochondria. The cf-mtDNA was extracted using an in-house rapid DNA extraction procedure and precipitated using cold 100% ethanol. Finally, the precipitated DNA pellet was air-dried and dissolved in 1X Tris-EDTA solution. The extracted cf-mtDNA was stored at -20 °C and used for quantification using nanodrop reading, and for mitochondrial DNA specific PCR of ND1 gene transcript.
Quantitative analysis of cf-mtDNA
Nanodrop reading:The extracted cf-mtDNA was quantified using a nanodrop reader at 260/280nm absorbance. A 260/280 ratio of approximately 1.8 and less than 2.0 was considered for pure DNA content without protein contamination and used for further analysis. The DNA concentration was recorded for each sample and reported in ng/µL.
RT-qPCR analysis:Cf-mtDNA concentration was further validated using SYBR Green-based real-time quantitative polymerase chain reaction (RT-qPCR). Plasma cf-mtDNA was quantified for the ND1 gene in a CFX-96 Real-time system (1000TmThermal cycler, BIORAD) using gene-specific primers (forward: 5’-CTACTACAACCCTTCGCTGAC-3’ and reverse: 5’-GGATTGAGTAAACGGCTAGGC-3’). Mitochondrial 12S gene-specific primers were used as endogenous control. The RT-qPCR conditions included a single step of initial denaturation at 94 °C for 3 min, 40 cycles of denaturation at 94 °C for 30 s, annealing at 54 °C for 30 s, and extension at 72 °C for 30 s followed by a melt-curve. All the reactions were performed in triplicates in two different cohort studies with 100% PCR efficiency.
Correlation analysis:The correlation was established between cf-mtDNA concentration as well as ND1 relative fold expression in controls and patients at disease onset, and during the treatment at 24 h, and 72 h by computing Pearson correlation coefficient (r) and identifyingPvalues. Further, correlation of cfmtDNA concentration as well as ND1 relative fold expression was performed with NIHSS score at the baseline in patients with AIS during the disease onset to predict its clinical significance.
Statistical analysis
The statistical analysis was performed and data was recorded using GraphPad Prism software (version 5.0, and 8.4.2). The data were presented as mean ± SD. One-Way Analysis of Variance was used to compare the multiple groups, and a student t-test was used to compare two groups with a significance levelP <0.05 at a 95% confidence interval (CI). Relative operative curve (ROC) analysis was performed to predict the diagnostic value of cf-mtDNA concentration and ND1 expression in relative fold change of ND1 gene which was calculated using 2-ΔΔCtmethod21. Correlation analysis was performed by calculating the Pearson correlation coefficient (r) among different groups. ThePvalue was also calculated at 95%CI to demonstrate the statistical significance of positive and negative correlation between different groups.
RESULTS
Discriminative analysis and diagnostic value of cf-mtDNA concentration
Comparative analysis of cf-mtDNA concentration in patients at disease onset showed significantly increased levels compared to control individuals (mean difference (MD): -14.16 ± 1.691; CI: -17.55 to -10.76;P <0.0001; Figure 1A). Further, comparison of cf-mtDNA concentration at 24 h (MD: 8.292 ± 2.146; CI: -12.65 to -3.933;P <0.0001; Figure 1B) and 72 h (MD: 3.035 ± 0.6559; CI: -4.378 to -1.692;P <0.0001; Figure 1C) with control individuals also showed significant increased values. ROC analysis of cfmtDNA concentration in patients at disease onset showed significantly higher predictive value (AUC: 0.9808;P <0.0001; Figure 1D) representing 69.71% sensitivity and 76.34% specificity. Likewise, the ROC at 24 h of treatment also showed significantly higher diagnostic value of cf-mtDNA concentration with 64.68% sensitivity and 55.91% specificity (AUC: 0.7290;P= 0.029; Figure 1E); however, it represented 25.18% poor diagnostic value to discriminate patients according to their response to treatment at 24 h. In contrast, at 72 h of treatment cf-mtDNA didn’t show positive predicative value for the diagnostic significance and represented only 71.42% sensitivity and 50.18% specificity (AUC: 0.7500;P= 0.1128; Figure 1F).
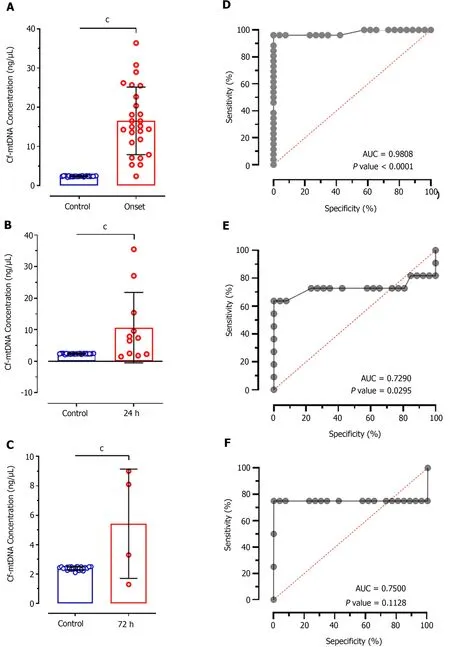
Figure 1 Difference in cell-free mitochondrial DNA concentrations and their diagnostic value in patients after treatment. A-C: Significantly increased levels of cell-free mitochondrial DNA (cf-mtDNA) were observed in patients at disease onset 24 h of treatment and 72 h of treatment compared to control individuals; D-F: Relative operative curve plots showing the diagnostic value of cf-mtDNA concentrations for discriminating the patients at disease onset 24 h of treatment, and 72 h of treatment. cP < 0.0001. AUC: Area under curve; cf-mtDNA: Cell-free mitochondrial DNA; ROC: Receiver operating characteristic.
Intergroup analysis and diagnostic significance of cf-mtDNA concentration
Intergroup analysis showed significantly reduced levels of cf-mtDNA concentration in patients at 72 h of treatment compared to the disease onset (MD: 11.12; CI: 0.7827 to 21.46;P <0.01; Figure 2A). However, patients after 24 h of treatment didn't show significant difference in patients at onset (MD: 5.864; CI: -1.059 to 12.79;P >0.05). Similarly, no significant difference was observed between 24 h and 72 h of treatment (MD: 5.257; CI: -5.982 to 16.50;P >0.05). The ROC analysis of cf-mtDNA concentration at 24 h of treatment showed significantly higher predictive value (AUC: 0.7115;P< 0.044; Figure 2B) with 65.84% sensitivity and 55.12% specificity. Likewise, the ROC analysis at 72 h showed significantly higher diagnostic value of cf-mtDNA concentration with 84.25% sensitivity and 54.27% specificity (AUC: 0.8750;P= 0.0173; Figure 2C). However, no significant diagnostic value was observed for discriminating patients on treatment at 24 h and 72 h which is evident by only 57.14% sensitivity and 52.59% specificity (AUC: 0.5909;P= 0.6015; Figure 2D).
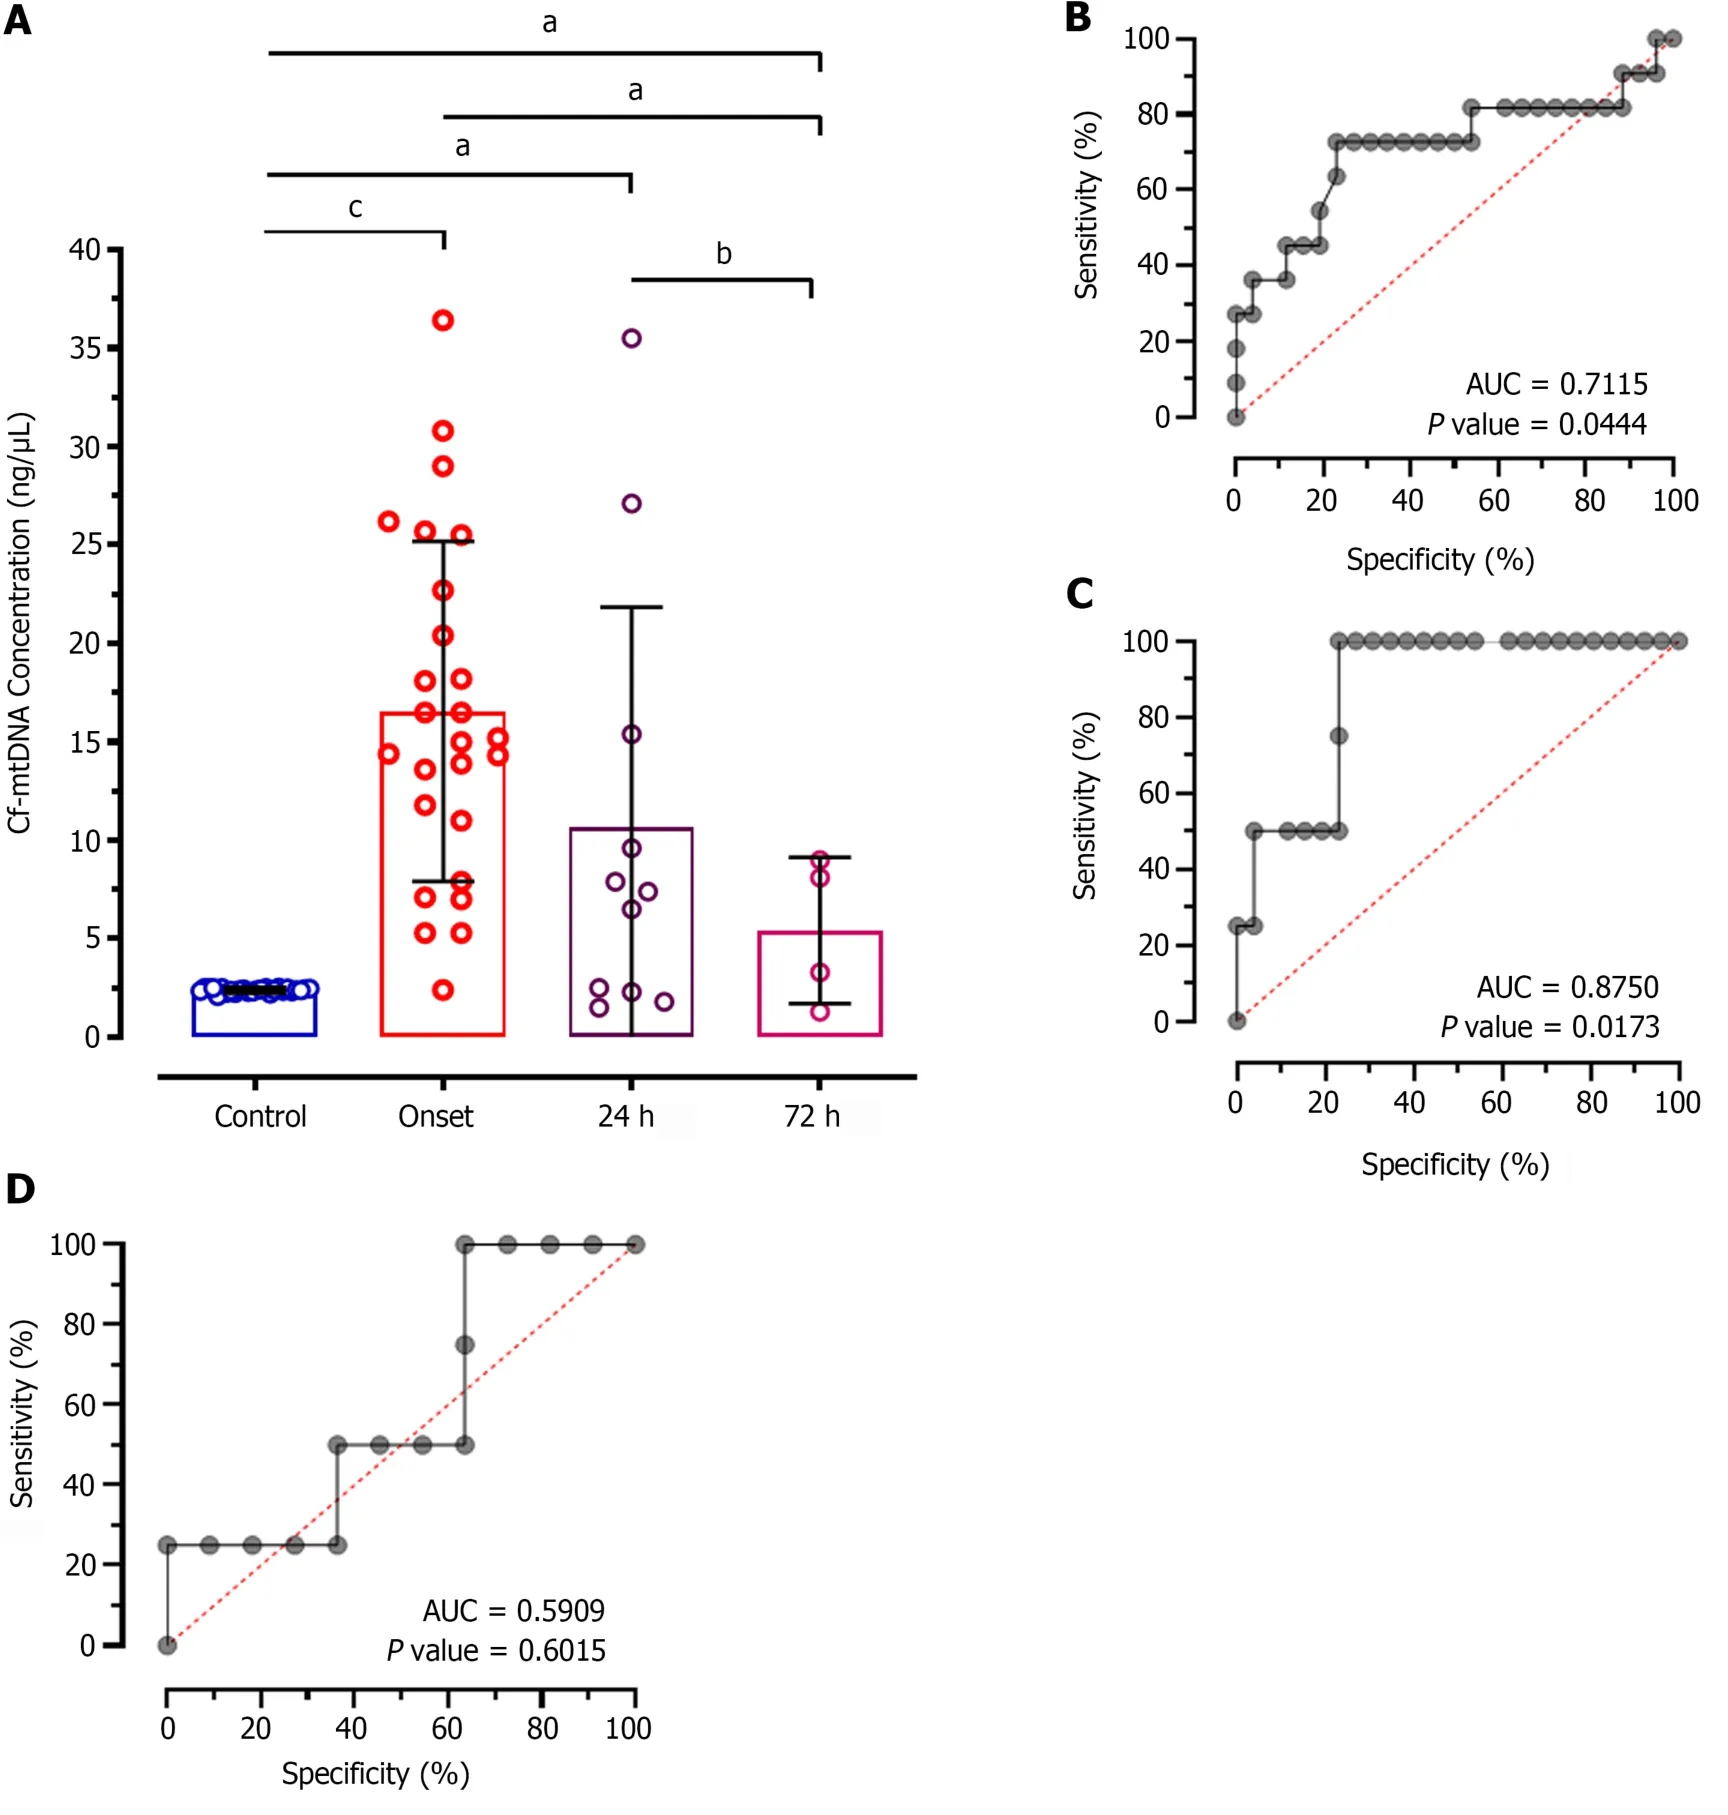
Figure 2 lntergroup differences in cell-free mitochondrial DNA concentrations and their diagnostic value in patients at disease onset and treatment. A: Significantly decreased cell-free mitochondrial DNA (cf-mtDNA) concentration was observed after 72 h of treatment compared to patients at disease onset aP < 0.01; B-D: Receiver operating characteristic plots showing the diagnostic significance of cf-mtDNA concentrations for discriminating patients at disease onset with 24 h of treatment, and 72 h of treatment. bP < 0.001; cP < 0.0001. AUC: Area under curve; cf-mtDNA: Cell-free mitochondrial DNA; ROC: Receiver operating characteristic.
Discriminative analysis and diagnostic significance of relative ND1 expression levels
The concentrations of cf-mtDNA in plasma samples was further validated using SYBR Green-based RTqPCR analysis of Ct values of mitochondrial DNA sequence ND1 relative to 12S endogenous control. This analysis showed significant difference between Ct values of ND1 between control individuals and patients at disease onset (MD: -7.457 ± 2.030; CI: -11.56 to -3.359;P< 0.0001; Figure 3A), at 24 h of treatment (MD: -0.5316 ± 0.1454; CI: -0.8281 to -0.2350;P< 0.0001; Figure 3B), and at 72 h of treatment (MD: -0.6572 ± 0.1983; CI: -1.067 to -0.2479;P< 0.001; Figure 3C). ROC analysis for relative ND1 expression levels at disease onset showed significantly higher diagnostic value with 68.70% sensitivity and 72.44% specificity (AUC: 0.9021;P< 0.0001; Figure 3D). Likewise, ROC analysis at 24 h of treatment showed significantly higher diagnostic value of ND1 expression (AUC: 0.8115,P= 0.002) with 69.47% sensitivity and 62.65% specificity; however, it was 9% lower compared to disease onset patients. Almost similar diagnostic value was observed at 72 h of treatment (AUC: 0.9083;P= 0.002) with 82.66% and 59.80% specificity for ND1 relative expression.
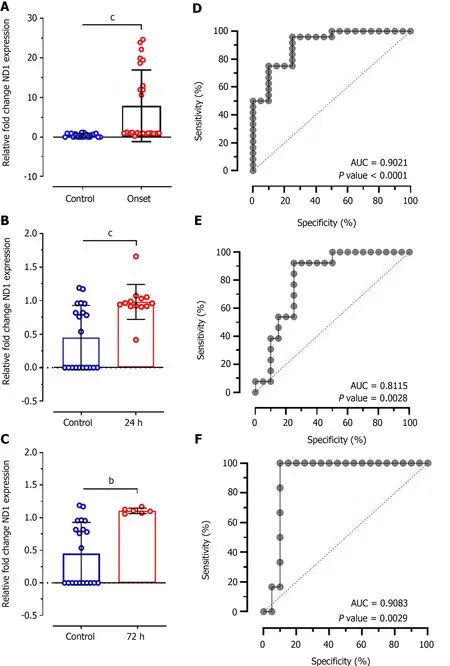
Figure 3 lntergroup differences in cell-free mitochondrial DNA concentrations. A-C: Changes in relative expression levels of NADH-ubiquinone oxidoreductase chain 1 (ND1) compared to 12S expression between control individuals and patients at disease onset, 24 h of treatment, and 72 h of treatment; D-F: Receiver operating characteristic plot showing the diagnostic significance of ND1 relative expression levels in patients at disease onset, 24 h of treatment, and 72 h of treatment. bP < 0.001; cP < 0.0001. AUC: Area under curve; cf-mtDNA: Cell-free mitochondrial DNA; ROC: Receiver operating characteristic.
Intergroup analysis and diagnostic significance of relative ND1 expression levels
Intergroup analysis of relative expression levels of ND1 showed significantly reduced levels at 24 h (MD: 6.926; CI: - 1.874 to 11.98;P <0.001), and at 72 h of treatment (MD: 6.800; CI: 1.614 to 11.99;P <0.001) compared to patients at disease onset (Figure 4A). ROC analysis showed significantly higher diagnostic value of ND1 relative expression to discriminate patients at disease onset and at 24 h of treatment with 64.31% sensitivity and 57.75% specificity (AUC: 0.7147;P= 0.033; Figure 4B), and at 72 h of treatment (AUC: 0.8974;P= 0.0007; Figure 4C). While, no diagnostic significance of ND1 relative expression values was observed for discriminating patients at 24 h and at 72 h of treatment (AUC: 0.5139;P= 0.89; Figure 4D) and represented only 51.14% sensitivity and 50.28% specificity.
Correlation analysis of cf-mtDNA concentration and relative ND1 expression
Correlation analysis of circulating cf-mtDNA concentrations showed positive relationship between control and onset (r= 0.17;P= 0.404), control and 24 h of treatment (r= 0.06;P= 0.863; Figure 5A and B). However, negative correlation was observed between control and at 72 h of treatment (r =-0.36;P= 0.642), onset and at 24 h of treatment (r =-0.40;P= 0.228), and onset and at 72 h of treatment (r =-0.09;P= 0.908), and at 24 h and 72 h of treatment (r =-0.82;P= 0.181).

Figure 4 Multiple comparison test showing intergroup differences in NADH dehydrogenase 1 relative expression levels and its diagnostic significance. A: Significantly decreased NADH dehydrogenase 1 (ND1) relative expression levels were observed after 24 h and 72 h of treatment compared to patients at disease onset (bP < 0.001) and were comparable to controls; B-D: Receiver operating characteristic plots show the association of ND1 expression levels between patients at disease onset, 24 h of treatment, and 72 h of treatment. bP < 0.001; cP < 0.0001. AUC: Area under curve; ND1: NADH dehydrogenase 1; ROC: Receiver operating characteristic.
Furthermore, correlation matrix analysis of relative expression levels of ND1 showed significantly negative correlation between control and stroke onset (r =-0.61;P= 0.004), control and at 24 h of treatment (r =-0.62;P= 0.022; Figure 5C and D). Although onset and at 72 h of treatment showed negative correlation; however, no statistical significance was achieved (r =-0.27;P= 0.395). While, correlations between other groups showed positive association including onsetvs24 h of treatment (r= 0.05;P= 0.867), and 24 hvs72 h of treatment (r= 0.30;P= 0.401).
Multiple linear regression
Concentration of cf-mtDNA: The disparity of cf-mtDNA values didn't show significant deviation from its linear proportion and demonstrated continuous increasing trend for controlvspatients with stroke onset (CI: 2.259 to 2.45;P= 0.128; Figure 6A), and controlvspatients at 72 h of treatment (CI: 1.906 to 3.075;P= 0.83; Figure 6C). However, cf-mtDNA values for controlvspatients at 24 h of treatment showed significant association in linear proportion with continuous increasing trend (CI: 2.255 to 2.543;P= 0.050; Figure 6B). Similarly, an increasing trend and non-significant deviation of cf-mtDNA concentration values were observed for stroke onsetvspatients at 24 h of treatment (CI: 7.572 to 24.19;P= 0.356; Figure 6D), onsetvsat 72 h of treatment (CI: 40.30 to 72.99;P= 0.279; Figure 6E), and at 24 hvs72 h of treatment (CI: 17.01 to 78.58;P= 0.74; Figure 6F).

Figure 5 Correlation analysis showing differences in cell-free mitochondrial DNA concentration and relative expression levels of NADH dehydrogenase 1 among different groups. A: Heat map showing correlation coefficient r values represented within the heat map; B: P values showing differences in the association of cell-free mitochondrial DNA concentration among different groups; C: Heat map showing correlation coefficient r values represented within the heat map of ND1 relative expression; D: P values showing differences in the association of relative ND1 expression levels among different groups. CfmtDNA: Cell-free mitochondrial DNA; ND1: NADH dehydrogenase 1.
Relative ND1 expression levels:Although significant deviation of ND1 relative expression levels was observed between control and stroke onset patients (CI: 0.4319 to 0.8875;P= 0.039; Figure 7A), and control and at 24 h of treatment patients (CI: 0.8292 to 2.550;P= 0.031; Figure 7B). The control and at 72 h of treated patients didn't show significant deviation from its linear proportion and demonstrated a continuously increasing trend (CI: -9.746 to 9.316;P= 0.7664; Figure 7C). However, a significant linear association with continuous increasing trend was reported between onset patientsvsat 24 h of treatment (CI: 0.2670 to 1.525;P= 0.005; Figure 7D), onset patientsvsat 72 h of treatment (CI: 35.12 to 87.97;P= 0.0001; Figure 7E), and at 24 hvsat 72 h of treatment (CI: 7.757 to 4.86;P= 0.021; Figure 7F).
Correlation of NIHSS score at baseline with cf-mtDNA concentration and relative ND1 expression
The correlation analysis of baseline NIHSS score with cf-mtDNA concentration in all the enrolled study patients showed positive relationship (r= 0.6353;P= 0.0001; Figure 8A and B), which was evident with the increasing or decreasing trend of cf-mtDNA concentration values in relation to the higher or lower NIHSS score, respectively. Similar observations were reported for ND1 relative expression values when correlated with the baseline NIHSS score of individual patients (r= 0.7277;P= 0.0001; Figure 8C and D).
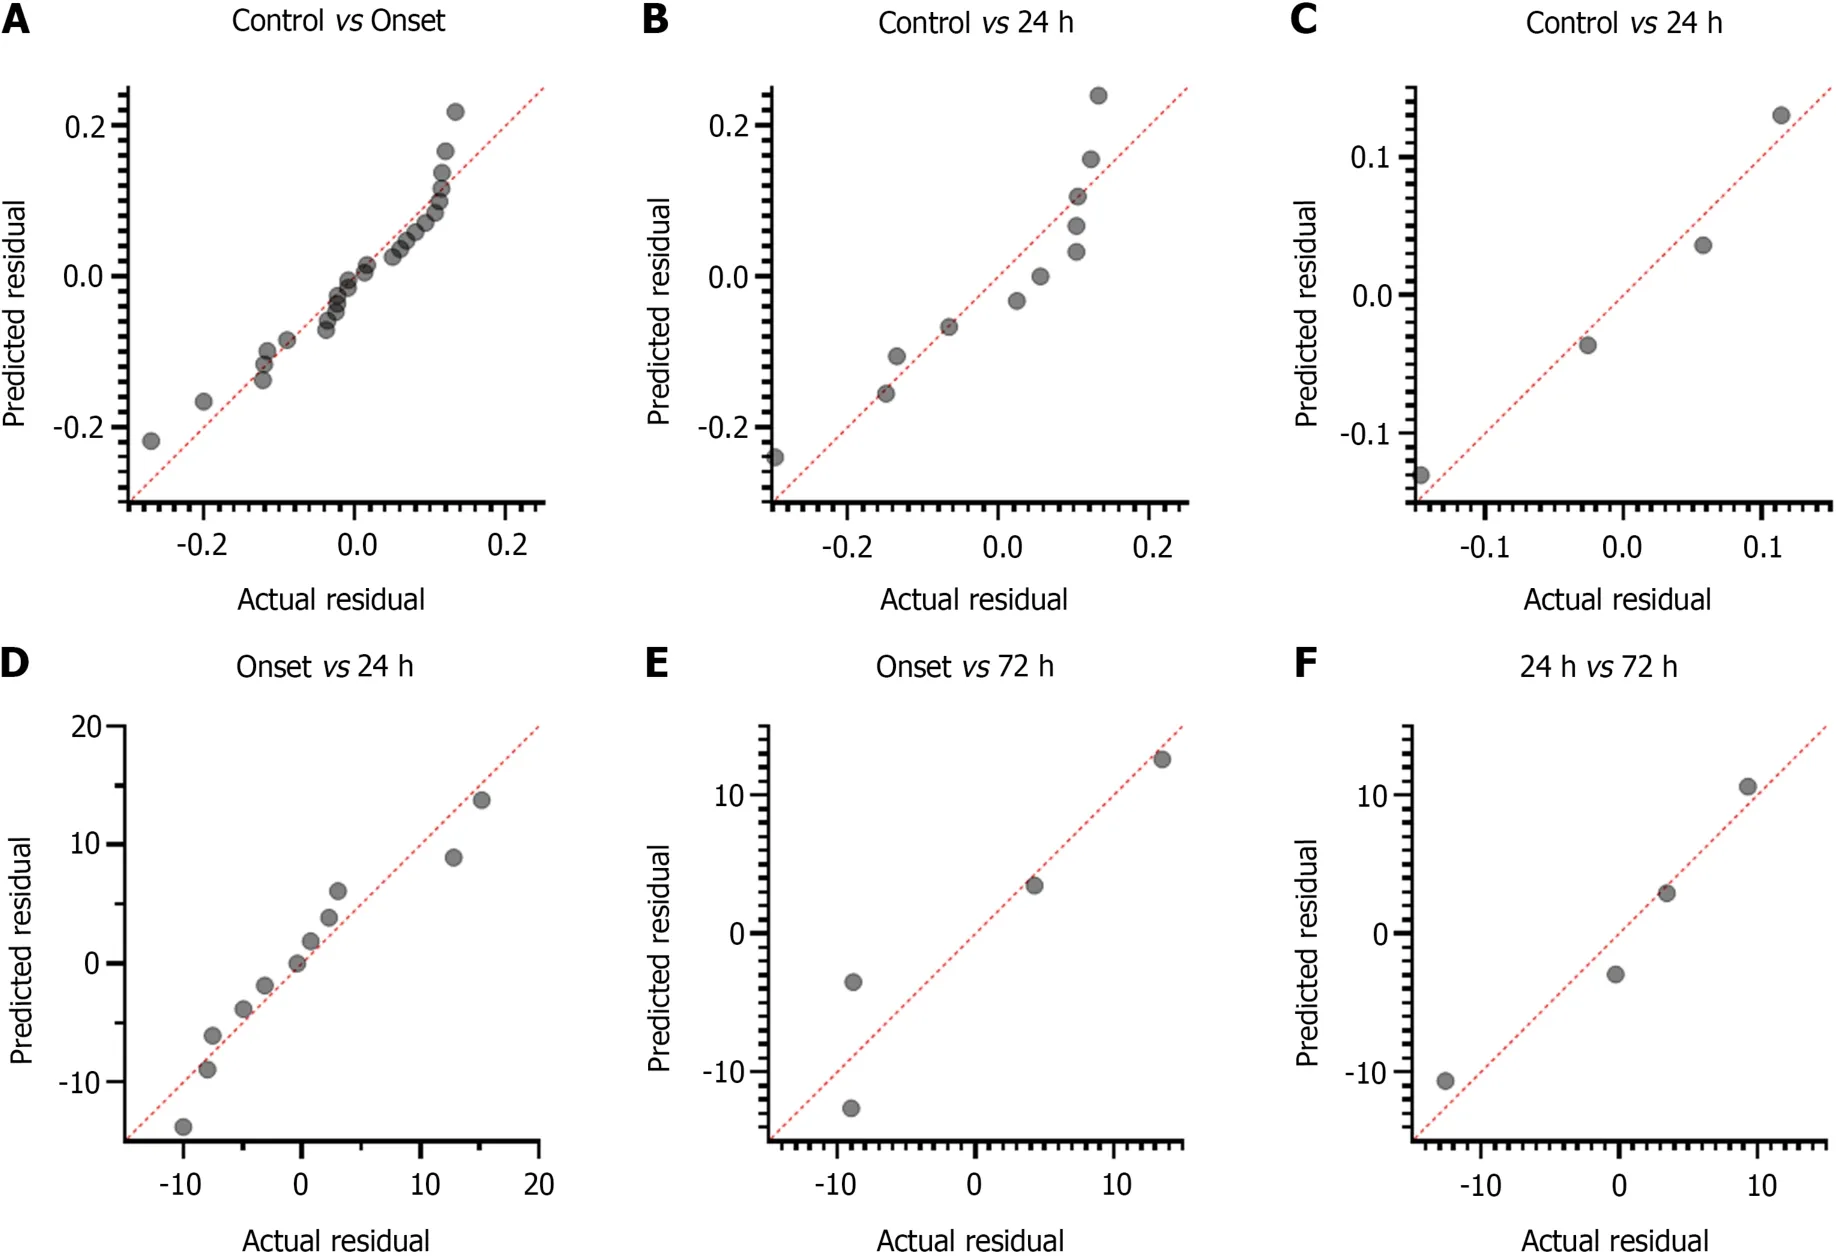
Figure 6 Multiple linear regression analysis. A-F: Multiple linear regression analysis of cf-mtDNA concentration between different groups showing their deviation and relationship with linear response. Cf-mtDNA: Cell-free mitochondrial DNA.

Figure 7 Multiple linear regression analysis. A-F: Multiple linear regression analysis of ND1 relative expression levels between different groups showing their deviation and relationship with linear response. ND1: NADH dehydrogenase 1.
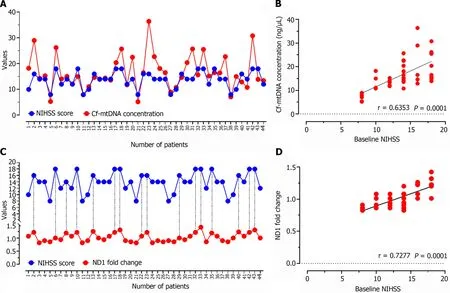
Figure 8 Correlation analysis. A-D: Correlation analysis showing a positive association between baseline NIHSS score and cell-free mitochondrial DNA concentration, and ND1 relative expression. Cf-mtDNA: Cell-free mitochondrial DNA; ND1: NADH dehydrogenase 1; NIHSS: National Institutes of Health Stroke Scale.
DlSCUSSlON
This study assessed the ability of plasma cf-mtDNA levels to determine its role in diagnosing patients with AIS. For quantitative estimation of cf-mtDNA, we opted two separate widely used, and highly specific and sensitive tools: (1) Nanodrop reading for cf-mtDNA concentration; and (2) RT-qPCR analysis for relative fold change in ND1 expression. These analyses were conducted in patients with onset of ischemic stroke and at 24 h and at 72 h of treatment with TPA or antiplatelet therapy. The findings of our study revealed significantly higher values of cf-mtDNA concentration as well as differences in relative fold expression of ND1 gene in AIS patients at the disease onset compared to healthy control participants. Both the assays had > 64% sensitivity and > 55% specificity. Although both the sensitivity and specificity were higher for ND1 expression, ROC analysis showed the higher diagnostic significance of cf-mtDNA concentration estimated through nanodrop reading (AUC: 0.9808) than RT-qPCR (AUC: 0.9021). While both the tools provide optimum outcomes, quantifying cf-mtDNA through nanodrop reading can provide a more easy-to-use, cost-effective, and sensitive tool for diagnostic implications in patients with AIS. However, such outcome measures can be seen only when we selectively extract and quantify cf-mtDNA rather than total cfDNA (that includes both nuclear and mitochondrial DNA).
Although some of the earlier studies have reported a significant association of total cfDNA quantity in patients with stroke, they failed to demonstrate the individual role of cf-mtDNA and cf-nuclear DNA in discriminating AIS patients from the general population[7,12,13]. Some of the recent studies have also demonstrated significant involvement of cf-mtDNA in distinguishing stroke from healthy population[19]. Recent studies have also demonstrated that next-generation sequencing (NGS) can provide a more comprehensive tool for the quantification of mtDNA copy numbers[21-23]. However, the output from the NGS dataset depends on the ratio of sequencing reads of nuclear and mtDNA, but it allows analysis of thousands of available data sets which are shared by the research consortia. Although this technique enables high-sensitivity, high-throughput, and accurate assessment of mtDNA levels, a series of normalizations are required to correct for purity, counts, and batch biases[24,25]. Moreover, NGS poses a huge economic burden to the patients or their parents, hence tools presented in our study can be more widely applicable for exploring a non-invasive, simple, and cost-effective assessment with a reduced burden in developing countries.
In addition, we have also explored the usability of a quantitative assessment of cf-mtDNA before and during the treatment of AIS patients. Intergroup analysis of patients at onset and at treatment showed significantly reduced levels of both cf-mtDNA measured by nanodrop reading (84.25% sensitivity and 54.27% specificity), and ND1 relative expression (64.31% sensitivity and 57.75% specificity) assays at 72 h of treatment which was almost similar to the control individuals. These findings represent a highly significant diagnostic value for quantifying cf-mtDNA concentration as well as ND1 expression in prognostication of stroke patients. In accordance with our study results, a recent international, multicenter case-control study conducted on 3,498 cases of acute, first stroke from 25 countries showed buffy coat mtDNA copy number as a robust marker of post-stroke, and determinant of related outcomes[26]. Several other studies have also demonstrated the role of cf-mtDNA in various diseases and different types of cancers[27-29].
During the technical comparison, we observed that ND1 expression also provides a significant difference at 24 h, and at 72 h of treatment (P= 0.0007); however, nanodrop quantification of cf-mtDNA didn't reveal any such difference (P= 0.6015). Furthermore, cf-mtDNA concentration by nanodrop quantification failed to demonstrate a significant difference between onset and at 24 h of treatment patients (P >0.05). However, RT-qPCR-based quantification of cf-mtDNA through ND1 expression showed a significant difference between values at stroke onset and at 24 h of treatment (P <0.001) which also predicted significant diagnostic value between the groups during ROC curve analysis (P= 0.0330). This result revealed that RT-qPCR can provide more specific and sensitive information during prognostication of patients with AIS. Furthermore, correlation as well as multiple linear regression analysis in our study showed relatively higher positive and negative predictive values, and diagnostic and prognostic significance of RT-qPCR-based ND1 expression compared to nanodrop-based cf-mtDNA concentration. Similarly, a study by Hernández-Jiménezet al[30] showed that mtDNA estimation can predict its applicability in differentiating severe AIS stroke patients with or without infections.
Comparatively lower sensitivity and specificity of cf-mtDNA quantification using nanodrop reading in our study can be explained based upon their source of release and mechanism of cell death. Cell death can be triggered either in form of apoptosis or necrosis which in turn releases cf-mtDNA in circulation. However, changes in cerebral blood flow, ischemia to the brain parenchyma, inflammation, and neuronal cell damage all contribute to apoptosis and neurological impairment in stroke patients and ultimately affect the amount of mtDNA release[8]. Hence, there is a chance of variability from patient to patient in cf-mtDNA concentration using nanodrop-based quantification. In contrast to this, ND1 is a high copy number gene in the mitochondrial genome which is the initial component of the oxidative phosphorylation system. Hence, quantifying ND1 relative expression levels or copy numbers may provide more specific information to predict cellular response in real-time[31]. Several studies support our findings for increased sensitivity and specificity of RT-qPCR-based analysis of cf-mtDNA[32-34].
Besides these findings, the type of cells involved in the release of the source mtDNA must be determined focusing on the molecular mechanisms responsible for the AIS that may provide crucial insights into understanding the pathophysiology and response to the treatment. Furthermore, specifically quantifying cf-mtDNA with associated co-morbidities and patient outcomes in long-term follow-up may produce a more specific response. In our study, 80% of cases had anterior circulation, while the number of cases in the remaining 20% was very less, so we couldn’t separate the data based on anterior and posterior circulation. We also couldn’t correlate our findings with the primary outcome measure after stroke using a modified Rankin scale score which can categorize independent stroke survivors from dependents. Therefore, further studies with a larger sample size and prolonged followup in correlation with more appropriate clinical outcome measures are required to validate cf-mtDNA quantification as a precise and reproducible tool to measure AIS severity and outcome in real-time.
CONCLUSlON
Quantification of cf-mtDNA in circulation using nanodrop reading or RT-qPCR-based assays may provide a simple, highly sensitive and specific, non-invasive, and affordable approach for real-time monitoring and prognostication of AIS patients at onset and during treatment. Hence, this approach may provide a widely acceptable and applicable platform at a relatively lower cost and less time for different clinical conditions other than AIS with further exploration.
ARTlCLE HlGHLlGHTS
Research background
Role of circulating cell-free mitochondrial DNA (cf-mtDNA) in assessing disease status and treatment response of acute ischemic stroke (AIS) patients. Quantitative discrimination of AIS patients from the general population using cf-mtDNA. Compared sensitivity and specificity of nanodrop reading and real-time quantitative polymerase chain reaction (RT-qPCR) tools for quantifying cf-mtDNA.
Research motivation
AIS results in a continuously increasing rate of morbidity and mortality, and reduced quality of life worldwide. Cellular apoptosis and necrosis are major events during AIS. The amount of DNA present in circulation is directly proportional to the host cell’s death and response.
Research objectives
To validate the quantitative role of cf-mtDNA in discriminating AIS patients from the general population and identifying the treatment response while comparing the sensitivity and specificity of nanodrop reading and RT-qPCR tools.
Research methods
Nanodrop reading and RT-qPCR were used to quantify cf-mtDNA in circulation. The sensitivity and specificity of both the assays were measured using relative operator characteristic (ROC) curve analysis. Correlation analysis of cf-mtDNA was performed with NIHSS score.
Research results
The findings of our study revealed significantly higher values of cf-mtDNA concentration as well as differences in relative fold expression of ND1 gene in AIS patients at the disease onset compared to healthy control participants. ROC analysis showed the higher diagnostic significance of cf-mtDNA concentration estimated through nanodrop reading than RT-qPCR. Intergroup analysis of patients at onset and at treatment showed significantly reduced levels of both cf-mtDNA measured by nanodrop reading, and ND1 relative expression assays at 72 h of treatment. During the technical comparison, we observed that ND1 expression also provides a significant difference at 24 h, and at 72 h of treatment; however, nanodrop quantification of cf-mtDNA didn't reveal any such difference.
Research conclusions
Quantification of cf-mtDNA in circulation using nanodrop reading or RT-qPCR-based assays may provide a simple, highly sensitive and specific, non-invasive, and affordable approach for real-time monitoring and prognostication of AIS patients at stroke onset and during treatment.
Research perspectives
This approach may provide a widely acceptable and applicable platform at a relatively lower cost and time for different clinical conditions other than AIS with further exploration.
FOOTNOTES
Author contributions:Fathima N performed lab experiments, collected the data, performed the statistical analysis, and wrote and formatted the manuscript; Manorenj S provided samples and clinical inputs for the study; Khan AA and Vishwakarma SK provided inputs, designed the study, helped in data analysis and presentation, and wrote and edited the manuscript.
lnstitutional review board statement:All study procedures were carried out with the approval of the Institutional Review Board of Deccan College of Medical Sciences, Hyderabad, Telangana, India.
lnstitutional animal care and use committee statement:All animal experiments conformed to the internationally accepted principles for the care and use of laboratory animals.
Conflict-of-interest statement:All authors declare that they have no conflict of interest.
Data sharing statement:No additional data are available.
ARRlVE guidelines statement:All authors have read the ARRIVE guidelines, and the manuscript was prepared and revised according to the ARRIVE guidelines.
Open-Access:This article is an open-access article that was selected by an in-house editor and fully peer-reviewed by
external reviewers. It is distributed in accordance with the Creative Commons Attribution NonCommercial (CC BYNC 4.0) license, which permits others to distribute, remix, adapt, build upon this work non-commercially, and license their derivative works on different terms, provided the original work is properly cited and the use is noncommercial. See: https://creativecommons.org/Licenses/by-nc/4.0/
Country/Territory of origin:India
ORClD number:Nusrath Fathima 0000-0001-9802-0146; Sandhya Manorenj 0000-0003-4699-3645; Sandeep Kumar Vishwakarma 0000-0001-5731-8210; Aleem Ahmed Khan 0000-0001-7075-9037.
S-Editor:Wang LL
L-Editor:A
P-Editor:Cai YX