The Distribution of UV Radiation Field in the Molecular Clouds of Gould Belt
2022-09-02JifengXia夏季风NingyuTangQijunZhiSihanJiaoJinjinXieGaryFullerPaulGoldsmithandDiLi
Jifeng Xia (夏季风)Ningyu TangQijun ZhiSihan JiaoJinjin XieGary A.FullerPaul F.Goldsmithand Di Li
1School of Physics and Electronic Science,Guizhou Normal University,Guiyang 550025,China; qjzhi@gznu.edu.cn
2 National Astronomical Observatories,Chinese Academy of Sciences,Beijing 100101,China; dili@nao.cas.cn
3 University of Chinese Academy of Sciences,Beijing 100049,China
4 Department of Physics,Anhui Normal University,Wuhu 241002,China; nytang@ahnu.edu.cn
5 Guizhou Provincial Key Laboratory of Radio Astronomy and Data Processing,Guizhou Normal University,Guiyang 550001,China
6 Shanghai Astronomical Observatory,CAS,Shanghai 200030,China
7 Jodrell Bank Centre for Astrophysics,Department of Physics &Astronomy,The University of Manchester,Manchester M13 9PL,United Kingdom
8 I.Physikalisches Institut,University of Cologne,Zülpicher Str.77,D-50937 Köln,Germany
9 Jet Propulsion Laboratory,California Institute of Technology,4800 Oak Grove Drive,Pasadena,CA 91109,United States of America
Abstract The distribution of ultraviolet (UV) radiation field provides critical constraints on the physical environments of molecular clouds.Within 1 kpc of our solar system and fostering protostars of different masses,the giant molecular clouds in the Gould Belt present an excellent opportunity to resolve the UV field structure in star-forming regions.We performed spectral energy distribution(SED)fitting of the archival data from the Herschel Gould Belt Survey(HGBS).Dust radiative transfer analysis with the DUSTY code was applied to 23 regions in 14 molecular complexes of the Gould Belt,resulting in the spatial distribution of the radiation field in these regions.For 10 of 15 regions with independent measurements of star formation rate,their star formation rate and UV radiation intensity largely conform to a linear correlation found in previous studies.
Key words: ISM: clouds–(ISM:) dust–extinction–radiative transfer
1.Introduction
The interstellar medium(ISM)is the cradle of star formation.Its evolution is strongly affected by ultraviolet (UV) radiation.By ejecting electrons from dust grains and directly exciting atoms and molecules,UV photons ionize atoms,dissociate molecules and heat gases (e.g.,Tielens &Hollenbach1985;Ferrière2001;Draine2011).Kennicutt (1998) found a tight correlation between UV radiation and the star formation rate(SFR) in galaxies.In Galactic studies,most previous investigations focused on the distribution of the UV radiation field of individual nearby regions (e.g.,Liseau et al.1999;Pineda et al.2010).
Within 1 kpc of our solar system,the Gould Belt containing a lot of molecular complexes provides an excellent opportunity to investigate the relationship between UV intensity and SFR under diverse environments (Ward-Thompson et al.2007).Most molecular complexes of the Gould Belt harbor bright young OB stellar clusters or star-forming regions while the rest show little sign of star formation.For instance,the Orion complex is a widely studied giant molecular region with abundant clustering of OB stars and turbulent massive star formation (e.g.,Lada et al.1991;Tatematsu et al.1998).Similar to Orion,the Serpens/Aquila Rift is a rich complex with well-known massive star-forming regions,e.g.,the W40 HII region that contains embedded young high-mass stars(e.g.,Kawamura et al.1999).Although the Cepheus region contains an OB star (HD 200775 in Cep 1172),it has been generally considered as a low to intermediate mass star-forming region.The Lupus dark-cloud complex was found to be surrounded by about 70 T Tauri stars,with no indication of a massive OB star inside (e.g.,Hara et al.1999).The Chamaeleon-Musca darkcloud complex,including Cha I,II,III and the Musca dark lane,is a region with low-mass star formation(e.g.,Cambrésy1999;Mizuno et al.2001).IC 5146 is a filamentary dark cloud with scattered low star formation activity(e.g.,Dobashi et al.1994).The Pipe Nebula has been a primary example with little signs of disturbance from star formation(e.g.,Onishi et al.1999).No star formation was found in the Polaris Flare,a high-latitude translucent cloud (e.g.,Heithausen &Thaddeus1990).
Utilizing the Spectral and Photometric Imaging Receiver(SPIRE) and Photodetector Array Camera and Spectrometer(PACS) instruments on board the Herschel10Herschel is a European Space Agency (ESA) space observatory with science instruments provided by European-led Principal Investigator consortia and with important participation from NASA.Space Observatory,the Herschel Gould Belt Survey (HGBS) covered a substantial fraction of the Gould Belt.Specifically,images were taken at 250,350 and 500 μm for regions withAV>3 mag with SPIRE and at 70 and 160 μm for those withAV>6 mag with PACS.This survey covers the following 14 molecular complexes: Aquila,Cepheus,Chamaeleon,Corona Australis,IC 5146,Lupus,Musca,ρ Oph,Orion,Perseus,Pipe Nebula,Polaris,Taurus and Serpens.
The dust radiative transfer model,DUSTY (Ivezic &Elitzur1997;Nenkova et al.2000) accommodates different kinds of geometry and radiation parameters.Li et al.(2003)demonstrated the utilities of the DUSTY code to derive the UV intensity of the Orion clouds based on fitting the dust temperature data.We further develop the recipe and apply it to the full set of HGBS data.
This paper is organized as follows.In Section2,we introduce information on column density,dust temperature and SFR toward the HGBS molecular complexes.The DUSTY radiative transfer code and method for calculating the UV radiation intensity map are described in Section3.Results and further discussions are presented in Sections4and5,respectively.The summary is in Section6.
2.Data
2.1.Herschel Dust Continuum Emission
Dust emission is almost always optically thin at(sub)millimeter wavelengths and can thus act as a surrogate tracer of the total(gas+dust)mass along the line of sight(LOS)(Roy et al.2014).The HGBS took a census of the nearby(0.5 kpc)molecular cloud complexes for an extensive imaging survey of the densest portions of the Gould Belt,down to a 5σ column sensitivityNH2∼1021cm−2orAV∼1 mag (André et al.2010).We use the HGBS data to generate the column density map of 23 molecular clouds that belong to 14 molecular complexes of the Gould Belt.The molecular clouds studied in this paper are Aquila M2(André et al.2010),Cep 1151,Cep 1172,Cep 1228,Cep 1241,Cep 1251(Di Francesco et al.2020),Cham I,Cham II,Cham III(Winston et al.2012),(Alves de Oliveira et al.2014),CraNS (Bresnahan et al.2018),IC 5146 (Arzoumanian et al.2019),Lup I,Lup III,Lup IV(Rygl et al.2013),Musca(Cox et al.2016),ρ Oph(Roy et al.2014),Orion B(Könyves et al.2020),Orion A(S.Jiao et al.2022,in preparation),Perseus(Pezzuto et al.2012),Pipe(Peretto et al.2012),Polaris (André et al.2010),Taurus (Arzoumanian et al.2019) and Serpens (Fiorellino et al.2021).
2.2.Deriving Dust Temperature and Column Density Based on SED Fitting
The dust temperature and column density map toward 22 of 23 regions were downloaded from the HGBS Archive.11The website of HGBS Archive:http://www.herschel.fr/cea/gouldbelt/en/index.php.We obtained dust distribution and improved the image quality of the Orion A region,based on a novel image combination technique(S.Jiao et al.2022,in preparation).12The column density and dust temperature of Orion A were not published on the website of HGBS archive by 2022.The procedure to derive the dust temperature and dust/gas column density images of Orion A is similar to that in Roy et al.(2014).Before performing any spectral energy distribution (SED) fitting,all images at multiple bands were convolved into a beam size of 363 at 500 μm.We weighted the data points by the measured noise level in the least-squares fits.We adopted the dust opacity per unit mass at 300 μm of 0.1 cm2g−2(Hildebrand1983),and assumed a gas-to-dust mass ratio of 100.As a modified blackbody assumption,the flux densitySνat a certain observing frequency ν is given by

whereBν(Td)is the Planck function at temperatureTdand Ωmis the beam size.The total column densityNof gas and dust can be approximated by

where the dust opacity κλ=κ300μm(λ/300 μm)β(β was fixed to a constant value of 1.8),μ=2.8 is the mean molecular weight andmHis the mass of a hydrogen atom.The graybody dust temperature (Td) thus calculated has ignored the dependence of dust temperature on grain size (Li et al.1999),but has been shown to be within a couple of kelvins of the gas temperatures in well coupled regions(Goldsmith2001;Li et al.2013;Wang et al.2020;Xie et al.2021).The effect of scattering opacity (e.g.,Liu2019) can be safely ignored in the case focusing on >0.05 pc scale structures.
2.3.Star Formation Rates
The SFRs were determined through SFR=N(YSO)〈M〉т−1,in whichN(YSO) is the YSO number in the molecular region,〈M〉 is the mean mass of stars and т is the relevant evolution timescale.
The identification of YSOs requires careful discrimination against background stars and galaxies.Star-forming galaxies were the most problematic source of contaminants.A combination of color–color and color–magnitude diagrams of both Spitzer and 2MASS data was adopted to reject contaminants.The detailed descriptions of this process are provided in Evans et al.(2009).Dunham et al.(2013)provide a YSO catalog for Gould Belt clouds.To convert number of YSOs to mass of forming stars,Evans et al.(2014) adopted mean mass of starsM⋆=0.5M⊙,based on a fully sampled initial mass function (IMF) (Kroupa2002).The relevant timescales were derived by classifying YSOs into standard SED classes based on 2 to 24 μm data.
Table1lists the SFRs (Lada et al.2010;Evans et al.2014)we adopted in this paper.

Table 1Star Formation Rate of 15 Molecular Regions
3.Method
3.1.The DUSTY Code
The public DUSTY code (Ivezic &Elitzur1997) solves the radiative transfer problems through a fully scale-free method.By adopting this scaling method,the DUSTY code solves the spherically symmetric (1-D) problem with a single central radiation source and surrounding spherically symmetric dusty envelope,in which the radial dust density profile is arbitrary.In addition,a dusty plane-parallel slab with illumination from one or both sides at an arbitrary angle is also available.
This code utilizes the scaling properties to minimize the number of input parameters.Parameters describing the external radiation,dust and gas properties,and cloud geometry are needed for inputs.For the case of spherical geometry,they include number,spectral shape and flux of the external source,chemical composition of dust,the lower and upper limits of dust optical depth,and density distribution of dust.For the case of slab geometry,an extra selection of source side is needed.
Once the input parameters are chosen,the DUSTY code outputs the value of dust temperature as a function of gas optical depth.
3.2.Parameter Setting in DUSTY Code
We adopted the slab geometry for our calculations.The incident angle between UV radiation and the slab,θ,is treated as 0 degree,θ=0°,indicating perpendicular UV radiation toward the slab.The selected radiation wavelength of 0.365 μm is located in the central wavelength of the UV band.The dust sublimation temperature,which is the highest temperature at which the dust grains can exist,is chosen to be the common value of 1500 K.The value ranges of gas optical depth and dust temperature are chosen as [0,30] and [0,50] K,respectively.
With the above selections,the UV radiation intensity,G0is the only parameter that determines the relationship between dust temperature and gas optical depth.As for the optional UV radiation flux received by one side of the slab,six sets of UV intensity(G0=1,10,31.6,100,316,and 1000)compared to a standard Habing field (e.g.,Hughes et al.2017) of 1.6×10⁻⁶W m−2are introduced for calculation.
3.3.Distribution of UV Intensity Field
In order to produce the spatial distribution of UV radiation field of the Gould Belt,we combined the DUSTY model calculations and the HGBS data.
The derived H2column density and dust temperature map of HGBS molecular complexes with pixel size of 3″ were convolved and re-sampled with the beam size of 363 at 500 μm.We are focusing on dense molecular regions,and the contribution from atomic hydrogen can be ignored.Thus the H2column density was converted into gas optical depth atVband through the following equation (Bohlin et al.1978;Greenberg1968;Rachford et al.2009)

As an example,the derived relationship betweenTdustand gas optical depth (тV) of all pixels for the ρ Oph cloud can be found in Figure1.We obtained the UV intensity of each pixel by interpolating the results from observations with those from DUSTY model calculations.The spatial distribution of the specific UV radiation field of each HGBS molecular complex can be derived.
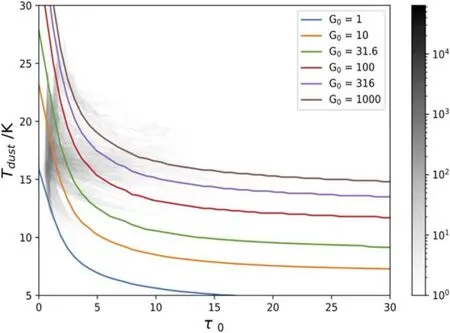
Figure 1.Relationship between dust temperature and optical depth.Results for the observed ρ Oph data are shown with gray points.Solid colored lines represent model calculations from the DUSTY code with different UV intensity values,G0.
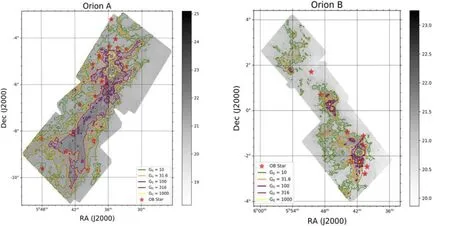
Figure 2.Contours of UV intensity overlaid on H2 column density map of the Orion A(left panel) and Orion B (right panel)regions.The column density N(H2) is shown with log10 N(H2) value.The red star implies the location of an OB star in this region.
4.Results
After applying the procedures described in Section3,we obtained the UV intensity distribution of 23 regions in 14 molecular complexes of the Gould Belt.
4.1.Spatial Distribution of UV Intensity
As an example,we present the spatial distribution of selected UV intensity (G0=1,10,31.6,100,316 and 1000) for three molecular complexes:Orion(Category I),Aquila(Category II)and Polaris(Category III).Descriptions of the other complexes are presented in Appendix.
4.1.1.Orion
The Orion molecular complex is the most active star-forming region within 500 pc(Megeath et al.2012).Orion A and Orion B molecular clouds are covered by HGBS.Located in Orion A,the Orion Nebula cluster is a significant laboratory for understanding the IMF.The Orion B molecular cloud is one of the clouds scattered along the region named Orion-Eridanus superbubble,which was created by supernova explosions(Könyves et al.2020).The Orion B cloud is ∼423 pc away and covers an area of ∼6.8×8.6 deg2(Evans et al.2014).The total mass of these two molecular clouds exceeds 2×10⁵M⊙(Megeath et al.2012).
As affirmed in Figure2,the UV intensity of these two regions displays a tight correlation with the OB stars.
4.1.2.Aquila
The Aquila field is a very active star-forming region at a distance of about 260 pc (Evans et al.2014).With size of∼7.56 pc,the mass of this molecular complex is about 24 446M⊙,of which two-thirds is composed of dense cores(Evans et al.2014).The existence of a dense cloud leads to the highest level of background cloud emission in HGBS.A cluster of YSOs but no OB stars was detected in this region.The number of YSOs in this region exceeds 1000.
As shown in Figure3,the intensity of the radiation field distribution varies fromG0=1 toG0=1000.We found a certain correlation between the spatial distribution of YSOs and UV radiation field.The possible reason responsible for this is discussed in Section5.
4.1.3.Polaris
The Polaris Flare has a distance of about 352 pc and total mass of about 5500M⊙(Zucker et al.2019).It is a high-latitude translucent cloud with little or no obvious star formation activity.It is expected to have the lowest level of background cloud emission (Heithausen &Thaddeus1990).Neither OB stars nor YSOs were detected in this region.As depicted in Figure4,the UV intensityG0of almost the whole region is smaller than 10.
4.2.UV Intensity vs. N(H2)
We present a statistical result between UV intensityG0and peak H2column densityN(H2) of each molecular cloud in Figure5.The correlation betweenG0andN(H2) can be fitted with a linear function of

Figure 3.Contours of UV intensity overlaid on H2 column density map of the Aquila molecular complex.The column density N(H2) is shown with log10 N(H2) value.The cyan dots represent the locations of YSOs.

Figure 4.Contours of UV intensity overlaid on H2 column density map of the Polaris region.The labels of the figure are the same as those in Figure 3.No YSOs or OB stars were found in this region.

Figure 5.The relationship between UV intensity G0 and peak H2 column density N(H2).Filled stars,triangles and circles represent categories I,II and III,respectively.The blue solid line corresponds to a linear fit of all clouds.The red solid line signifies a linear fit when Orion A is excluded.

Figure 6.The relationship between total UV flux and SFR in 15 molecular clouds including Lupus,Corona Australis,Pipe,Musca,ρ Oph,Perseus,Aquila,Orion A,Orion B,Serpens,IC 5146 and Chamaeleon.The blue line indicates the formula in Equation (6).Regions with massive OB stars fit the blue line better than regions with YSOs.

for all complexes.It becomes

when Orion A was not included.
5.Discussion
In this paper,we obtained the distribution of UV radiation field toward 23 regions of 14 molecular complexes in the Gould Belt through dust radiative analysis.
5.1.Uncertainty Analysis
The main assumption of such analysis is that the heating of dust was mainly due to UV radiation from massive stars.This has been demonstrated to be valid in the presence of massive stars,particularly OB clusters (e.g.,Li et al.1999,2003).In more quiescent regions,however,dynamic feedback through outflows and bubbles from low-mass stars have proven to be capable of sustaining the turbulence in,e.g.,Taurus (Li et al.2015),which thus presumably may result in some dust heating.However,even supposing the gas and dust are closely coupled,there is no sign of elevated temperatures close to low-mass YSOs in Taurus (Goldsmith et al.2008).We thus consider the heating of dust from low-mass YSOs to be minor.
In testing the model,we find that the incident angle more strongly affects absolute value of the derived UV field,rather than its distribution.To obtain robust results for the Gould belt sample in a systematic way,we set the incident angle to zero.Further investigation of the individual radiation geometry is warranted.
5.2.Compare with Star Formation Rate
We obtain the total UV fluxes in Aquila,Cham I,Cham II,Cham III,IC 5146,Lupus III,Lupus IV,Serpens,Musca,ρ Oph,Orion A,Orion B,Pipe,Perseus and Taurus by adding up the DUSTY outputs for each region and comparing them with the SFR in Lada et al.(2010),Evans et al.(2014).
UV emission is a direct tracer of the recent SFR since it traces the photospheric emission of young stars.The investigation of SFR of extragalaxies has been revolutionized with observations by the Galaxy Evolution Explorer (GALEX)telescope (Martin et al.2005).By combining the UV data and IMF,the relationship between SFR and UV luminosity (Hao et al.2011;Kennicutt &Evans2012) can be described as

The relationship between UV intensity and SFR for 15 molecular regions of the Gould Belt is presented in Figure6.The blue line signifies the correlation between UV flux by OB stars and SFR.The correlation conforms to the general expectation.Regions with prominent OB clusters tend to be more consistent with the expectation.The scatter is bigger where there is no OB star.Different regions in the same molecular cloud tend to have similar UV fields,but different SFR.The less massive YSOs seem to have little effect on the UV distribution.
6.Summary
By interpreting dust continuum data through radiative transfer analysis,we obtained the UV intensity distribution toward 23 molecular regions in the Gould Belt.The main results of this study are summarized as follows,
1.The UV intensityG0of molecular clouds ranges from 1 to over 1000,relative to the Habing interstellar field.
2.The UV distribution in the majority of the molecular regions shows a tight correlation with that of OB stars and/or YSOs.
3.The UV intensity of 10 molecular regions conforms to an expected linear correlation with the SFR.
Acknowledgments
This work is supported by the National Natural Science Foundation of China(NSFC,Grant Nos.11988101,11725313,11721303 and U1731238),the International Partnership Program of Chinese Academy of Sciences grant No.114A11KYSB20160008,the National Key R&D Program of China No.2016YFA0400702,Q.-J.Z.is supproted by the Guizhou Provincial Science and Technology Foundation(Nos.[2016]4008,[2017]5726-37,) and the Foundation of Guizhou Provincial Education Department (No.KY (2020) 003).This research was carried out in part at the Jet Propulsion Laboratory,California Institute of Technology,under contract with the National Aeronautics and Space Administration.This research made use of APLPY,an open-source plotting package for Python (Robitaille &Bressert2012).
Appendix
UV Distribution of the Gould Belt Complexes
A.1.Cepheus
Located at a high decl.,the Cepheus molecular complex includes many regions that have loose association with compact dark clouds.HGBS contains five regions in the Cepheus molecular complex,Cep 1157 (FigureA1) (also known as L1157,the same below),Cep 1172 (FigureA2),Cep 1228(FigureA3),Cep 1241 (FigureA4) and Cep 1251 (FigureA5).The distances of the five regions are considered to be 200–300 pc.The masses of L1157,L1172,L1228,L1241 and L1251 are 1400M⊙,1900M⊙,1600M⊙,3200M⊙and 1800M⊙(Di Francesco et al.2020).L1172 is the host of the bright NGC 7023 reflection nebula,which contains the bright B star HD 200775 in these five regions.L1241 and L1251 lie within the Cepheus Flare Shell.L1241 is the only one region without YSOs nor OB star.Some YSOs are found in L1251.The L1228 is located at the edge of the Cepheus Flare Shell,while L1157 and L1172 are located outside of the Cepheus Flare Shell.

Figure A1.Contours of UV intensity overlaid on H2 column density map of the L1157 region.The labels of the figure are the same as those in Figure 3.
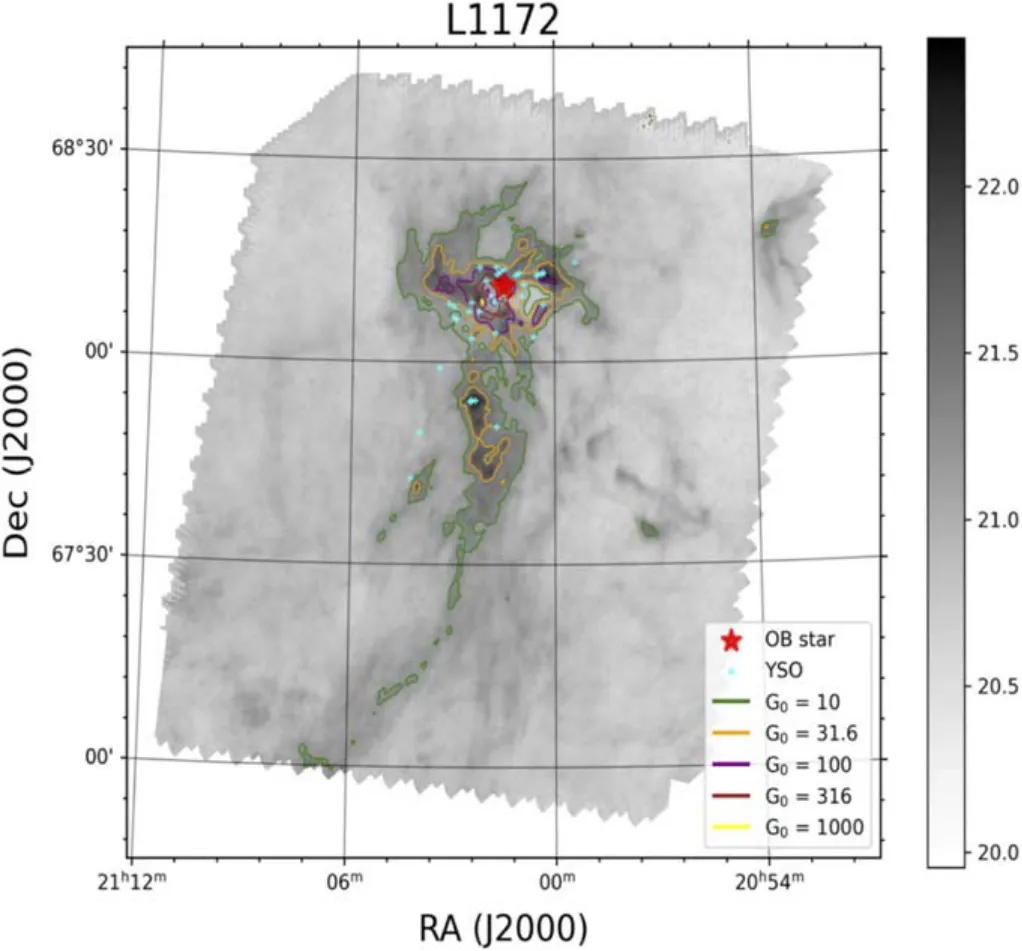
Figure A2.Contours of UV intensity overlaid on H2 column density map of the L1172 region.The labels in the figure are the same as those in Figure 3.The red star implies the location of an OB star in this region.

Figure A3.Contours of UV intensity overlaid on H2 column density map of the L1228 region.The labels in the figure are the same as those in Figure 3.

Figure A4.Contours of UV intensity overlaid on H2 column density map of the L1241 region.The labels in the figure are the same as those in Figure 3.There are neither YSOs nor an OB star in this region.

Figure A5.Contours of UV intensity overlaid on H2 column density map of the L1251 region.The labels in the figure are the same as those in Figure 3.

Figure A6.Contours of UV intensity overlaid on H2 column density map of the Cham I region.The labels of the figure are the same as those in Figure A2.
The radiation field distribution of these five regions is quite different depending on the existence of massive stars and YSOs.As demonstrated in FigureA2,the UV intensity of L1172 around HD 200775 can exceed 1000G0.For the L1157(FigureA1),L1228 (FigureA3) and L1251 (FigureA5)regions,obvious higher UV intensity can be found around the YSOs.The UV intensity in L1241 is smaller than 31.6G0as there are neither massive stars nor YSOs in this region.

Figure A7.Contours of UV intensity overlaid on H2 column density map of the Cham II region.The labels of the figure are the same as those in Figure 3.
A.2.Chamaeleon
Chamaeleon is a nearby low-mass star-forming region containing Cham I,Cham II and Cham III.The distance from the regions in Chamaeleon is about 150 pc(Evans et al.2014).The entire Cham I region covers an area about 5 deg2,containing about 200 known low-mass YSOs,making it one of the closest and richest star-forming regions.The total mass of this cloud is about 482M⊙,one third of which is dense gas(Evans et al.2014).Though there is abundant low-mass YSOs in Cham I,there is only one B star: HD 97300 in the northern part of the cloud (Winston et al.2012).
The Cham II region contains a smaller number (∼60) of YSOs compared to the Cha I region.The size of Cham II is about 1.78 pc.The total mass of Cham II is about 637M⊙while one-tenth is dense gas.As the largest cloud among the three regions with a total mass of 746M⊙,Cham III contains little dense gas and only a few YSOs (Alves de Oliveira et al.2014).
Due to the differences in containing YSOs and dense gas,the UV intensity distributions of Cham I,Cham II and Cham III are expected to vary significantly.As shown in FiguresA6,A7andA8,the maximum UV intensity value decreases from Cham I to Cham III,which is proportional with the existence of OB stars.
A.3.CraNS
With distance of around 130 pc and being out of the Galactic plane,the CraNS (Corona Australis) molecular cloud is a lowmass star-forming region.The total mass of this region is about 279M⊙,half of which is dense gas(Evans et al.2014).There is an OB star (V*R CrA) and a cluster of YSOs in this region(Bresnahan et al.2018).As affirmed in FigureA9,the derived UV intensityG0around the OB star can exceed 1000.
A.4.IC 5146
With a distance of ∼460 pc,the IC 5146 region covers an area of ∼3.1×2.5 deg2.The total mass of this cloud is about 3.7×10³M⊙(Arzoumanian et al.2019).There is little dense gas and not an OB star in this region (Evans et al.2014).Abundant YSOs exist in this region.We present UV intensity distribution for IC 5146 in FigureA10.The UV intensityG0can reach 31.6 around the YSOs.

Figure A8.Contours of UV intensity overlaid on H2 column density map of the Cham III region.The labels of the figure are the same as those in Figure 3.

Figure A9.Contours of UV intensity overlaid on H2 column density map of the CraNS region.The labels of the figure are the same as those in Figure 3.

Figure A10.Contours of UV intensity overlaid on H2 column density map of the IC 5146 region.The labels of the figure are the same as those in Figure 3.

Figure A11.Contours of UV intensity overlaid on H2 column density map of the Lupus I region.The labels in the figure are the same as those in Figure 3.
A.5.Lupus
The distance of the Lupus molecular complex is about 189 pc(Zucker et al.2019).The HGBS surveyed three clouds in this complex:the Lupus I,Lupus III and Lupus IV clouds.Among the three clouds,the Lupus I cloud is the youngest.The mass of Lupus I is about 512M⊙.Lup III is the most evolved cloud with a mass of ∼912M⊙.The Lupus IV cloud has a middle property between the Lupus I and III clouds.The mass of dense gas in the Lupus IV cloud is 50M⊙,accounting for about one quarter of the cloud mass(Evans et al.2014).These three clouds contain YSOs but there are no massive stars inside.
As shown in FiguresA11,A12andA13,the UV intensity distribution correlates with the existence of YSOs.
A.6.Musca
With distance of ∼200 pc,the Musca cloud is a 10.5 pc long filament with low-mass star formation(Cox et al.2016).The mass of the Musca molecular cloud is about 335M⊙(Evans et al.2014).There are no massive stars in this region.As is clear from FigureA14,UV intensity increases in some dense regions.
A.7.ρOph
With distance of 125 pc (Evans et al.2014),the ρ Oph molecular cloud is one of the most conspicuous nearby regions where low and intermediate-mass star formation is taking place.The total mass of the ρ Oph cloud is about 3128M⊙,one third of which is dense gas.The ρ Oph cloud consists of two massive,centrally condensed cores,L1688 and L1689 (Loren1989).Being different from L1689 with little star formation activity,L1688 harbors a rich cluster of YSOs at various evolutionary stages and is distinguished by high star formation efficiency (Wilking &Lada1983).Two OB stars(HD 147 889 and ρ Oph A) are found in this region.
The UV radiation distribution of the ρ Oph cloud is depicted in FigureA15.A strong correlation between UV intensity and star distribution was found.The UV intensityG0can exceed 1000 in a dense gas region and regions around OB stars.
A.8.Perseus
The Perseus molecular cloud is ∼250 pc away with sky coverage of ∼10 deg2.It is a low and intermediate-mass starforming region.The total mass of the Perseus molecular cloud is about 6586M⊙,one third of which is dense gas(Evans et al.2014).As demonstrated in FigureA16,the UV radiation field correlates with the locations of OB stars and YSOs in this region.

Figure A13.Contours of UV intensity overlaid on H2 column density map of the Lupus IV region.The labels in the figure are the same as those in Figure 3.

Figure A14.Contours of UV intensity overlaid on an H2 column density map of the Musca region.The labels of the figure are the same as those in Figure 3.

Figure A15.Contours of UV intensity overlaid on an H2 column density map of the ρ Oph region.The labels in the figure are the same as those in Figure A2.

Figure A16.Contours of UV intensity overlaid on an H2 column density map of the Perseus region.The labels in the figure are the same as those in Figure A2.
A.9.Pipe
The Pipe Nebula has a distance of ∼145 pc (Alves &Franco2007).Composed of an elongated dark cloud with length of 18 pc,the Pipe Nebula is one of the closest starforming regions.The Pipe Nebula is an ideal target for investigating core formation.The mass of the Pipe Nebula is about 1.7×10⁴M⊙(Lombardi et al.2006).A few identified YSOs were found in this region (Peretto et al.2012).As affirmed in FigureA17,the UV intensity is very low (G0<31.6) toward most regions in this molecular complex.
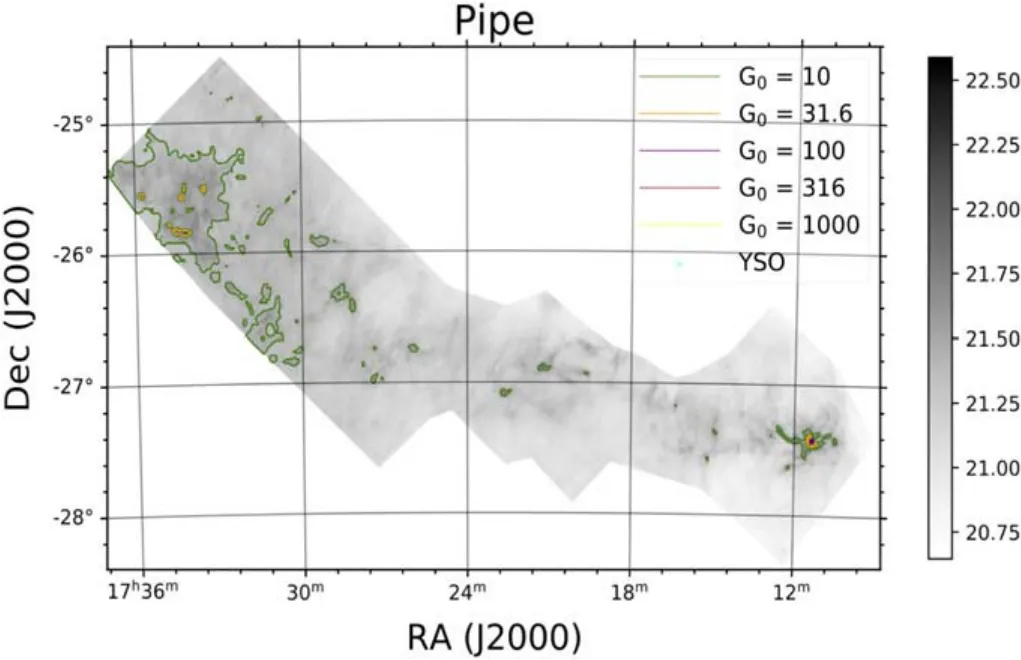
Figure A17.Contours of UV intensity overlaid on the H2 column density map of the Pipe region.The labels in the figure are the same as those in Figure 3.
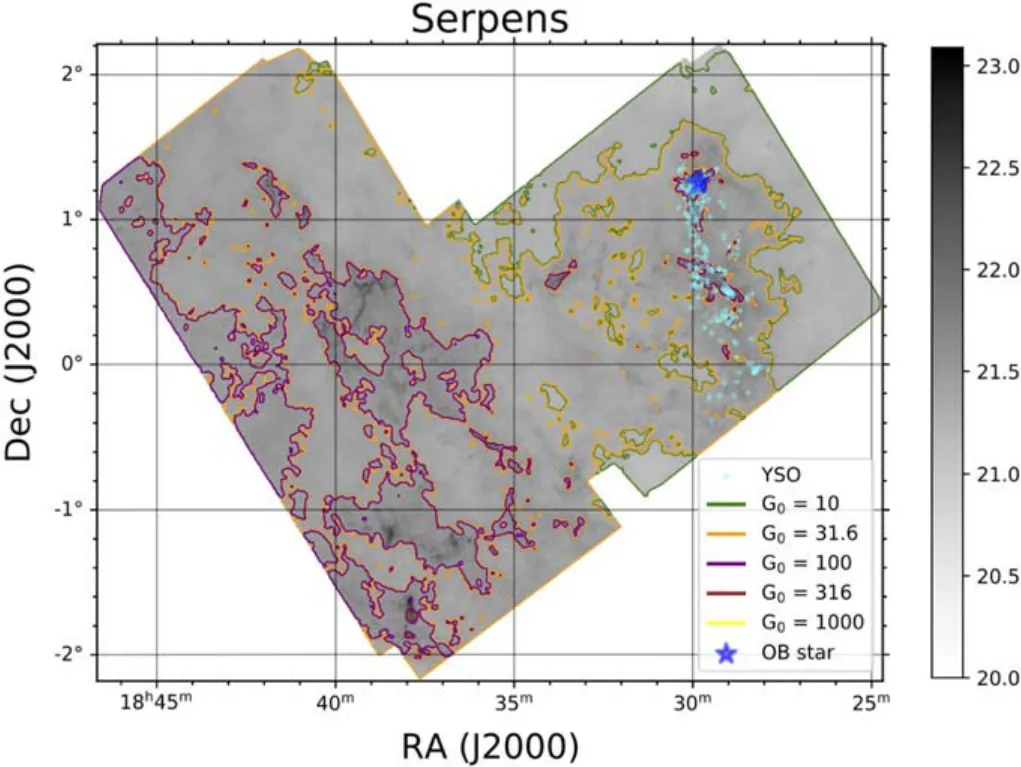
Figure A18.Contours of UV intensity overlaid on an H2 column density map of the Serpens region.The labels in the figure are the same as those in Figure A2.
A.10.Serpens
The Serpens star-forming region located at ∼429 pc was covered ∼15 deg2by HGBS(Evans et al.2014).Its total mass is ∼6583M⊙,two-thirds of which is dense gas (Evans et al.2014).About 81% of the prestellar cores are found in the filamentary structure of Serpens (Fiorellino et al.2021).Serpens is confirmed to be a low-mass and active star-forming region at a young age.As shown in FigureA18,lots of YSOs and an OB star are found in this region.

Figure A19.Contours of UV intensity overlaid on an H2 column density map of the Taurus region.The labels in the figure are the same as those in Figure 3.
A.11.Taurus
The distance of the Taurus cloud to our solar system is about 140 pc (Palmeirim et al.2013).The total mass of the Taurus molecular cloud is about 2–4×10⁴M⊙,ten percent of which is dense gas(Evans et al.2014).HGBS covered about 52 deg2of this region (Kirk et al.2013).No OB stars were found in the Taurus molecular cloud.As verified in FigureA19,the UV radiation intensity correlates with the distribution of dense gas.
ORCID iDs
杂志排行
Research in Astronomy and Astrophysics的其它文章
- A Baseline Correction Algorithm for FAST
- Ultra-wide Bandwidth Observations of 19 Pulsars with Parkes Telescope
- Correlation between Brightness Variability and Spectral Index Variability for Fermi Blazars
- Candidate Eclipsing Binary Systems with a δ Scuti Star in Northern TESS Field
- HI Vertical Structure of Nearby Edge-on Galaxies from CHANG-ES
- Analyzing Dominant 13.5 and 27day Periods of Solar Terrestrial Interaction:A New Insight into Solar Cycle Activities
