Diffuse Interstellar Bands λ6379,λ6614,and λ6660 in the LAMOST-MRS Spectra
2022-09-02KeFeiWuALiLuoJianJunChenWenHouandYongHengZhao
Ke-Fei WuA-Li LuoJian-Jun ChenWen Houand Yong-Heng Zhao
1 CAS Key Laboratory of Optical Astronomy,National Astronomical Observatories,Chinese Academy of Sciences,Beijing 100101,China; lal@nao.cas.cn
2 School of Astronomy and Space Science,University of Chinese Academy of Sciences,Beijing 100049,China
3 School of Information Management &Institute for Astronomical Science,Dezhou University,Dezhou 253023,China
Abstract Diffuse interstellar bands (DIBs)have always been a mysterious existence in astronomical research.In this work,we provide more DIB samples to slightly uncover this mystery.With the LAMOST medium-resolution survey(MRS) spectra,we detected three DIBs λ6379,λ6614,and λ6660,obviously superimposed on the spectra of 11,003 stars.These spectra cover spectral types from O to K,which can provide a large number of candidates for further research on DIBs.The sample shows a clear positive correlation between the strength of DIBs and extinction,which agrees with the result in the literature.In addition,there exist two peaks in each of the velocity distribution of these three DIBs,and the velocity differences between two peaks of each pair are consistent.The reason for the two velocity components is due to the Galactic rotation.
Key words: ISM: molecules–methods: data analysis–(ISM:) dust–extinction
1.Introduction
Diffuse interstellar bands (DIBs) are absorption features observed in the spectra of stars through significant column densities of interstellar material.They were first discovered in 1919 by Heger(Heger1922)and proved in 1938 by Merrill&Willson that DIBs originated from interstellar matter rather than stars (Merrill &Wilson1938).Over 100 yr since then,scientists have never stopped exploring DIBs,but the cause and mechanism of their existence were and are still a mystery.Where do the mysterious and ubiquitous DIBs come from?What made them? What phenomena in the universe are they related to? How do they distribute in the universe? The uniqueness of DIBs research lies in the following three aspects:
First,a large number of DIBs have been detected from optical to NIR.From 1960 to 1973,Herbig(1975)observed 39 possible diffuse bands lying between 4400 Å and 6850 Å in spectra of early-type stars and successfully detected 24 DIBs.Sanner et al.(1978) detected several DIBs in the wavelength region between 6500 Å and 8900 Å.Hobbs et al.(2008,2009)conducted typical detections of DIBs,which includes 414 DIBs in the optical band of HD183143 and 380 DIBs in HD204827 with the full width at half maximum (FWHM) ranging from 0.55 Å to 30 Å.By observing 25 stars since 1999,Fan et al.(2019) recently presented 559 DIB features in the wavelength band between 4000 Å and 9000 Å.Joblin et al.(1990)found two new DIBS is around 11,800 Å and 13,200 Å.Herbig (1995) reviewed 127 confirmed DIBs in the region between 4000 Å and about 1.3 μm.Cox et al.(2014) confirmed nine near-infrared DIBs using the VLT/X-Shooter survey.Galazutdinov et al.(2017) presented high-resolution (R∼45,000) profiles of 14 DIBs within the range from 1.45 to 2.45 μm.To date,over 600 DIBs in total have been detected,and more discoveries are to come with the development of instruments.
Second,DIBs are widely distributed in the universe,not only in the Milky Way,but also in extragalactic galaxies,and even in the circumstellar dust disks.Walker (1963) first explored the DIB λ4430 Å in LMC and SMC.Later on DIBs were discovered in other extragalactic galaxies (Junkkarinen et al.2004;York et al.2006;Prochaska et al.2007;Puspitarini et al.2019).Monreal-Ibero et al.(2018) then reviewed and compared DIBs between different galaxies.In addition to stars and galaxies,studies have shown that DIBs are considered to exist in the circumstellar region,i.e.,the diffuse circumstellar bands(DCBs).Cohen&Jones(1987)reported the detection of five DIBs which should be of circumstellar origin,while Le Bertre &Lequeux(1992)questioned the circumstellar origin of these diffuse bands.The DIBs of nebulae have been constantly being explored(Zasowski et al.2015).
Third,the components of DIBs are complex.Herbig &Leka(1991) discussed the possibility of interstellar particles as DIB carriers and asserted that DIBs might have multiple carriers.Herbig(1995)believed that the carrier of DIBs might be a macromolecular substance.For the next two decades,this possibility was speculated about by using a variety of macromolecules but remained inconclusive.Until recent years,a form of Fullerenes,C60+is the first and only identified DIB carrier in the near-infrared band(Campbell et al.2015;Campbell &Maier2018;Lallement et al.2018;Cordiner et al.2019).So far,however,most of the carriers of DIB features have not been confirmed.It is still doubtful PAHs and Carbon chain molecules are carriers of DIBs.Draine &Li(2007) believed that although many studies have suggested that PAHs are widespread in interstellar space,no specific PAHs molecule has been detected.
Most typical DIB research mentioned above focuses on high-resolution and high signal-to-noise ratio (S/N) spectra with small samples limited to about hundreds.For example,Fan et al.(2017) used only 186 spectra as their sample.With the development of the sky survey projects,more and more DIBs have been found in low-and medium-resolution spectra,and most of them are FGK-type rather than early-type.Yuan&Liu(2012)successfully detected DIB λ5780 and DIB λ6283 in about 2000 SDSS spectra(Abazajian et al.2009;Alam et al.2015),verifying the possibility of low-resolution spectra with all spectral types from A to K in DIB research.Lan et al.(2015);Baron et al.(2015a,2015b),and Elyajouri et al.(2017)also used the late-type spectra from the sky surveys of SDSS(Ahn et al.2012) and APOGEE (Alam et al.2015) to conduct DIB research.We know that the spectra of late-type stars contain much more absorption lines than those of early-type stars,inevitably contaminating DIB features (Kos et al.2013).It is necessary to eliminate the effect of absorption lines of the stars before DIB measurements.For high-resolution spectra,theoretical templates with the same atmospheric parameters can be matched to the stellar spectra with DIB overlaid,and the stellar components given by templates will then be removed from the observed spectrum (Puspitarini et al.2015).For lowresolution spectra,Yuan &Liu (2012) developed a template matching method for measuring DIBs in low-resolution spectra of late-type stars.We used a similar approach in the LAMOST MRS spectra and described at length in the following sections.
LAMOST MRS spectra have a resolution of R ∼7500,and their wavelength range covers many DIBs,including three obvious ones,i.e.,DIB λ6379,DIB λ6614,and DIB λ6614.All these three DIBs were discovered in very early studies(Herbig1975),among which DIB λ6614 is one of the earliest discovered DIBs (Merrill1930;Merrill &Wilson1938),and also the most frequently concerned DIB in current research.Fan et al.(2019)found its 100%existence in their DIB spectra.At times,DIB λ6614 was investigated in cold stellar spectra(Destree et al.2007).Sonnentrucker et al.(1997) concluded that the carriers of the DIB λ6614 may be large gaseous molecular because of their ionization properties,while Thorburn et al.(2003) found it is not aC2DIB.Their equivalent widths (EW) are uncorrelated or weakly anticorrelated withN(C2)/E(B−V).In addition,the study of DIB λ6379 and DIB λ6614 has been conducted in the extragalactic galaxy M31/M33 (Cordiner et al.2011).These previous studies provide comparison references for the DIBs detected in LAMOST MRS spectra.
The outline of this paper is as follows.Section2presents the data set we used and relevant data reduction.Section3introducesthe detection process and final results of DIBs in the LAMOST DR7 MRS.Section4analyzes the discovered DIBs.Finally,Section5gives the discussion and prospect of research.
2.Data
2.1.The LAMOST Spectra
LAMOST launched its Phase II survey in September 2017.Unlike Phase I(Luo et al.2015),half of the observation time in each month of the Phase II survey is assigned to the mediumresolution spectroscopic (MRS,R∼7500) survey,i.e.,from the 7th to 23rd of each month in the lunar calendar.For the rest half time,the low-resolution (R∼1800) regular survey,same as in Phase I,is continued.The LAMOST MRS spectral survey covers 4900 Å–5400 Å in the blue band and 6300 Å–6800 Å in the red band,and produces more than one million mediumresolution spectra every year.Such an extensive database of medium-resolution spectra facilitates us to resolve and study the narrow band features of the DIB in spectra with a broad effective temperature range covering from O-to K-type stars,which will essentially increase the DIB samples.
2.2.The Initial Data Sample
From LAMOST DR7 MRS data,we selected about 731,757 spectra of 474,093 individual stars with an S/N greater than 30.This data set includes 664,565 FGK-type spectra of 406,901 stars that have stellar parameters released and 67,192 early-type spectra of 31,628 stars without stellar parameters released.Thus,we directly extracted DIB features from early-type spectra,while for FGK-type stars we had to extract them from the spectra with stellar component subtracted.The detail of the initial sample can be found in Sections3.2and3.3for earlytype and FGK-type stars respectively.
From the initial sample,we calculated the EW of the three DIBs,and removal the spectra with EW<0.05 Å.Then we manually checked the fitting of DIB λ6614 which is the most strong one among the three,and removal spectra with bad fittings through checking the central wavelength,line width and depth.Finally,for each star,we removed duplicate spectra and only kept the one with the highest S/N.
2.3.Data Pre-processing
We uniformly pre-processed all the spectra with an S/N greater than 30.
1.Cut each spectrum in the wavelength window 6330 Å-6830 Å,and the negative or abnormal flux points are screened using the “pixel mask” in the FITS file of the spectrum;
2.According to the radial velocity (RV) value rv_r0(km s−1),calculated using red arm of LAMOST MRS spectra,shift them back to the rest frame;
3.Rebin each spectrum to 3006 data points with wavelength step 1/6 Å by linear interpolation.LAMOST MRS spectra are oversampling concerning resolution.It should be explained that one pixel in the red arm is about 0.1375 Å,and one resolution element is around 1 Å.Thus,an element can be sampled by five to nine pixels.4.Finally,the spectra are normalized as follows: (1) find and remove the strong lines in the spectra in three DIB regions.(2) Fit a 6th-order polynomial iteratively using the least-squares method,removing the points outside one sigma in each iteration and repeating ten times.Then,the fitted polynomials are the pseudo continua.(3)Divide the spectra by the polynomials.
3.DIB Detection
3.1.Three Most Obvious DIB Features
There are 32 DIB features in the blue band of LAMOST MRS by checking the list of Hobbs et al.(2008).These DIB features are weak with the largest EW of only 35m and do not appear frequently (Fan et al.2019).In addition,the spectra in this wavelength range have more absorption lines from stars,such as a large number of FeI absorption lines.Therefore,in this study,the blue band information of LAMOST MRS spectra is temporarily ignored,and we only focus on the red band,which includes a total of 102 DIB features by checking the list of Hobbs et al.(2008) as well.
Among the DIBs in the red band,we measured three most prominent features,i.e.,λ6614 Å,λ6379 Å,and λ6660 Å,which are named along with the wavelength in the air.According to the conversion formula of Morton (1991),

where σ=104/λair,with λairin angstroms.The wavelengths of the three features are λ6615.3–6615.6 Å,λ6380.9–6381.3 Å,and λ6662.4–6662.6 Å in the vacuum,respectively,and the central wavelengths refers to Hobbs et al.(2008).The three DIBs have high probabilities of being explored in the spectra of DIBs(respectively 92%,100%,96%)(Fan et al.2019).Table1gives the information of the three DIBs from Fan et al.(2019).Among the three features,λ6614 Å is the most important one,which is at λ6613.62±0.1 Å in air wavelength.The EW of DIB λ6614 Å is greater than 150 m Å,and the full width at half maximum (FWHM) is around 1 Å at a resolving powerR=38,000 (Hobbs et al.2008,2009).

Table 1The Information of the Three DIBs from Fan et al.(2019)

Table 2The Number of DIB Detection and FGK Stars in the Initial Sample with Different [Fe/H]
In this work,the FGK-type spectra having released stellar parameters and early-type spectra without released stellar parameters were handled separately.The DIB features in earlytype spectra are more obvious,and the stellar component has little effect on the detection of DIBs,seen in Figure1.So the DIB features can be extracted directly after spectral preprocessing.On the other hand,FGK stars with stellar parameters were released in DR7,among which the spectra without DIB features can be used as reference templates under the corresponding parameters.Thus,the interference of absorption lines of the stars can be removed by template subtraction,then DIB features will be traced.
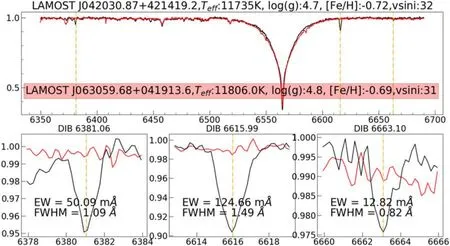
Figure 1.The figure shows two hot stellar spectra with effective temperatures of about 11,735 K and 11,806 K,and the temperatures are from Guo et al.(2021).The black one is DIBs imposed,while the red one is a clear B-type star.The upper panel shows the whole band of the two LAMOST MRS red band spectra,and the lower panels show zoomed windows where the three DIBs are located.

Figure 2.DIB absorptions in two normalized spectra,an A-type spectrum in the left panel and a B-type spectrum in the right panel.The A-type spectrum is of an A2 star according to SIMBAD,while the B-type one can be referred from Liu et al.(2019).The top parts of the two panels show the pre-processed spectra,and the small windows in the upper part show the LAMOST MRS original spectra.The lower parts show the fitting of the DIB features,in which the red curve is before normalization,the red straight line is the local continuum,the yellow curve is after local normalization,and the green one is the Gaussian fitted curve.
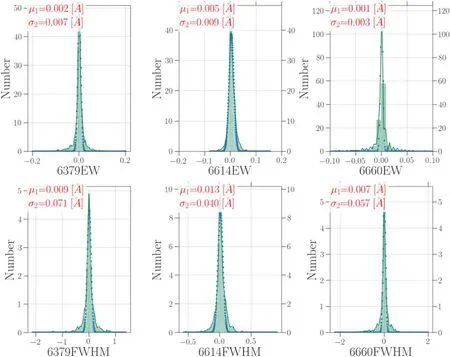
Figure 3.The comparison between vsini considered and not considered during the fitting,and we used 151,105 DIB measures to do the comparison.The three upper subplots are EW differences while the lower ones are those of FWHM.

Figure 4.Left: An example of the RV determination of a star through Gaussian fitting on 10 smallest chi-square points.The red dots are the 10 smallest chi-square values.The black curve is the Gaussian fitting to these 10 points,and the blue dot is peak of the Gaussian fitting,and its corresponding abscissa is the determined RV of the star.Middle: Comparison of the RVs of stars between our method and LAMOST DR7 released.Right: The systematic deviation and the scatter of RV comparison of the middle panel.
3.2.DIB Detection in Spectra of Early-Type Stars
The criterion for selecting early-type stars is that the difference ofgband magnitude minusrband magnitude is less than 0.2 mag4 https://classic.sdss.org/segue/targetsel.htmlwith extinction correction coefficients from Yuan et al.(2013),where the magnitudegandrcome from the star catalog of PANSTARS DR1.We also calculated stellar parameters for stars between 8500 K and 10,000K using the LASP(LAMOST stellar parameter pipeline).Besides these two selection,we crossed matched with the LAMOST OB star catalog of Guo et al.(2021)and supplemented 481MRS spectra of OB stars.Finally,the complete initial sample includes 67,192 early-type spectra.After measuring the EW and manually checking the succeed fitting of DIB λ6614,we removed bad fittings through checking the central wavelength,line width and depth.Finally,for each star,we removed duplicate spectra and only kept the one with the highest S/N.The average difference of the DIB EW varies small with different observation which will be described in Section3.3.3.We finally obtained 3452 early-type stars with distinct DIB features.Figure2shows the normalized spectra of two stars having DIBs,in which the line centers,the EW and the full width at half-maximum (FWHM) of three DIBs for each star are labeled.
Before measuring a DIB,we locally normalized the spectra because the global normalization described above preprocessing steps might have led to failure fittings.We selected two 1.0 Å sidebands outside of the central part for each of the three DIBs to fit the local continuum.For DIB λ6614,the central part is 2.6 Å(±1.3 Å from the wavelength of the peaks),while for the other two DIBs,the central part is 1.8 Å (±0.9 Å from the wavelength of the peaks),seen in Figure2.We then fitted the profile of each DIB with a Gaussian function and calculated the EW and FWHM from the parameter of the Gaussian function in the rest frame.The process is similar to Kos &Zwitter (2013) and Galazutdinov et al.(2008).
3.3.DIB Detection in FGK Spectra
3.3.1.Templates for Stellar Component Subtraction
It is necessary to deduct stellar components for late-type stars before measuring DIBs in the spectra containing DIBs and stellar ingredients.We chose stellar templates for FGK-type stars from released MRS spectra of LAMOST DR7,which meet three conditions: the S/N should be greater than 60,the extinction coefficients of the stars conform toE(B-V)<0.03(Schlegel et al.1998),and all of the stars should be located at high latitudes (b>30°).There are 66,448 stellar spectra meet the above conditions.We also took the stellar parameters of the templates from the catalog of LAMOST DR7.The ranges are in [3 100,8500]K,[0,5]dex,and [-2 .5,1]dex for Teff,logg,and [Fe/H] respectively.
The template subtraction was applied for a total of 664,565 spectra of 406,901 stars with parameters calculated by LASP.For each of the spectrum,we selected several templates from the 66,448 template spectra,which have similar parameters with the differences within 100 K,0.5 dex,0.2 dex and 7.5 km s−1for Teff,log g,[Fe/H],andvsinirespectively.It should be noted that some of the targets do not havevsinimeasurement because thevsinibelow 30 km s−1cannot be resolved by LAMOST.There are 151,105 spectra withvsini>30 km s−1.Figure3show the difference distribution betweenvsiniadded and non-added,and we can see the differences are small.All the selected templates for a spectrum were ranked with their SNR,and the top 100 were kept.
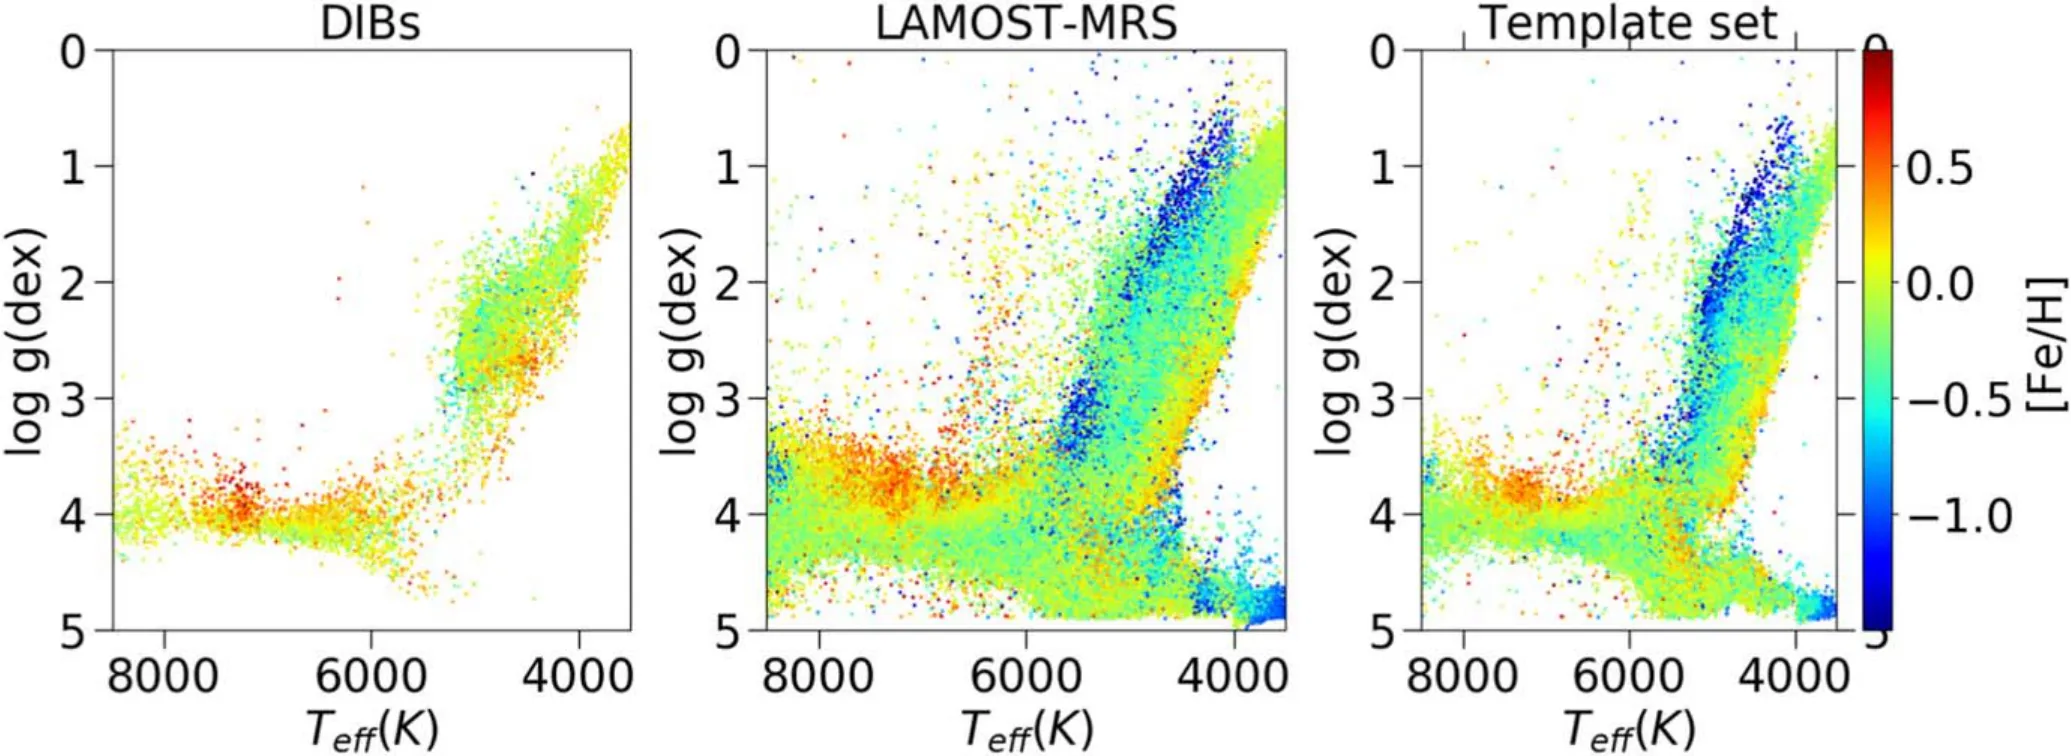
Figure 7.A Comparison of three data sets of FGK stellar parameter distributions.On the left is for the stars having-DIB features selected through stellar template subtraction,in the middle is for the stars in LAMOST DR7 released MRS,and on the right is for the stars that selected as templates without DIB features.[Fe/H]is color-coded.
The selected templates were averaged using their S/N as weights,,where ωnis the weight of each spectrum defined as ωn=log2(snr) andxnis the flux of the spectrum.A weighted template spectrum records the common features of stars with a specific stellar parameters removing occasional signals such as noise,bad pixels etc.After producing a weighted template spectrum,a target spectrum was cross matched with the template within the RV range±300 km s−1by a step of 15 km s−1,and a total of 40 matchings are required.The smallest 10 chi-square points were used to perform a Gaussian fitting to obtain the best RV.
It should be noted that before weighted averaging the templates,we calculated the RV of stars for each single template spectrum although LASP provide the RV measurement.We calculated the RV to guarantee the perfect template making for each FGK star in the initial sample and correct lines subtraction around DIBs.The left panel of Figure4shows an example of the RV determination of the star through Gaussian fitting.The RVs of stars we measured agree with that given by LAMOST-MRS shown in the middle panel of Figure4,and the right panel gives the systematic deviation ∼0.188 km s−1,and the scatter ∼0.746 km s−1.Then,the target spectrum was shifted to the rest frame and removed.
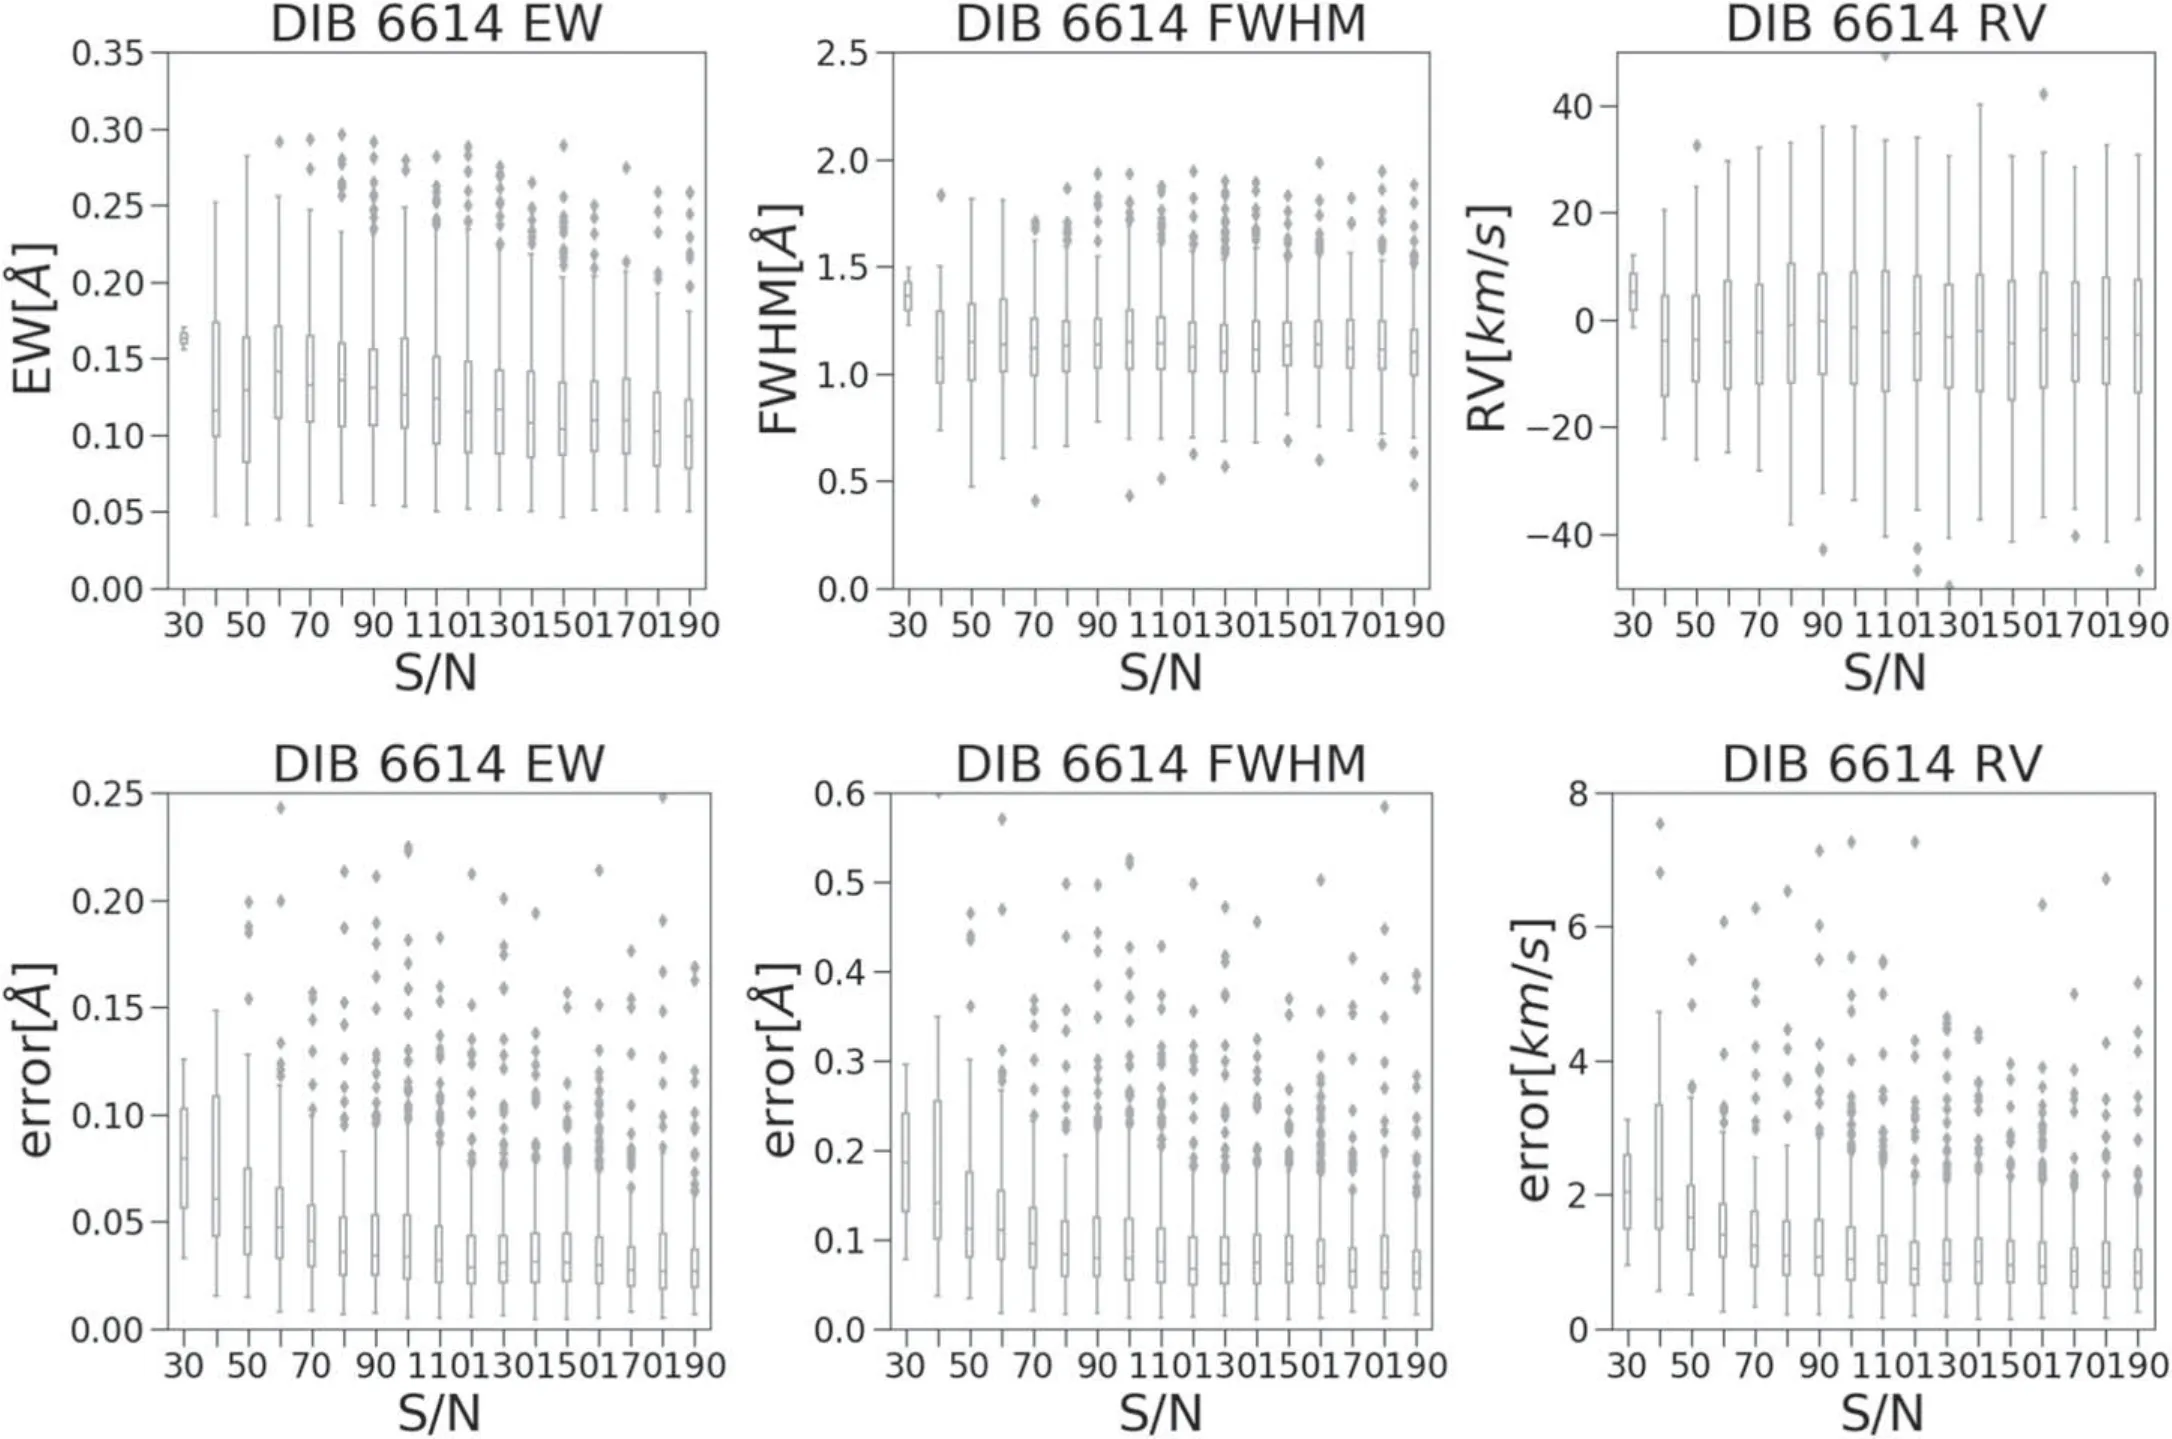
Figure 8.The distribution of EW,FWHM,and RV of DIB λ6614 along the S/N as well as errors distribution of corresponding errors along the S/N.The upper panels are EW,FWHM,and RV,while the lower panels are corresponding errors.The black individual points in the boxplots are outliers outside the quartile far from the mean values.
3.3.2.Selecting FGK Sample of DIB
After the process,664,565 spectra has been measured,and DIBs were looked for in the residual spectra.We calculate the EW and FWHM for the three DIBs,and these two values are used to determine whether the star has DIB features.The template subtraction may introduce more uncertainty of EW for FGK spectra,and be sure to carefully use the values in our catalog when conducting further research.
Figure5shows DIBs in six spectra of stars with different parameters.The stellar parameters were taken from LAMOST DR7 parameter catalog,and the 3D extinction values are from Green et al (2018).All these star are in the parameter range of[3100 85,000]K,[0.0 5.0]dex,and [−2.1 1]dex for temperature,gravity and metallicity respectively.For such a wide variety of the stars,our method can distinguish and measure DIB λ6379,DIB λ6614 and DIB λ6660 very well.Among the three DIB λ6614 is the most obvious in Figure6,which has the EW nearly 150 m Å,and the FWHM around 1 Å for these six examples.
Considering the resolutionR∼7500 of LAMOST MRS,we empirically concluded the DIB selection criteria as follows:EW of the 6614 Å absorption should greater than 0.05 Å,and the flux around 6614 Å have no bad points (from mask of LAMOSTspectral data).Finally,10,674 spectra of 7551 unique FGK stars with DIB features were determined,which were identified to be with DIB features.
Figure6shows the similarity of stellar parameter distribution of both selected template spectra and the LAMOST initial sample which are used for DIB search in FGK spectrum.Figure7compares the parameter ranges of three groups,i.e.,detected DIB stars,superimposed withDIBs and templates without DIBs.Template stars were selected according to the criteria described in the above paragraph.It shows that the parameter ranges of the three data sets are similar except for lacking cool dwarfs in the DIB group due to the cool dwarf with Teff <4500 K observed by LAMOST is solar nearby,and the interaction with matters producing DIB is weak.The portion of cool giants (Teff<5200K and logg <3.5 dex) is 66.4% for DIB stars and 27.0% for all entries in LAMOST DR7 MRS parameter catalog.In Figure7,it is shown that the DIB bands are less frequently detected in metal-poor stars,and the numbers of DIB detection in different [Fe/H] range can be seen Table2.
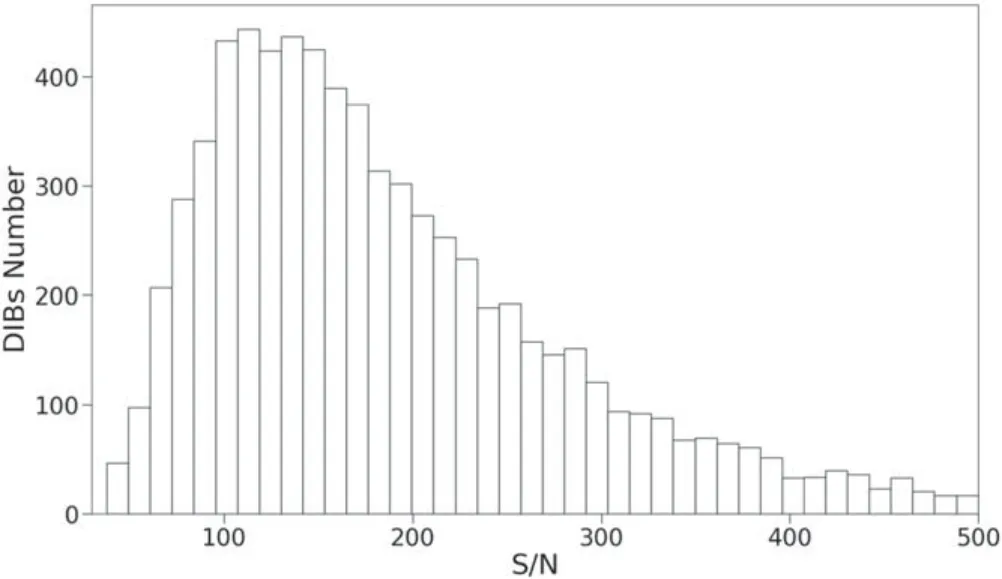
Figure 9.The histogram of S/N of the spectra with the DIB detections.
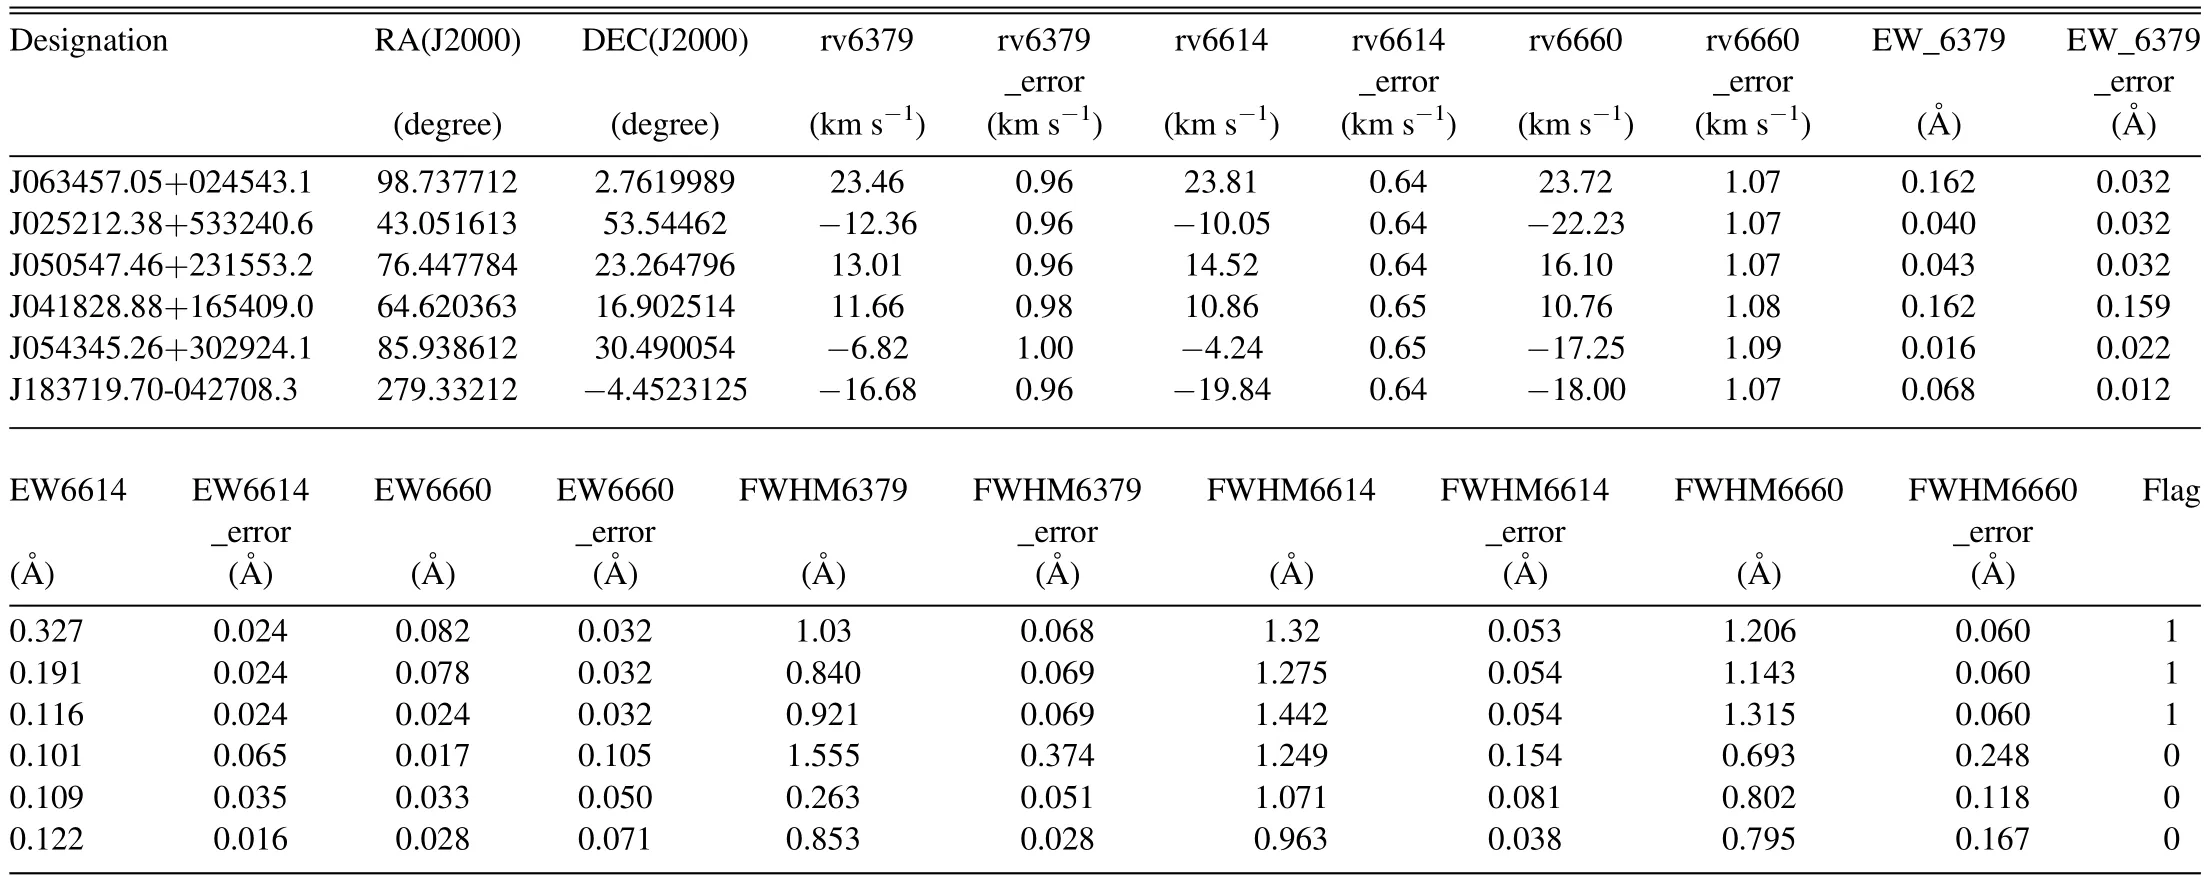
Table 3The Catalog of DIB
3.3.3.The DIB Catalog
We used combined MRS spectra in our work,and calculated all repeat spectra for one star observed in different nights and selected the spectrum with the highest S/N among the DIBs that could be detected.We compared the repeated spectra and found the average differences for the three DIBs are 0.003,0.003,0.002 Å,while the MSE are 0.03,0.02,0.04 Å,respectively.We checked having-DIB stars manually one by one.
Finally,we present a catalog of 11,003 sources with distinct DIB features,which is available at https://nadc.china-vo.org/res/r101123/.The catalog presents information of sources including the star designation,R.A.,decl.,and the RVs,EWs,and FWHMs of the three DIB features,as well as their errors.Table3is an example of 6 entries in the DIB Catalog.
The RV,EW and FWHM are calculated with Gaussian fitting,and the fitting process uses the Least Square algorithm.The Least Square can give errors for the fitting function parameters,from which we used to directly estimate RV,EW and FWHM.For the RV errors,we used center position error to estimate.While two functions are used for DIB profile fitting,i.e.,a straight line for continuum and a Gaussian for DIB absorption.The FWHM error can be estimated through the sigma of the Gaussian,and the EW error can be estimated through both the slope of the straight line and the sigma of the Gaussian using the equation errEW=Figure8shows the distribution of EW and FWHM of DIB λ6614 along the S/N as well as corresponding errors along the S/N.These plots show that the precisions of EW,FWHM,and RV of a DIB measurement are remarkably affected by the S/N of the stellar spectrum when S/N=30 and the errors of the three values go down quickly with the S/N increase and will be stabilized when S/N>80.Figure9shows the histogram of S/N of all the spectra with the DIB detections.
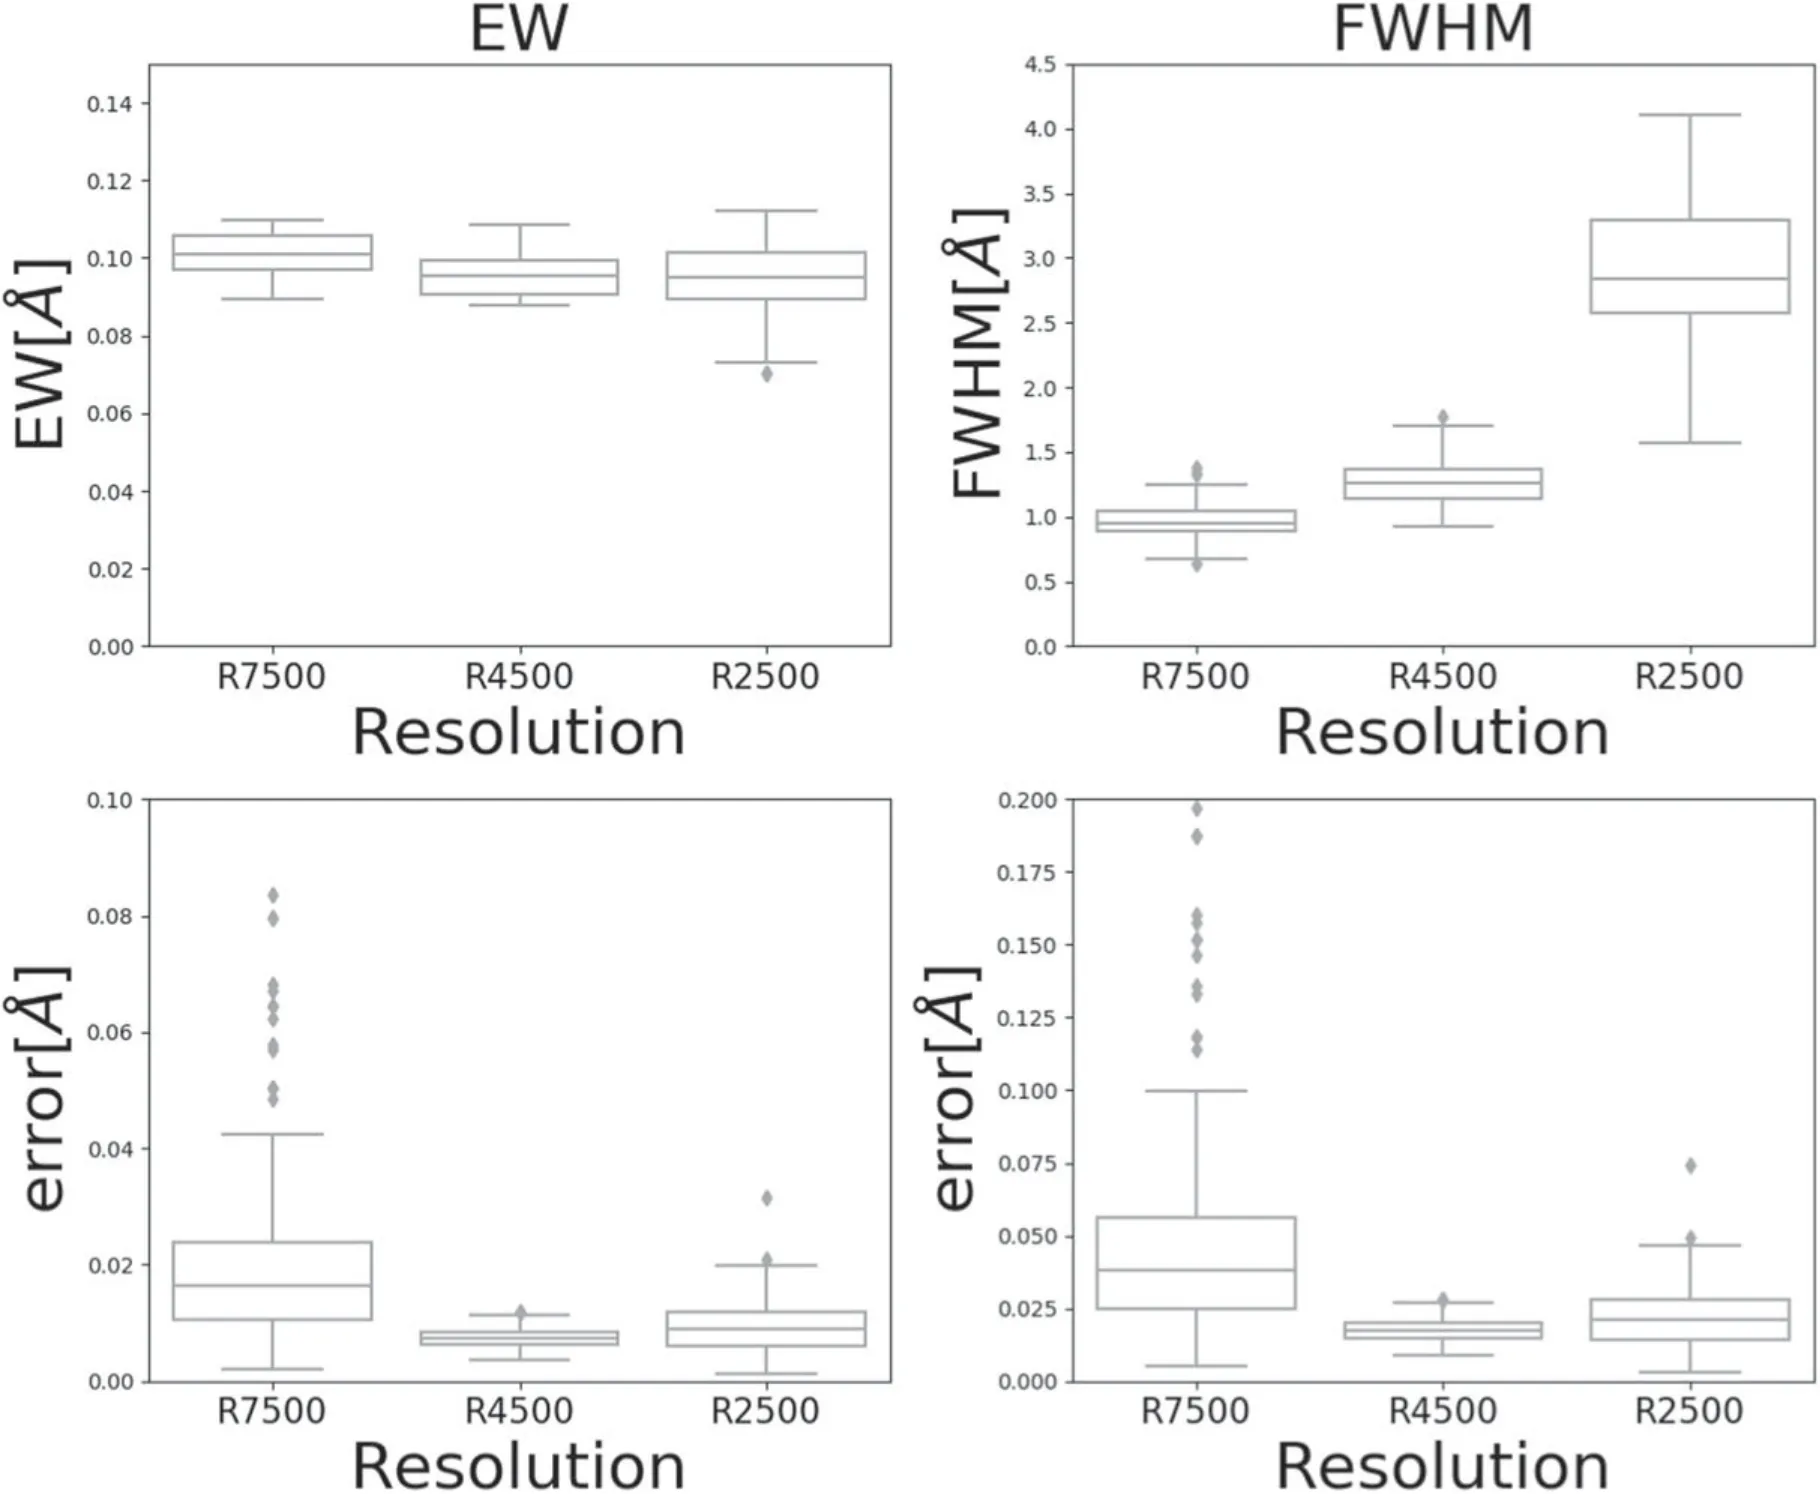
Figure 10.The distribution of EW and FWHM of DIB λ6614 along the resolution as well as corresponding errors.The upper panels are EW and FWHM,while the lower panels are corresponding errors.We decreased R ∼7500 MRS spectra to R ∼4500 and R ∼2500 to do the simulation,in which the S/N are within 100–200 of the MRS spectra.The black individual points in the boxplots are outliers outside the quartile far from the mean values.
To verify the spectral resolution effect to the DIB detection and errors,we decrease the resolution of MRS toR∼4500 andR∼2500 to simulate the effect to the DIB measurement and errors,which shown in Figure10.From the figure we can see that the error of EW and FWHM inR∼7500 is higher than inR∼4500 andR∼2500 although they are all tiny.The reason is that the convolution algorithm used for resolution decrease can increase the S/N of the spectra.The most important result is that the EW measurement slightly varies in different resolution.
4.Spatial and Kinematic Analysis
Figure11shows that the distribution of DIBs discovered in this work.The galactic center (l,b=0) is projected to the very center of Figure11,and most of our targets are distributed in the Anti-Galactic center direction which agree with the footprint of the LAMOST MRS survey.We will discuss the spatial distribution and kinematics of them in following subsections.
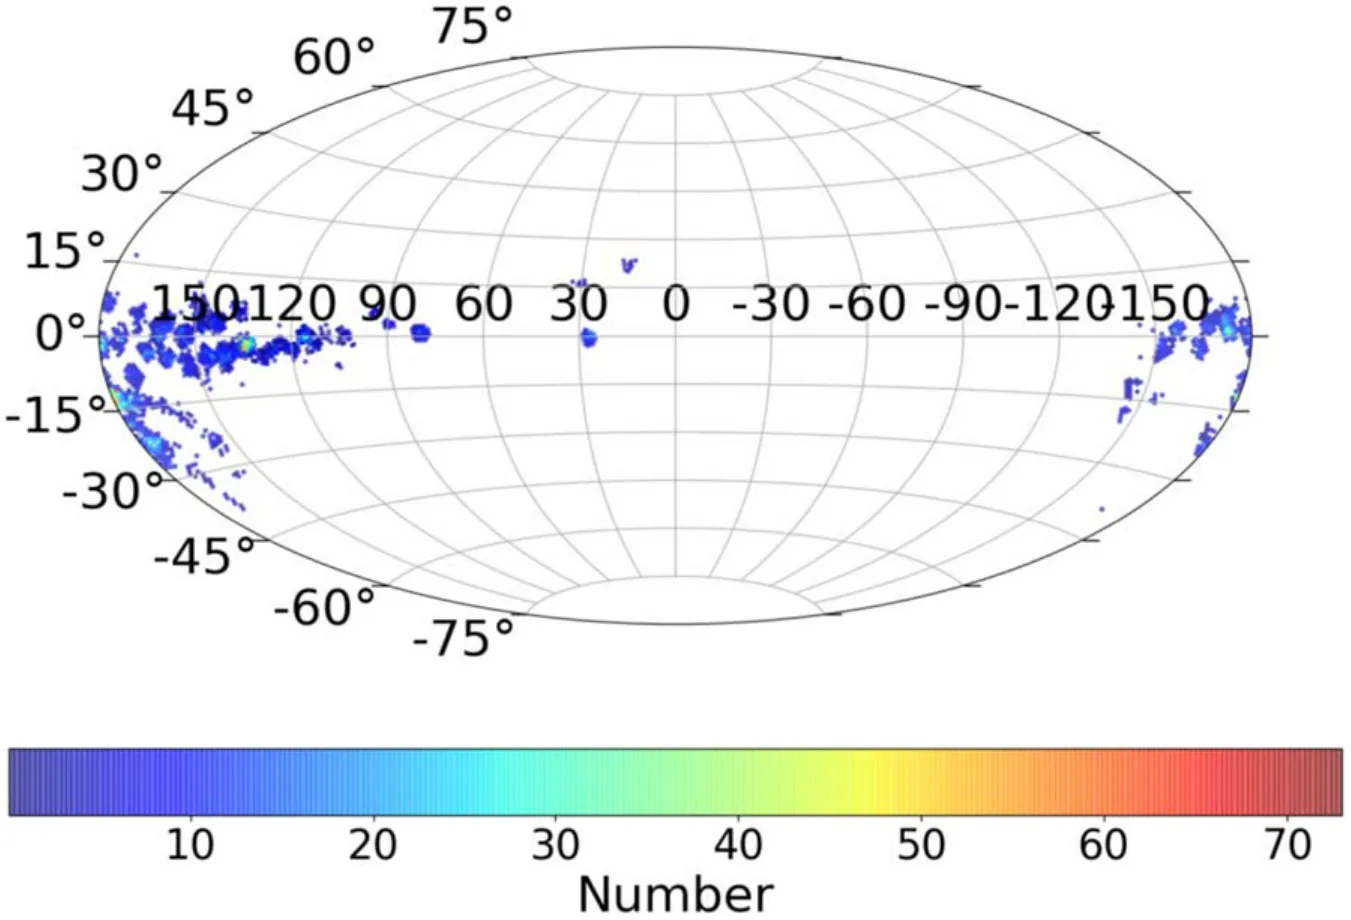
Figure 11.The density distribution map of DIBs in Galactic coordinates agrees with the footprint of the LAMOST MRS survey.Our DIB samples densely distributed within 15 degrees of latitude.Another dense distribution exists between 160°and 200°of longitude,15°and−30°of latitude.These two locations are both where the nebulae are relatively concentrated.
4.1.The RVs of the DIBs
The large quantity of DIBs and background stars we found can be used to study the kinematics of the DIB carriers.Zhao et al.(2021) made use of the measurements from the Giraffe Inner Bulge Survey(GIBS)and the Gaia-ESO survey(GES)to study the kinematics and distance of the carrier of DIB λ8620,as well as other properties.In this paper,we simply study the RVs of our sample.As described above the RVs of the stars were calculated through the template matching method,and the RVs of the DIBs were calculated based on center-lines of the three DIBs .It is particularly pointed out here that after the wavelength value of the DIB lines obtained,the RV value of the stellar should be added back when calculating the RVs of the DIBs,equivalent to calculation in the rest-frame.
The distributions of the RVs of all DIB samples are presented in Figure12,which shows an obvious bimodal structure peaking at(5.55 km s−1,−17.11 km s−1),(11.39 km s−1,−12.12 km s−1),(7.53 km s−1,−15.24 km s−1),respectively.Their differences of each pair are respectively 23.66 km s−1,23.51 km s−1and 22.77 km s−1,within the intrinsic RV error 1.3 km s−1that LASP provides(see LAMOST DR7 release notehttp://dr7.lamost.org).We will discuss the two components in the following subsection.
4.2.The Distribution of DIB Strength and Correlation with Extinction
The rectangular Galactic coordinates (Piecka &Paunzen2020)were applied in our work with the position of the Sun as the zero-point and thez-axis toward the Galactic north pole.Using GAIA parallax (Gaia Collaboration et al.2018),dsunzcan be calculated using the following formulas,which represents the height of the Galactic disk.Figure13shows the intensity change of DIB in theZ-axis direction.

It should be mentioned that although the distances computed from the GAIA parallax are different from that of Bailer-Jones et al.(2018),the differences are tiny because most of the DIB stars are located within 1 kpc from the Sun.
LAMOST MRS spectra are symmetrically distributed on both sides of the Sun taking thez-axis of the Sun as zero (see the lower right panel of Figure13),while the distribution of DIB stars are not (see the upper right panel of Figure13).
We used DIB λ6614 to check the correlation of the two RV components and two spatial components.From Figure14,the negative RV component is mainly located at the longitudel<180 degree,while the positive RV component is mainly located at the longitudel>180°.
Figure15shows the extinction distribution of LAMOST-MRS.Comparing Figures15and11,we can see that the distribution of DIBs is concentrated where the corresponding extinction is large,but it does not mean that there is no DIB distribution in the place where the extinction is small.In the case of low extinction at high latitude,some DIBs still exist.(Baron et al.2015a).We know that the extinction of the Milky Way is caused by gas and dust,and the DIB features may also be produced by gaseous macromolecular substances.Therefore,the appearance of DIB should be closely related to the extinction although not absolutely.This result is consistent with the results of Istiqomah et al.(2019),which indicates that DIB is positively correlated with the interstellar extinction with a few deviations.
The correlation between the extinctionE(B–V)of our earlyand FGK-type DIB stars and the EW of the three DIBs are shown in the left and right columns of Figure16respectively.We also compared our EW of DIB λ6614 and extinction with that of Fan et al.(2019) and Friedman et al.(2011) in Figure17,and the result shows good agreement.
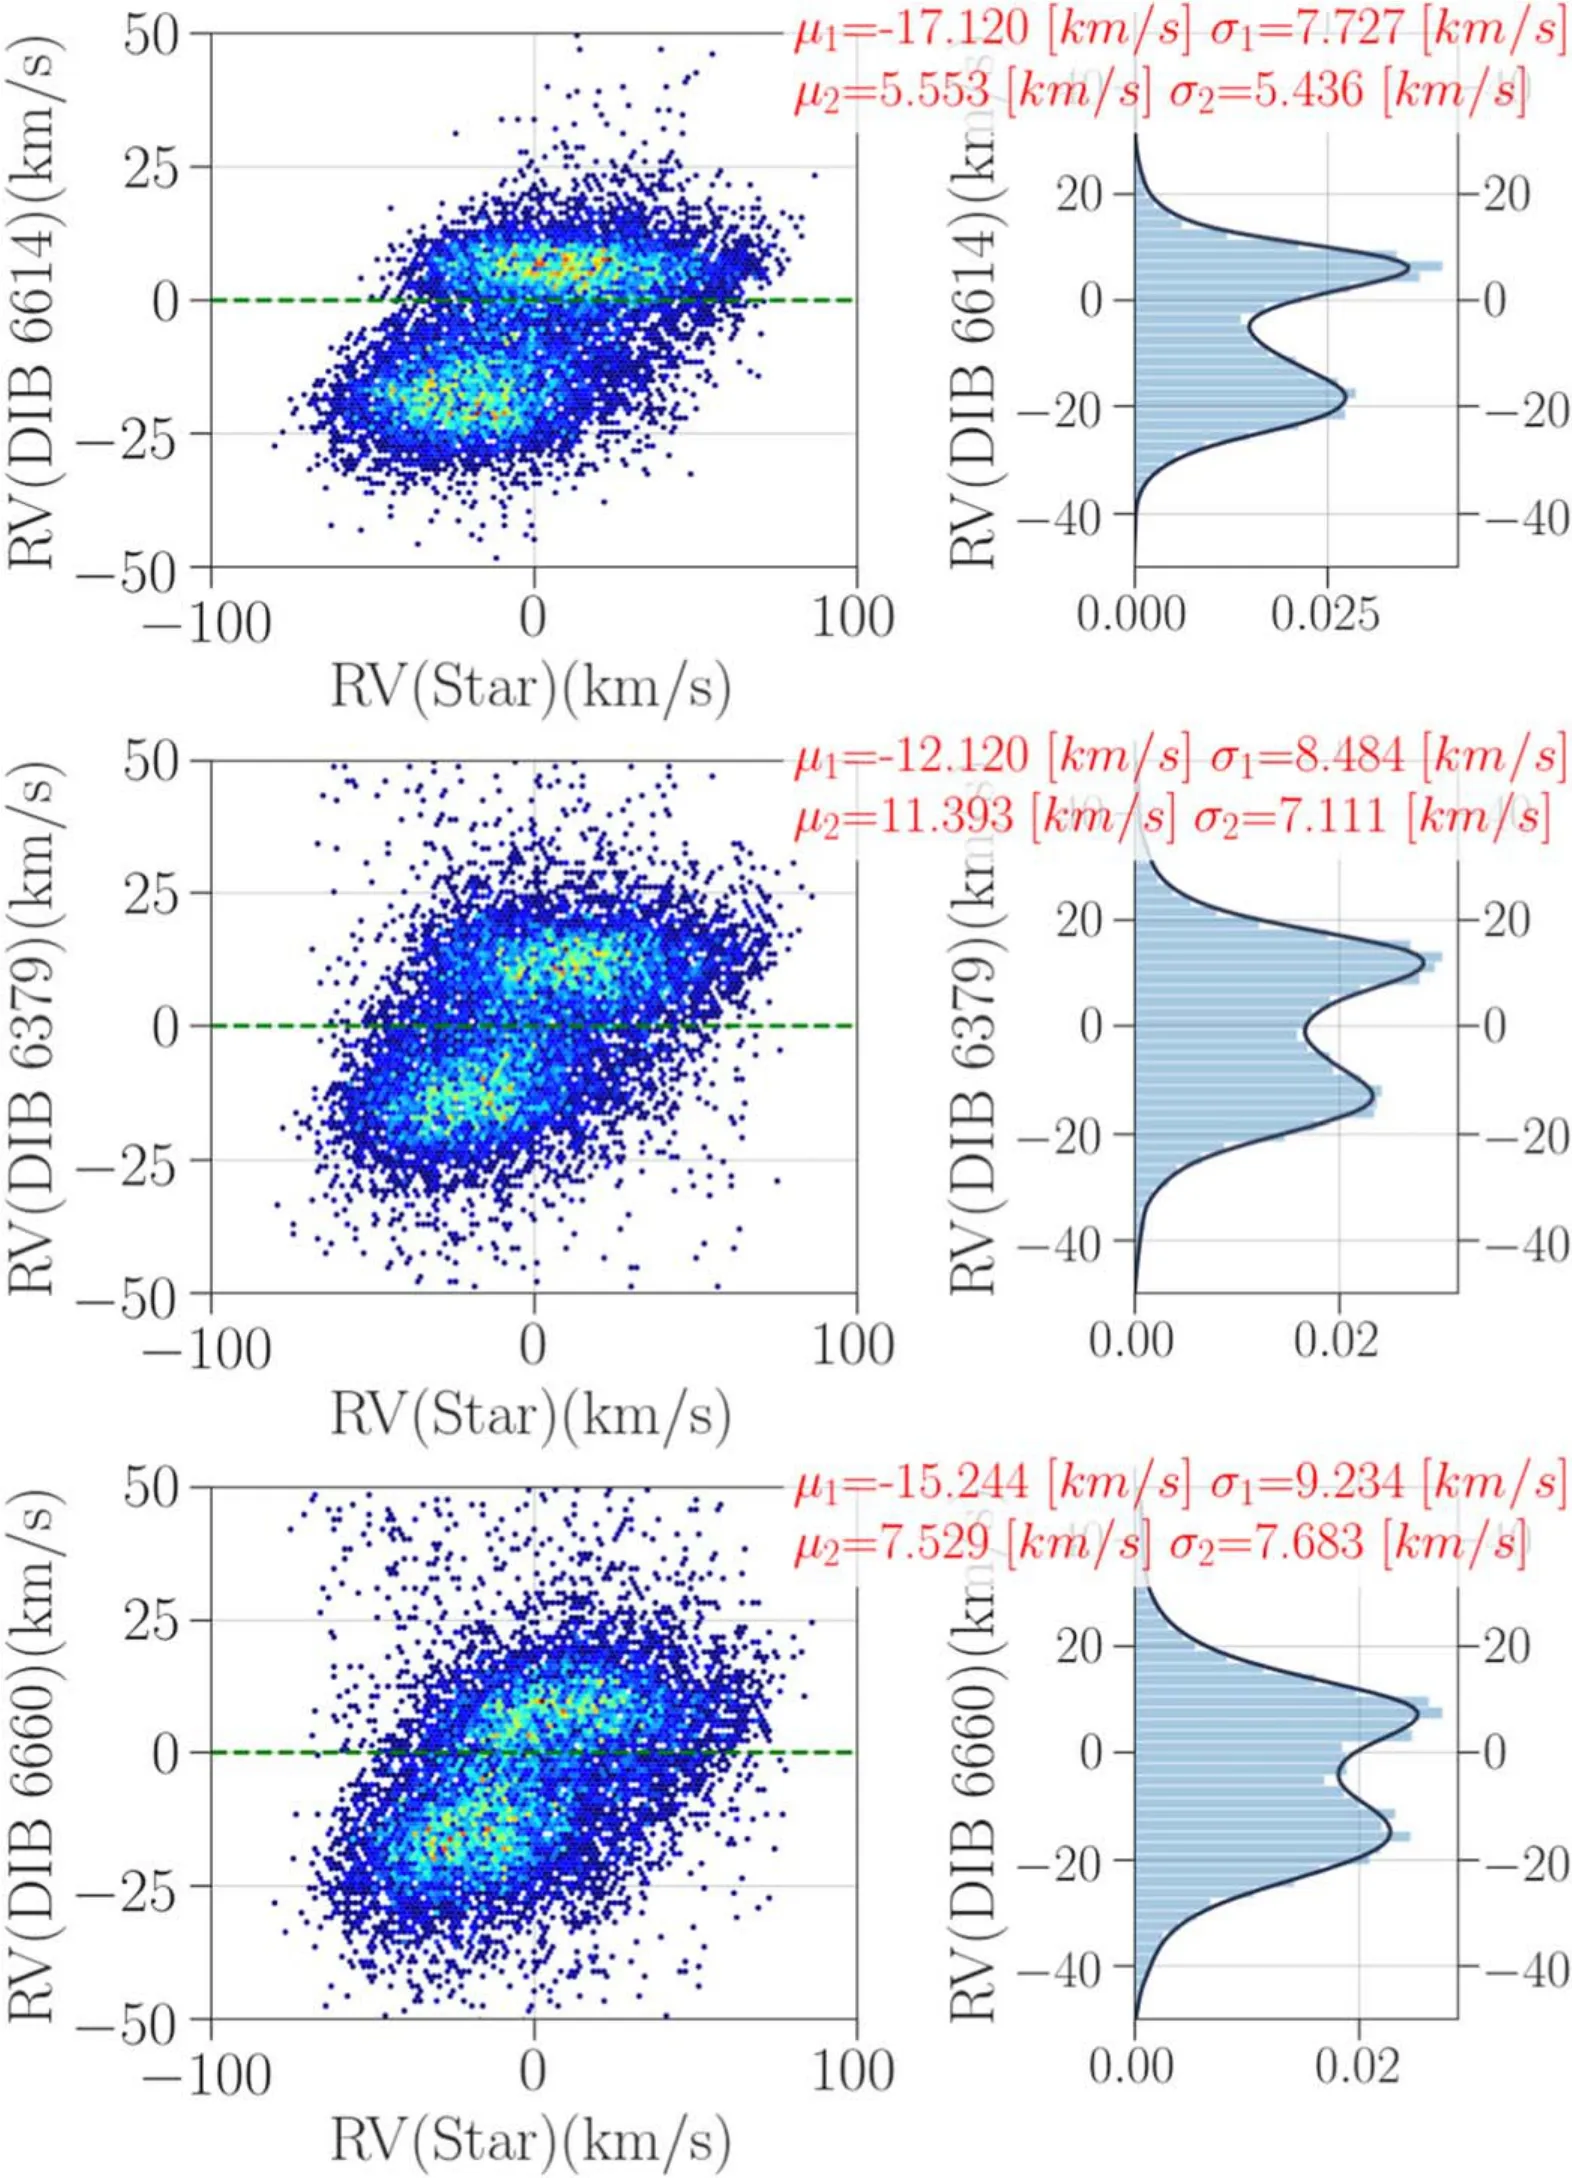
Figure 12.Two components of the RVs distribution of the three DIB samples.The left column shows the DIB RV vs.star RV with no correlation for the two individual components.The color represents the number density,which increases from blue,water blue,cyan,green to red.The right column shows the histogram of the DIB RV.
We studied the correlations between the three DIBs.Figure18and Table4show the Pearson correlation coefficientRand the slope of the fitting line.All correlations have positive correlation coefficients,indicating the reliability of DIB measurement in this work.The correlation coefficientsRof our sample are all smaller than the work of Xiang et al.(2009),in whichRbetween DIB λ6379 and DIB λ6614 is 0.88 andRbetween DIB λ6614 and DIB λ6660 is 0.87.It is probably because the measure accuracy of low-resolution spectra is lower than that of high-resolution data,and the measurement scatter is slightly larger.
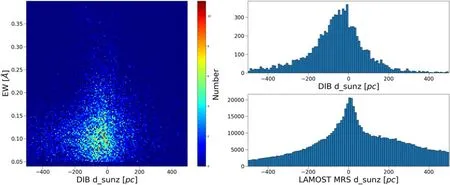
Figure 13.DIB strengths varies with the height of the Galactic disk.The left panel illustrates the EWs of DIBs vs.the height of the Galactic disk.The upper right panel shows the number distributions of DIB stars,which shows double peaks.The lower right panel shows all LAMOST-MRS samples along the height of the Galactic plane as comparison.
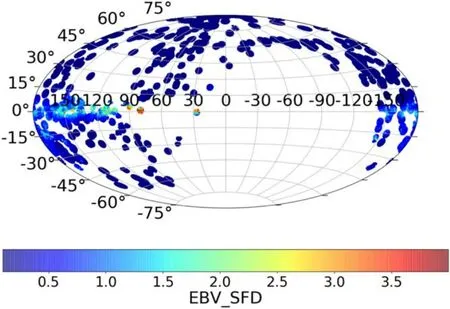
Figure 15.Extinction distribution in LAMOST DR7 MRS survey.The 3D extinction parameters of all data were calculated with reference to the dust map module of Green et al.(2018).The distance parameters input to the 3D extinction module is from Gaia DR2 distances crossing with Bailer-Jones et al.(2018).(Because many 3D dust maps are probabilistic,we need to specify median/mean/random reddening,etc.,and we employed median in this work.)
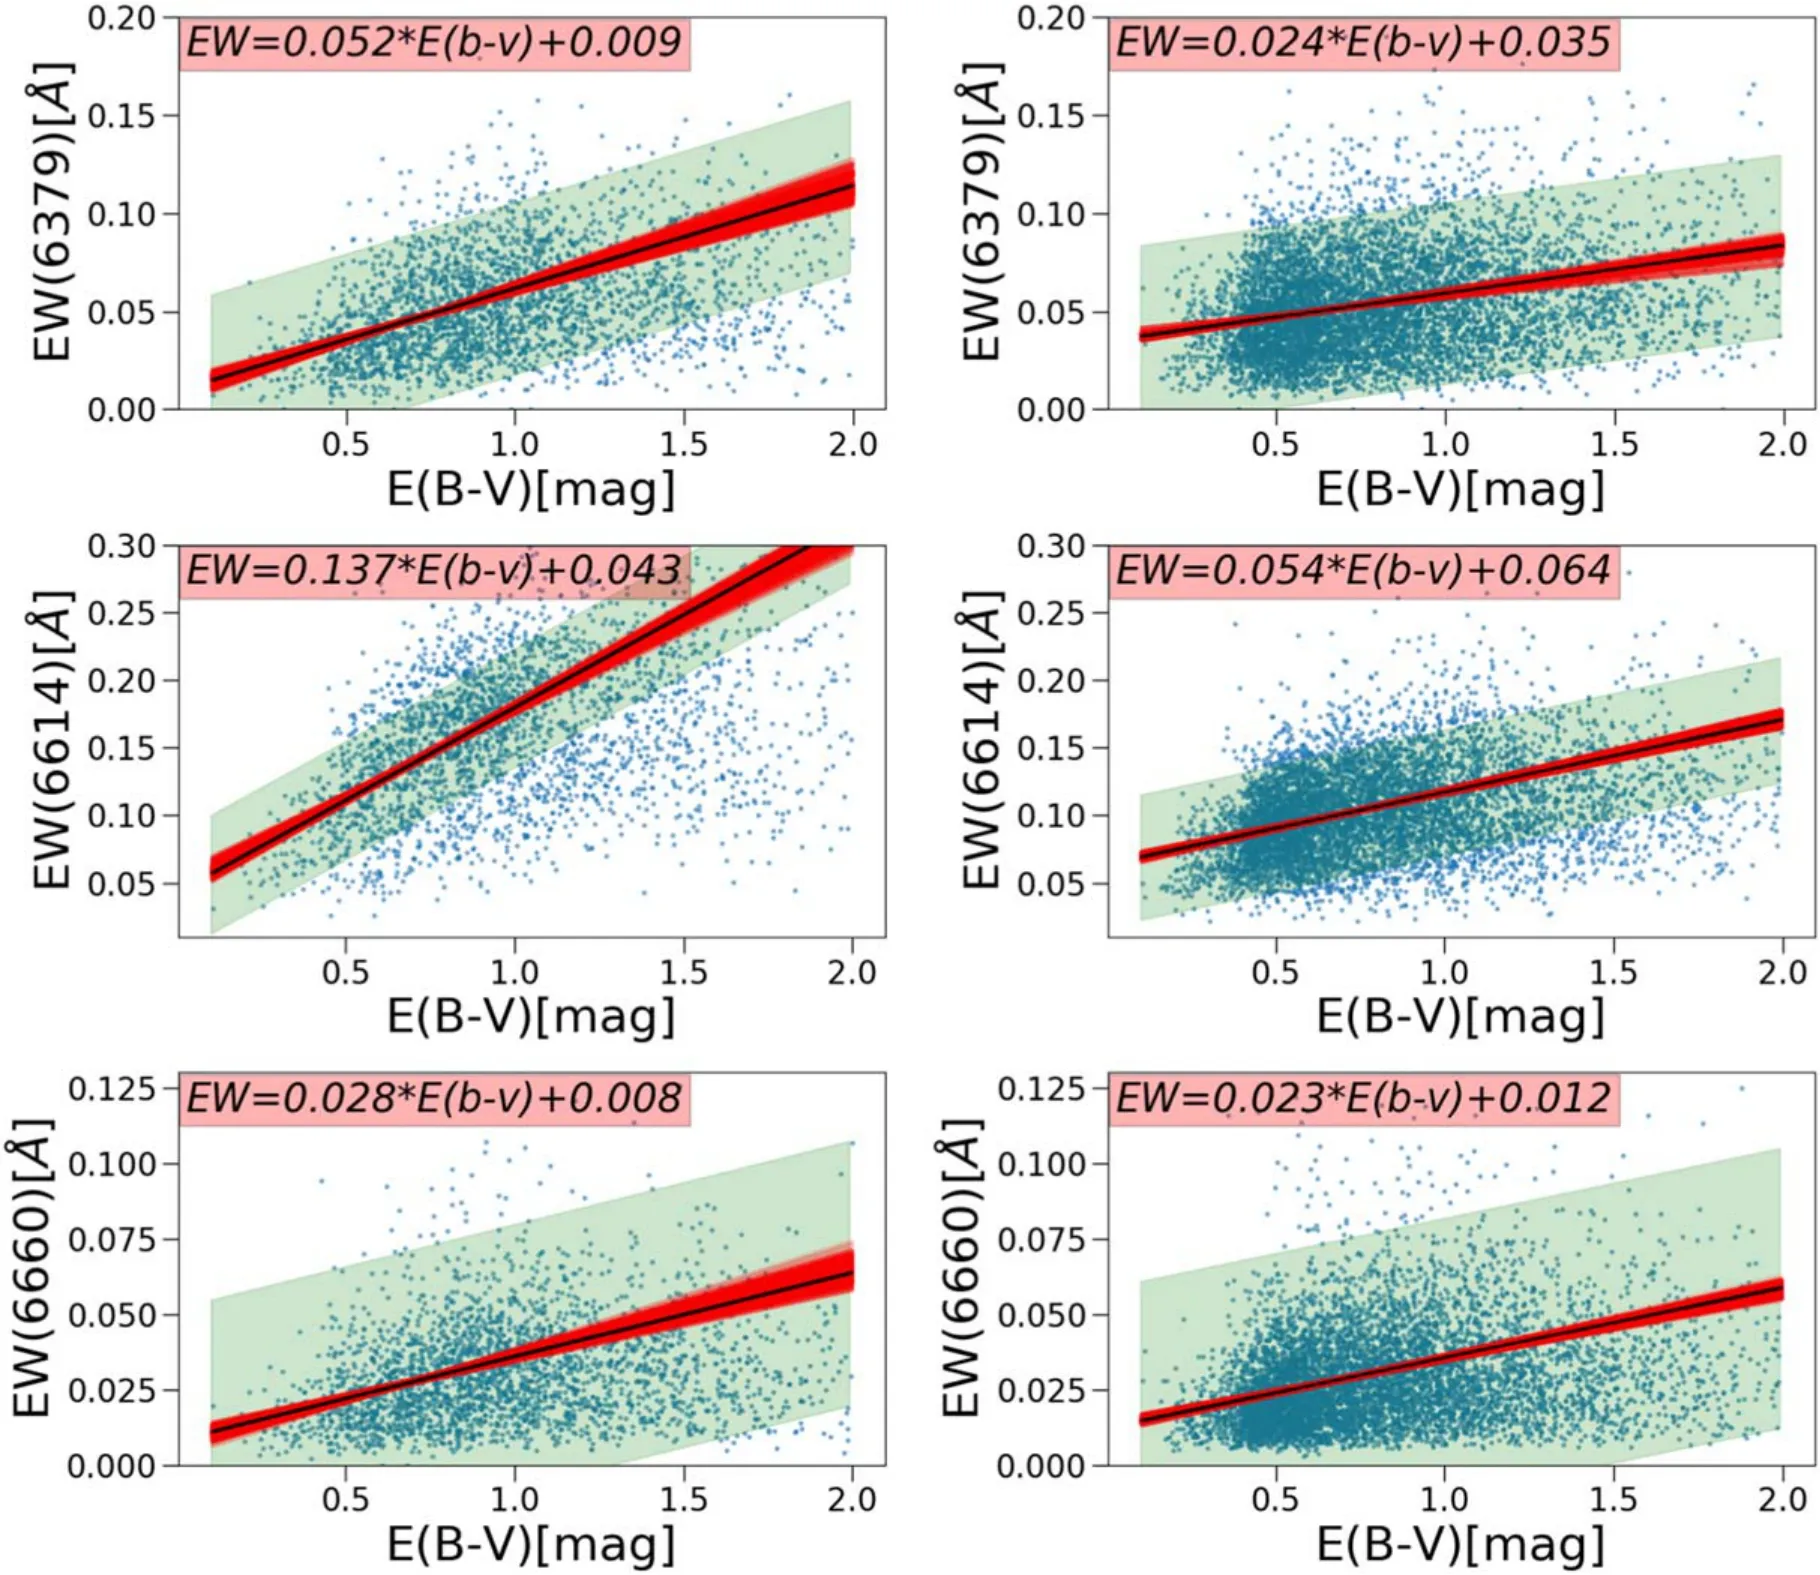
Figure 16.The three subplots in the left column show the correlation between the extinction E(B-V)and the EW of the three DIBs with early-type stars.In the right column,we show the correlation with FGK stars.The green shade regions represent the 95% confidence interval.The red areas mean the fitting uncertainty of parameters calculated with Monte Carlo algorithm,the range of slopes&intercepts for DIBs in early-type stars are[0.043-0.062]&[0.004-0.016],[0.122-0.155]&[0.031-0.054],and [0.023-0.031] &[0.004-0.012] from top to bottom in the left column,while the ranges of slopes &intercepts for DIBs in FGK-type stars are[0.020-0.029] &[0.030-0.038],[0.049-0.061] &[0.060-0.067 ],and [0.020-0.026] &[0.011-0.015] from top to bottom in the right column.
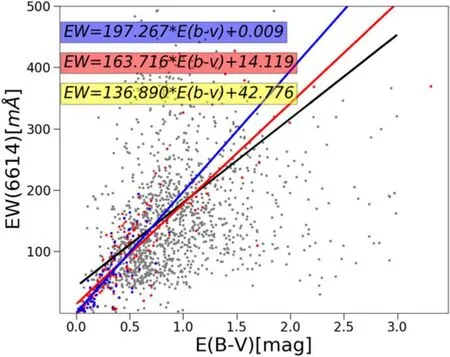
Figure 17.The comparison of the relationship slopes for DIB λ6614 vs.E(B-V),and both of the dots and lines are color-coded.Ours are in black,Fan et al.(2019)are in blue,and Friedman et al.(2011) are in red.
5.Discussion
We examined the objects which were studied before,and only obtained two common stars in previous studies listed in Table5.
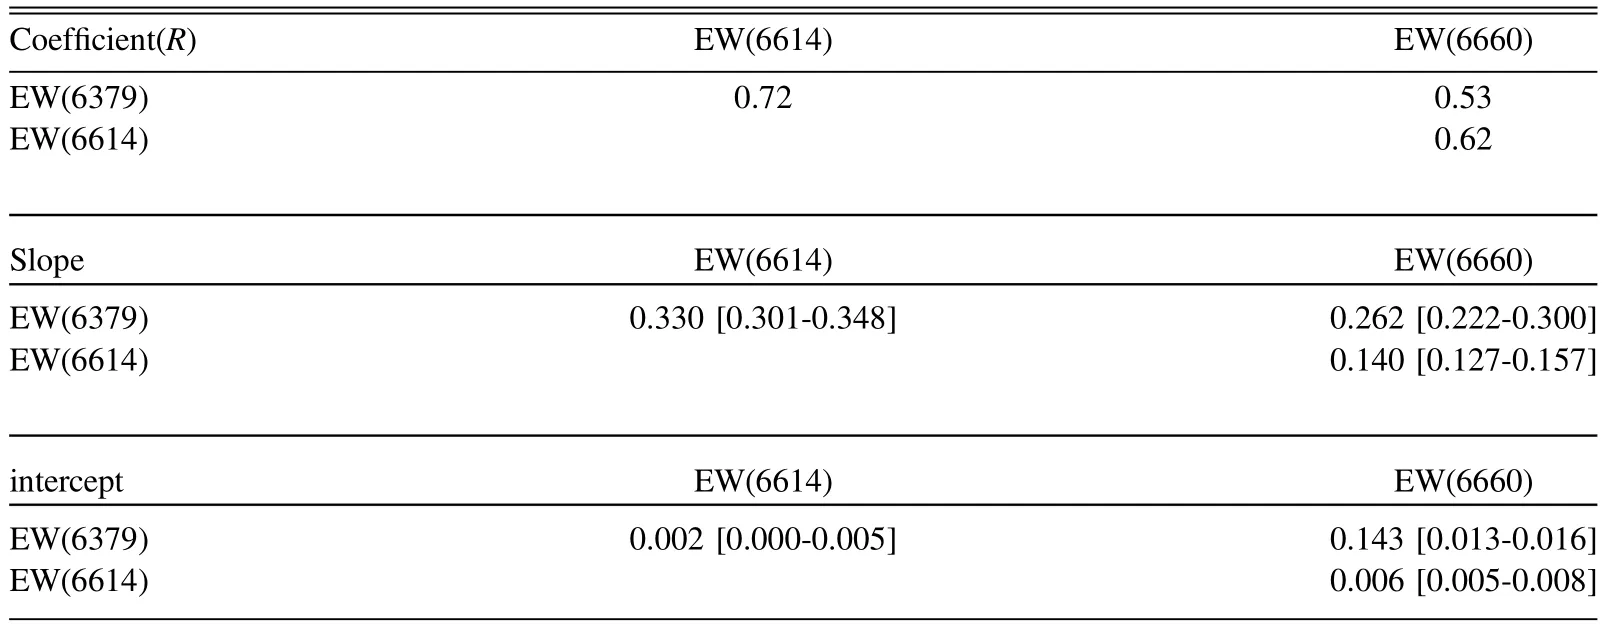
Table 4The Correlation Coefficient and the Slope and Intercept of the Fitted Line between Three DIBs

Table 5Two DIB Stars Discovered in the Literature
The ultimate goal of studying DIBs is to study what the carriers of these DIBs are.The current carrier speculation has multiple directions,including solid particles,gas-phase molecules,carbon-chain molecules,polycyclic aromatic hydrocarbons (PAHs),and fullerenes (fullerenes).This work provides at least three aspects to study the DIB relevant problems,including the correlation with multi-band carriers,profile study,and DIB detection approach in spectra of cool stars.
This work presents DIB samples that show clear correlation with possible carriers.Figure19shows spherical distributions of DIB samples in four different wave bands,which include ALLWISE 12 μm,CO molecular,neutral hydrogen HI,and IRAS 100 μ.From the figure,our DIB samples show clear correlation with these possible carriers.
This work provides a large data set of DIB spectra with resolutionR∼7500,many of which exhibit complex profiles that are worthy of further analysis.Figure20shows profiles of four DIB λ6614 examples,which have clear multicomponents and red tails.Galazutdinov et al.(2002) discussed the multimodal structure of the profiles of DIB λ6614,and studied their excitation mechanism.Marshall et al.(2015) studied the relationship between the excitation mechanisms of the DIB λ6614 and the PAH-type molecules.It may or may not be true,because different transitions may produce the same absorption.The results of the DIB λ6614 excitation mechanism are different from those of Oka et al.(2013) and Bernstein et al.(2013).In addition,Bernstein et al.(2015) proposed the possibility of DIB λ6614 being superimposed by two DIBs and analyzed these two components.
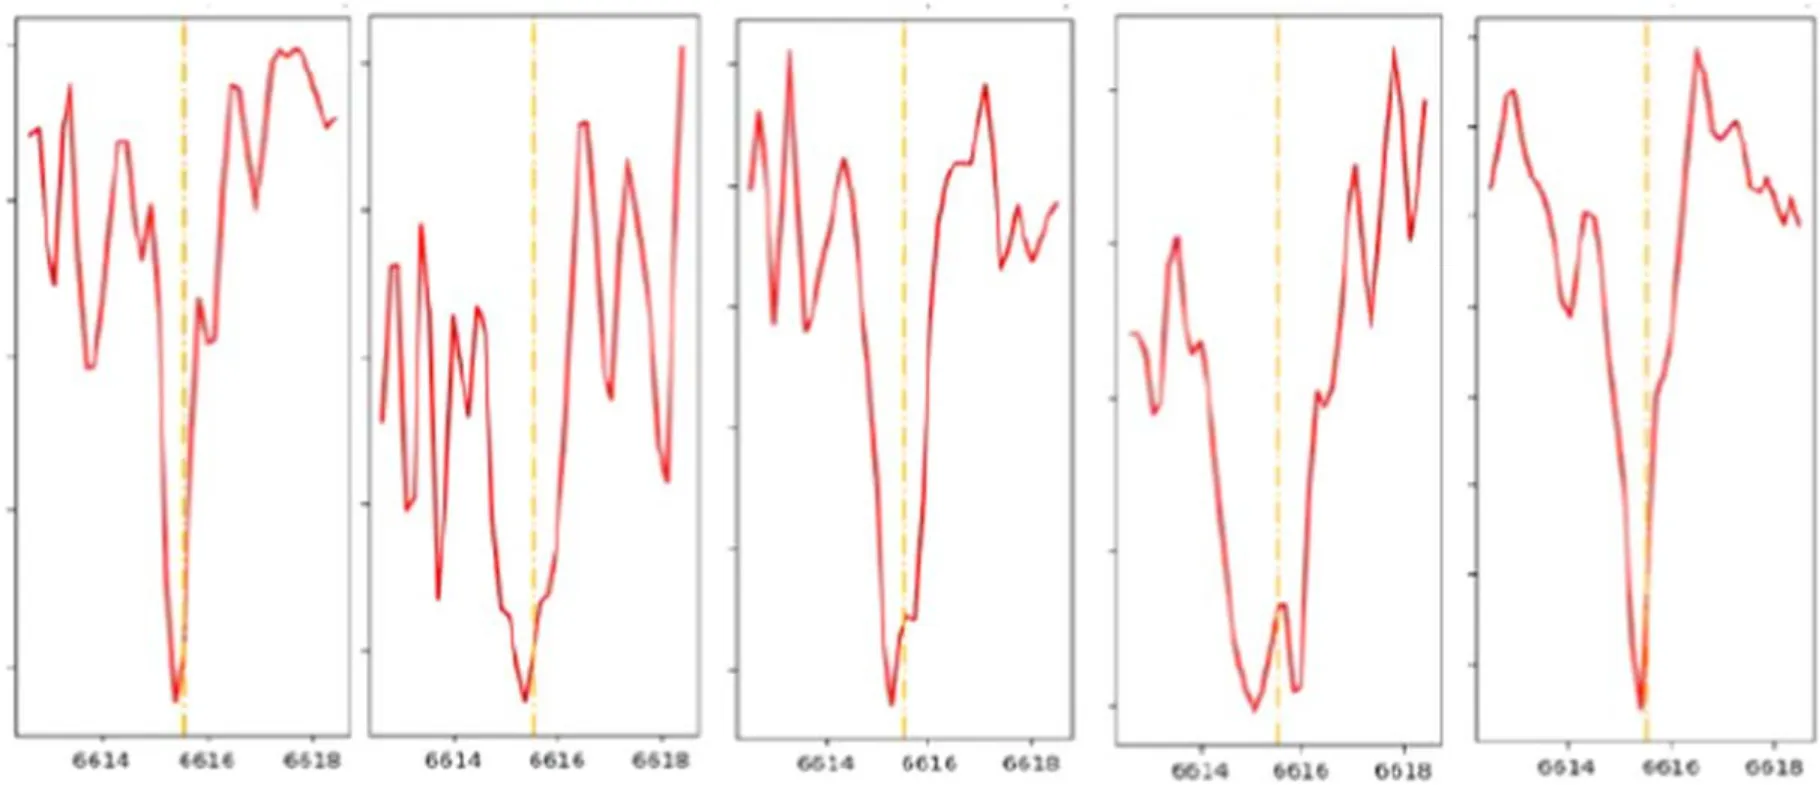
Figure 20.Four DIB λ6614 profiles with clear multicomponents and red tails.
This work detects a large number DIBs in stars cooler than 5000 K using the template subtraction method.The previous studies such as Smith (1995),Xiang et al.(2009) mentioned that DIB absorption characteristics were seldom found in the spectra of stars with a temperature lower than that of G4 type stars.The main reason is that the metal absorption lines in these spectra are more likely to be mixed with the absorption of DIB characteristics,which are difficult to distinguish.In fact,the incidence of DIB appearing in the spectra of lower temperature stars spectra is not smaller than that in higher temperature stellar spectra.On the contrary,the spectra with DIB features selected in this study have a higher proportion in spectra of low-temperature stars,which provides an additional option for detection of DIB features.
Acknowledgments
We are grateful to Dr.Rui Wang for helpful discussions.This work is supported by the National Natural Science Foundation of China (Grant Nos.U1931209,12003050,11970360,12090044 and 12103068) and the National Key R&D Program of China (Nos.2019YFA0405502 and 2019YFA0405102).Guo Shou Jing Telescope (the Large Sky Area Multi-Object Fiber Spectroscopic Telescope,LAMOST) is a National Major Scientific Project built by the Chinese Academy of Sciences.Funding for the project has been provided by the National Development and Reform Commission.LAMOST is operated and managed by the National Astronomical Observatories,Chinese Academy of Sciences.This work has made use of data from the European Space Agency (ESA) mission Gaia (https://www.cosmos.esa.int/gaia),processed by the Gaia Data Processing and Analysis Consortium (DPAC,https://www.cosmos.esa.int/web/gaia/dpac/consortium).Funding for the DPAC has been provided by national institutions,in particular the institutions participating in the Gaia Multilateral Agreement.This research has made use of ”Aladin sky atlas” developed at CDS,Strasbourg Observatory,France.
杂志排行
Research in Astronomy and Astrophysics的其它文章
- A Baseline Correction Algorithm for FAST
- Ultra-wide Bandwidth Observations of 19 Pulsars with Parkes Telescope
- Correlation between Brightness Variability and Spectral Index Variability for Fermi Blazars
- Candidate Eclipsing Binary Systems with a δ Scuti Star in Northern TESS Field
- HI Vertical Structure of Nearby Edge-on Galaxies from CHANG-ES
- Analyzing Dominant 13.5 and 27day Periods of Solar Terrestrial Interaction:A New Insight into Solar Cycle Activities
