Hydroclimate changes related to thermal state of the tropical Pacific in the northern coast of the South China Sea since ~8000 cal yr B.P.
2022-08-19YueQinWuXiaoQiangYangJianYinFranzrsihTingWeiZhangChunLianLiu
Yue-Qin Wu , Xiao-Qiang Yang ,*, Jian Yin ,**,Franz T. Fürsih , Ting-Wei Zhang , Chun-Lian Liu
a Guangdong Provincial Key Laboratory of Geodynamics and Geohazards, School of Earth Sciences and Engineering, Sun Yat-Sen University, Zhuhai 519082, Guangdong Province, China
b Southern Marine Science and Engineering Guangdong Laboratory (Zhuhai), Zhuhai 519082, Guangdong Province, China
c FG Pal¨aoumwelt, GeoZentrum Nordbayern der Friedrich-Alexander-Universit¨at Erlangen-Nürnberg, Erlangen 91054, Germany
Abstract Under the complex influences including the monsoonal climates and tropical hydrological cycle,the features and forcing mechanisms of precipitation changes in the tropical monsoon regions remain controversial. The northern coast of the South China Sea (NCSCS), connecting the South China Sea (SCS) and the Pearl River Estuary(PRE),is a critical area providing reliable tropical precipitation records and probing the possible forcing mechanism of tropical precipitation, benefitted from its high deposition rate and hydroclimatic sensitivity.Here,δ18O variations of planktonic(δ18OG. ruber)and benthic foraminifera(δ18OC. lobatulus)were investigated respectively to reconstruct a high-resolution low-latitude precipitation record from the core 17NH-NC3 in the NCSCS. The results show a distinct δ18O difference between δ18OG. ruber and δ18OC. lobatulus,not only with respect to values, but also with respect to trends in some time intervals. The clear difference between the planktonic and benthic foraminifera (Δδ18Ob-p) illustrates the significant vertical salinity stratification. And the temporal trend of Δδ18Ob-p indicates the degree of salinity stratification variated since the mid-Holocene. We assume that the degree of stratification in the NCSCS was mainly controlled by tropical precipitation changes. Thus, the trend of Δδ18Ob-p values could indicate the temporal change of the tropical precipitation. The precipitation record of our research area is closely related to the tropical atmosphere-ocean dynamics stimulated by sea surface temperature (SST) changes of the tropical Pacific zone, analogous to the El Ni~no-Southern Oscillation (ENSO) events. During the mid-Holocene (from 8260 to 5180 cal yr B.P.), the sustainable higher Δδ18Ob-p values (>1.23‰) suggested a large amount of precipitation,pointing to a sustained state of La Ni~na-like, which is associated with lasted higher difference between Western SSTand Eastern SST(W-E SST gradient)in the equatorial Pacific.Since 5180 cal yr B.P.,the decreasing Δδ18Ob-p indicates less low-latitude precipitation, which can be ascribed to an El Ni~no-like mean state arising from decreased W-E SST gradient.Our study provides a new continuous high-resolution archive of low-latitude precipitation in the tropical monsoon region since 8260 cal yr B.P.And this record highlights that the thermal state of the tropical Pacific most likely adjusted the low-latitude precipitation since the mid-Holocene.
Keywords Stable oxygen isotope, Globigerinoides ruber, Cibicides lobatulus, Low-latitude precipitation,ENSO, Mid-Holocene
1.Introduction
Tropical monsoon regions are of central importance for global hydrologic cycles, impacting continental moisture.In recent decades,the hydrological changes in tropical and sub-tropical areas during the Holocene have been studied intensively based on different proxies obtained from the sedimentary records.These records, however, have shown inconsistent trends,even at the same core sites (e.g., Yu et al., 2012;Strong et al., 2013; Jia et al., 2015; Wang et al.,2016a).
One of the hypotheses speculated that the East Asian Monsoon, associated with solar insolation modulating the land-sea thermal contrast (Selvaraj et al., 2007; Jin et al., 2014), is the primary control of the precipitation changes in low latitudes,based on the foraminiferal δ18O(Tian et al.,2004;Wang et al.,2016b) and on stable hydrogen isotope records of terrestrial plant-wax (Huang et al., 2018) from South China Sea (SCS), the speleothem δ18O (Yuan et al.,2004; Dykoski et al., 2005) and eutrophic peat/mud sequences(Zhou et al.,2004)from southern China,as well as on other records (Strong et al., 2013; Wang et al., 2016a; Chen et al., 2019). During the Holocene,Northern Hemisphere insolation has become less seasonal,following a decreased change in the capacity of the northern summer solar insolation (Berger and Loutre, 1991; Laskar et al., 2004). This may have caused a decreased Asian Summer Monsoon with less precipitation in low latitude areas (Dykoski et al.,2005; Hu et al., 2008; Tierney et al., 2010).
However, this hypothesis relating to monsoonal influence associated with solar insolation is not supported by numerous studies, which showed even opposite results for the Holocene.For instance,during phases of stronger Summer Monsoon, heavier planktonic foraminiferal δ18O values were reported (Oppo and Sun, 2005; Oppo et al., 2007). During weak Summer Monsoon phases, δ18O of surface sea water in the Makassar Strait, situated to the south of the SCS,displayed the lightest values (Oppo et al., 2009). The decreased variations of leaf wax n-alkane Δδ13C31-29values recorded from Lake Huguangyan (Jia et al.,2015) and the pollen records from southern China(Zhao et al.,2009)also suggest a wetting and warming trend, when the Asian Summer Monsoon and the solar insolation were decreased during the mid-Holocene.Thus, the features and the mechanisms of the precipitation changes in tropical regions during the Holocene remain controversial.
Different explanations have been put forward for these unexpected results from the monsoon and solar insolation-influenced hypotheses. They include the redistribution of δ18O depleted rainfall from land to the western Pacific during times of weaker Summer Monsoon (Oppo and Sun, 2005), the influence of El Ni~no-Southern Oscillation(ENSO)activities(Jia et al.,2015; Yang et al., 2019), and the control of zonal and meridional ocean-atmosphere circulations (Zhang et al., 2020a). Whether the monsoonal influence associated with solar insolation or other forcing mechanism controlled on the low-latitude precipitation is still under debate. The reasons for these different opinions are complex, partly because of the different interpretations of the proxies.However,few continuous and high-resolution archives exist for the Holocene in the transitional region between subtropical and tropical zones, which is dominated by both monsoonal climates and tropical hydrological climates, and is closest to the moisture source, for example, the SCS and adjacent western tropical Pacific.
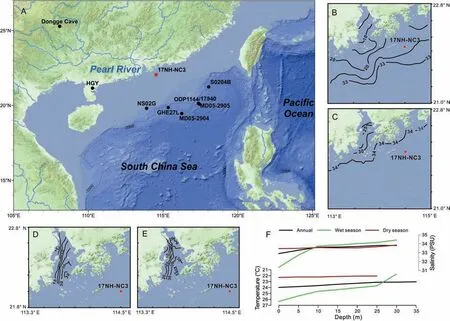
Fig.1 A)Location of the study site 17NH-NC3,and of other sites referred to in the text.B-E)Salinity distribution in the surface and bottom water during July 2000(wet season)and January 2000(dry season),revised from Dong et al.(2004).July 2000:(B)surface water,(C)bottom water.January 2000:(D)surface water,(E)bottom water.F)Statistical mean temperature and salinity profiles near core 17NH-NC3(22°07′30′′N and 114°22′30′′ E) between 1981 and 2010 CE from the World Ocean Atlas 2018 (https://www.nodc.noaa.gov/OC5/woa18/woa18data.html). Wet season means April to September. Dry season refers to October to March. PSU: Practical salinity units.
The northern coast of the South China Sea(NCSCS),near the eastern part of the Pearl River Estuary(PRE),with highly variable water conditions (especially salinity fluctuations),is a critical location for obtaining tropical precipitation records. This is in part because of its high sensitivity to the hydrological climate(Dong et al., 2004; Ou et al., 2009; Chen et al., 2017; Xu et al., 2019), high accumulation rates of sediments of both marine and terrestrial origin (Su, 2004; Zong et al., 2009, 2012; Liu et al., 2013; Lambeck et al.,2014;Wei et al.,2016;Hu et al.,2021),and because of its climate influenced by both monsoonal climate and tropical hydrological cycle (Koutavas and Joanides,2012; Yu et al., 2012; Zong et al., 2012; Strong et al., 2013; Chen et al., 2019; Zhang et al., 2020a).Here, we present high-resolution stable oxygen isotopes of planktonic and benthic foraminifera since 8260 cal yr B.P., from core 17NH-NC3 located in the NCSCS (Fig. 1), to reconstruct the high-resolution temporal precipitation changes since mid-Holocene in the tropical monsoon region, and then discuss possible forcing mechanisms.
2.Geological setting
The Pearl River(also named Zhujiang in Chinese)is the third longest river in China after the Yangtze River and the Yellow River. The Pearl River delivers an annual sediment load of 89 × 109kg into the SCS (Wei et al., 2016), through three sub-estuaries (Lingdingyang, Modaomen, and Huangmaohai). Lingdingyang,traditionally referred to as the PRE, is the largest estuary of the Pearl River, with an area of about 2000 km2, and receives over 50% of the water discharge (Su, 2004).
As a coastal water regime that connects with the Pearl River discharge and with the SCS,PRE and NCSCS(near the eastern part of PRE) have an estuarine gravitational circulation that is primarily forced by the river influx and tides, forming the thermohaline forcing between the buoyant river water and dense water(Dong et al., 2004; Ou et al., 2009). The PRE is macrotidal, and the tides have ~1.0 m magnitude inside the PRE (Mao et al., 2004). Moreover, the PRE and NCSCS area are located in a transitional region between the subtropical and tropical zone,dominated by monsoonal climates and the tropical hydrological climates. The total annual runoff in the Pearl River Basin is about half of the total annual precipitation(Niu, 2013). And the Pearl River discharge varies seasonably,with 77.8%of the water delivered into the PRE during the summer wet season (April to September) and only 22.2% during the dry season(October to March) (Su, 2004). The vertical profile of water regimes in the PRE and NCSCS vary seasonally.A distinct salinity stratification with a strong halocline is reported during the wet season(April and September),while the water mixes well during the dry season(October and March) (Fig. 1) (Dong et al., 2004; Ou et al., 2009; Chen et al., 2017; Xu et al., 2019). In contrast to the significant difference of salinity,there is a small difference (<2°C) between the surface and bottom water temperatures at the same time,and the annual temperature fluctuations are much less in the bottom waters than in the surface waters(Dong et al.,2004; Zhou et al., 2011).
The circulation in the PRE and NCSCS presents generally as a salt wedge estuary, in which the Pearl River discharge spreads seawards at the upper layer,and the heavy saline water intrudes at the bottom water, forming multiple plumes, which have a direct influence on the estuarine circulation and the NCSCS ecological environment(Chen et al.,2004;Dong et al.,2004; Harrison et al.,2008). The strong plume waters may extend down to depths of 10-20 m below the surface during the wet season (April to September),while the influence would be weaker during the dry season (October to March), when the brackish upper layer thins seawards (Dong et al., 2004; Shu et al.,2014).
The greater precipitation in the Asian Summer Monsoon region was caused by parcels from an ocean source (Muri et al., 2013; Liu et al., 2014; Cai et al.,2015). The air-mass back-trajectory analyses were calculated using the HYSPLIT V4.8 model and based on the NCEP/NCAR Reanalysis dataset from 2009 to 2019 during the summer season (July, August and September), to assess probable moisture sources and transport paths documented by core 17NH-NC3. The result shows that the precipitation-producing air parcels arrive at the core site largely from the western Pacific area (Supplementary file 2:fig. S1).
3.Material and methods
The core 17NH-NC3(22°03′06′′N and 114°32′18′′E,water depth 42.4 m) (Fig. 1) was drilled from the NCSCS area during a geological and geophysical expedition carried out by the Sun Yat-Sen University in September 2017,at a length of 84.28 m.Mainly used in this research were the upper 16.56 m of the core 17NH-NC3. The sediments of the upper 9.23 m mainly consist of grey clay and grey silty clay. The sediments from 9.23 m to 15.24 m are grey interbedded sandy silt and silty sand, which are interpreted as intertidal sediments. The sediments from 15.24 m to 15.84 m contain yellowish sand, while the sediments from 15.84 m to 16.56 m are characterized by a mottled clay layer.
3.1. Stable isotope analysis
A total of 390 sediment samples were selected from the upper 15.84 m of the core 17NH-NC3 at 4 cm intervals. After having been freeze-dried at −47°C,the dried sediment samples (about 23 g) were immersed in tap water for 24-48 h,and a few drops of H2O2were added for disaggregation. Then, the sediment samples were washed over a sieve with a meshsize of 0.063 mm. The residue in the sieve was drysieved into two size fractions (0.063-0.25 mm and>0.25 mm) after having been oven-dried at 60°C. All these steps were performed at Sun Yat-Sen University.
Well-preserved and intact Globigerinoides ruber and Cibicides lobatulus tests were picked from the>0.25 mm fraction of the sediment at about 4 cm interval. About 8-10 G. ruber and 8-10 C. lobatulus tests were selected from each sample for stable oxygen isotope analysis. After having been immersed in 10%H2O2for 12 h,the tests were ultrasonically rinsed with ethanol (≥99.7%) with a 40 kHz frequency three times, squashed carefully with a needle, and then were dried at 60°C. In total, 181 samples of G. ruber and 189 samples of C.lobatulus from the upper 7.71 m of core 17NH-NC3 were analyzed,providing an average temporal resolution of ca. ~80 years in the upper 2.23 m and ca.~30 years from 2.23 m to 7.71 m,using a GasBench II connected to a ThermoFisher Delta V Plus mass spectrometer after reacting with 100% phosphoric acid at 70°C.All isotope data were reported in terms of the Vienna Pee Dee Belemnite(VPDB)scale by assigning δ18O values of −2.2‰to NBS19 and −23.2‰to NBS18. Reproducibility for δ18O from G. ruber and C.lobatulus was 0.05% and 0.06%, respectively. Preparation of the samples and stable isotope analysis were performed at the GeoZentrum Nordbayern, Friedrich-Alexander-University Erlangen-Nürnberg, Germany.
3.2. Accelerator mass spectrometry 14C dating
A total of 16 samples were selected for accelerator mass spectrometry (AMS)14C dating (Table 1). Foursamples were consisted of well-preserved mixed benthic foraminifera species (at an average weight of 8-10 mg) picked from the sediment samples(>0.25 mm),and the other twelve samples were wellpreserved and intact shells. AMS14C dating analyses were performed at Beta Analytic Testing Laboratory,USA. The radiocarbon ages were calibrated using the CALIB 8.1.0 calibration programmer with the Marine 20 dataset (Heaton et al., 2020), after applying a−128 ± 40 years local reservoir correction (Southon et al.,2002).
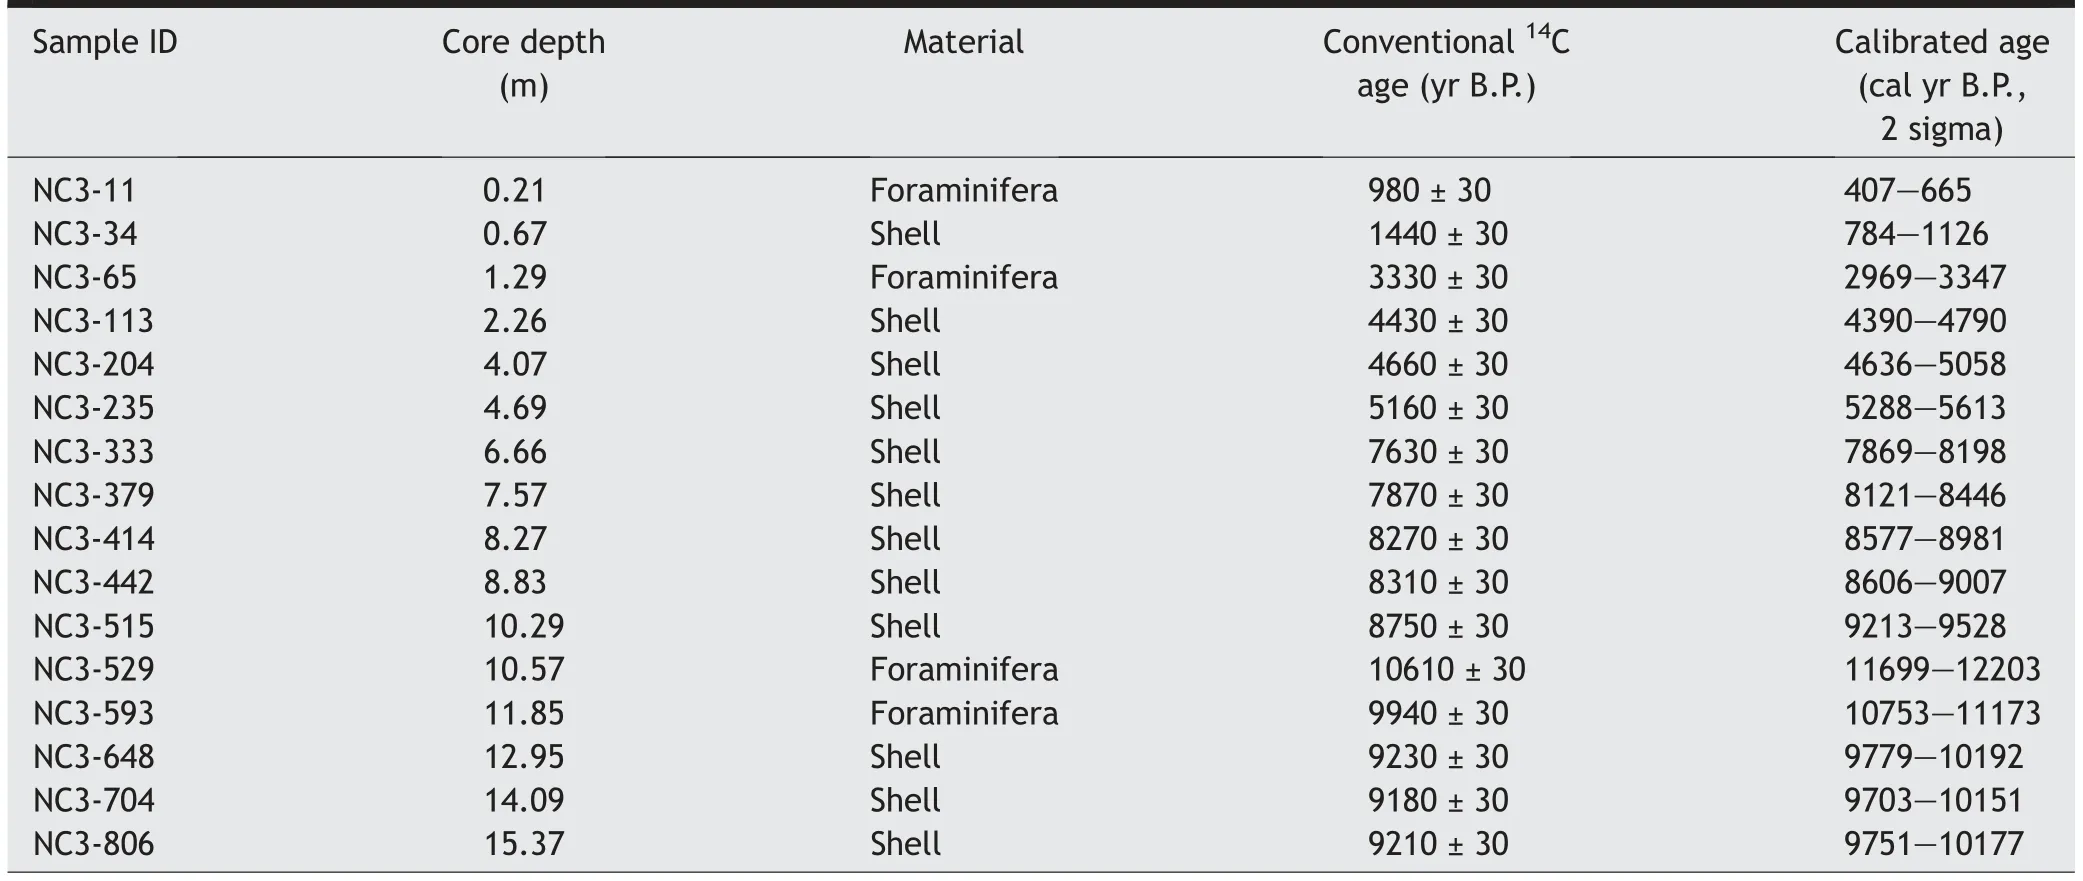
Table 1 AMS radiocarbon dates from core 17NH-NC3.
4.Results
4.1. Chronological framework
The mottled clay layer from 15.84 m to 16.56 m is considered to have been formed during the Last Glacial Maximum, which is widely distributed in the Pearl River Delta (PRD) and PRE (e.g., Zong et al.,2009; Liu et al., 2013). The AMS14C dating results of the core 17NH-NC3 are shown in Table 1. A chronological framework of the upper 15.84 m of the core was established with R package Bchron (Fig. 2) (Parnell et al., 2008). The results show that the upper 15.84 m of the core covers a continuous sedimentary succession of ~9990 cal yr B.P. (Fig. 2: fitting mean age). The top of the core corresponds to ~330 cal yr B.P. (Fig. 2: fitting mean age). Moreover, the results between 10.29 and 15.37 m in Table 1 suggest the AMS radiocarbon dates are disordered, and more details would be needed to verify the age-depth model during the early Holocene.However,this does not greatly impact our study, as we mainly focused on the time interval since 8260 cal yr B.P.(Fig.2:fitting mean age).
4.2. Stable oxygen isotope variations

Fig. 2 Age-depth model of core 17NH-NC3, established with R package Bchron(Parnell et al.,2008).The shadowed area indicates the 95% confidence intervals and the blue line shows the fitting mean ages. The black circles indicate the AMS 14C data, and the short lines next to the circles display the age errors.
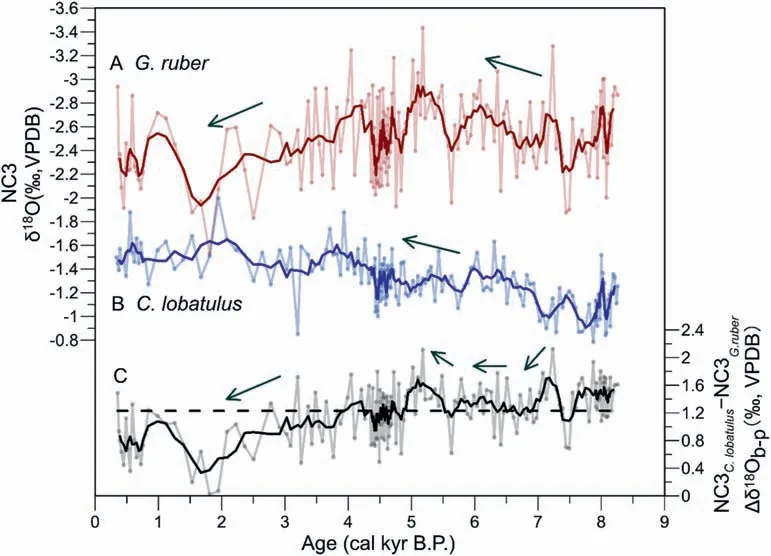
Fig.3 Planktonic and benthic foraminiferal δ18O records from core 17NH-NC3 since 8260 cal yr B.P.A)δ18OG. ruber;B)δ18OC. lobatulus;C)The difference between the benthic and planktonic δ18O(Δδ18Ob-p).Dark green arrows indicate trends.The black dashed line represents a median value of 1.23‰. All thick curves are 5-point running averages.
δ18O analyses of the benthic and planktonic foraminifera of core 17NH-NC3 display distinct differences not only with respect to trends in some time intervals,but also with respect to values (Fig. 3) (see Supplementary file 1 for the original δ18O data of 17NH-NC3). The benthic δ18O (δ18OC.lobatulus) data increase during 8260 to 7130 cal yr B.P., ranging from−1.25‰ at 8260 cal yr B.P. to −0.89‰ at 7130 cal yr B.P., and then the temporal fluctuations decrease since 7130 cal yr B.P.The planktonic δ18O(δ18OG.ruber)values indicate decreasing variation in amplitude between 8260 and 5180 cal yr B.P.,which is quite similar to the δ18OC.lobatulusvalues. The temporal trends of the benthic and planktonic δ18O values are different since 5180 cal yr B.P. The δ18OG.rubervalues gradually increase since 5180 cal yr B.P., punctuated with a heaviest value between~2000 and 1500 cal yr B.P.The δ18OG.rubervalues are much lighter than the benthic δ18O values,consequently,the Δδ18Ob-p(benthic minus planktonic)values mostly reflect the δ18OG.ruberdata.The Δδ18Ob-pvalues show a relatively stable amplitude between 8260 and 5180 cal yr B.P.,and the values are predominately >1.23‰ (median value) during this period, while the temporal trend of the Δδ18Ob-pvalues is consistent with the δ18OG.rubervalues since 5180 cal yr B.P.
5.Discussion
5.1. Vertical salinity stratification in the NCSCS since the mid-Holocene
The foraminiferal δ18O is controlled by the environmental conditions, mainly including temperature,and water δ18O(δ18Osw).As the latter usually needs to be calibrated from the local water δ18O (δ18Osw-local)using the ice volume (through the sea level), this means that the δ18Oswequals δ18Osw-localin the study area when the sea level is stable, such as during the middle to late Holocene (Kim and O'Neil, 1997;Lambeck et al.,2002;Toledo et al.,2007;Malaiz′e and Caleye,2009;Xiong et al.,2018;Khan et al.,2019).In addition, based on the modern observations, the δ18Oswis positively correlated with the salinity in different oceans and seas (LeGrande and Schmidt,2011), as well as in the SCS and Luzon Strait (Lin,2000; Ye et al., 2014). Therefore, for the sea surface planktonic foraminiferal δ18O in the NCSCS, the primary constraining factors since the mid-Holocene are the sea surface temperature and salinity(SSTand SSS).
Adopting the relationship function of δ18OG.ruber,SSTand δ18Osw,the δ18OG.ruberrecords are widely used to reconstruct the δ18Oswand then SSS variations,combined with SSTrecords.Much effort has been made to reconstruct SSTchanges near our study area,in both the northern SCS and the PRE, based on different proxies including the alkenones and foraminiferal Mg/Ca ratios. For example, the alkenone-based SST from cores NS02G (Kong et al., 2014), MD05-2905 (Zhou et al., 2012), MD05-2904 (He et al., 2008), and 17940(Wang et al.,1999)in the northern SCS and from cores HKUV16 (Kong et al., 2014) and HKUV11 (Wu et al.,2017)in the PRE,as well as the Mg/Ca-based SST from core GHE27L and core S0204B (Yang et al., 2019).Despite discrepancies existing in the pattern and details, the amplitude is less than 2°C since 9000 cal yr B.P., indicating a unified and relatively stable condition in the study area.Since the fluctuations of the SST were limited, the overall trend of δ18OG.rubercannot be a response to the SST variations, so the SSS can be regarded as the major environmental variable for the δ18OG.ruberin the NCSCS.Therefore,the changes in the δ18OG.rubervalues imply changes of SSS in the NCSCS,which means relatively higher SSS results in heavier local δ18Oswand δ18OG.ruber, and vice versa. This also applies to the situation in the northern SCS(e.g.,Yang et al.,2019).
Moreover, the nearest record from our sampling site,the alkenone-based SSTof core HKUV11(22°12′N,113°53′E)(Wu et al.,2017)(Supplementary file 2:fig.S2B)was assumed to be SST values in our study area,to evaluate the relative relationship between δ18Oswvariations and our δ18OG.ruberrecords(Supplementary file 2). The result shows that the δ18Oswcurve(Supplementary file 2:fig.S2C)almost shares a similar pattern with the δ18OG.rubercurve in core 17NH-NC3(Supplementary file 2: fig. S2A) since the mid-Holocene. The δ18Oswresult might not be accurate,as discrepancies between the Mg/Ca-based SST and alkenone-based SST records. However, the similar patterns between the δ18Oswcurve and our δ18OG.rubercurve could partly support our proposal.
Furthermore, the same logic we used above can also be adapted to the benthic foraminifera in the NCSCS. According to modern observations in the PRE,besides the very small difference(<2°C)between the surface and bottom temperatures at the same time,the annual temperature fluctuations are much less in the bottom waters than in the surface waters (Dong et al., 2004; Zhou et al., 2011). This means that the temperature effect on the δ18OC.lobatulusshould be smaller than on the δ18OG.ruberin the records of core 17NH-NC3. As a result, the sea bottom salinity (SBS)can be considered as the primary factor affecting δ18OC.lobatulus, and in return, the δ18OC.lobatulusvariations indicate the changes of SBS in the NCSCS.Therefore, the difference between δ18OG.ruberand δ18OC.lobatulus(Δδ18Ob-p) can be used to identify the relative vertical difference in water salinity, and the Δδ18Ob-precord can be used to evaluate fluctuations in vertical salinity differences through time.
As shown in Fig. 3C, the Δδ18Ob-pvalues are all above zero since 8260 cal yr B.P. in core 17NH-NC3,implying that a relatively stable vertical salinity difference exists between surface and bottom water in the NCSCS, which points to a salinity stratification throughout that period. In addition, the Δδ18Ob-precord can be divided into two stages, separated by~5180 cal yr B.P.During the stage~8260 to 5180 cal yr B.P., the values are generally higher than 1.23‰,indicating a higher degree of salinity stratification,whereas in the other stage the values are relatively lower, suggesting a decreased amplitude of the variation of salinity stratification.
5.2. Low-latitude precipitation changes since the mid-Holocene
In the transitional zone between SCS and PRD,the water regimes in the PRE and NCSCS are governed by both the fresh waters from the Pearl River and the saline waters from the SCS. The lighter fresh waters from the Pearl River spread at the top of the heavier saline water from the SCS and thin seawards,whereas the heavier saline waters extend landwards in the lower layer. Under the effect of mixing, plumes form and directly influence the estuarine circulation and coastal ecological environment in the PRE and NCSCS(Chen et al., 2004; Dong et al., 2004; Harrison et al.,2008). Based on present-day observations, strong plume waters may extend down to depths of 10-20 m below the surface during the wet season (April to September), while the influence would be weaker during the dry season (October to March), when the brackish upper layer thins seawards(Dong et al.,2004;Shu et al., 2014).
According to relative sea-level reconstructions based on the high-quality sea-level index points in the northern SCS(Xiong et al.,2018),the local relative sea level was>−10 m compared with the present mean sea level since 8260 cal yr B.P. This is also supported by paleo-records from Zong et al. (2013) and numerous model simulations(Peltier et al.,1994;Bradley et al.,2016;Sun et al.,2016;Khan et al.,2019).As the water depth of core 17NH-NC3 is ~40 m at present, and the elevation is >−10 m from mean sea level since 8260 cal yr B.P. (Zong et al., 2013; Sun et al., 2016;Xiong et al., 2018), the water depth of our sampling site should be>30 m since 8260 cal yr B.P.Considering the depth influence of the plume was limited to the upper 20 m,the fresh discharge barely influenced the bottom water.Thus,the bottom water at the core site might have been mainly controlled by intruded marine waters,and our δ18OC.lobatulusrecords then reflect the marine environment since 8260 cal yr B.P.To verify this viewpoint, we compared the δ18OC.lobatulusvalues in core 17NH-NC3 with the planktonic foraminiferal δ18O records from nearby sites in the northern SCS,including 17940 (Wang et al., 1999), ODP site 1144(Wei et al.,2007),and S0204B(Yang et al.,2019).The results show that all these records in other sites display a consistently negative trend, which agrees well with our record(Fig.4),supporting our view that the δ18OC.lobatulusrecord in core 17NH-NC3 can be considered as a proxy of oceanic conditions since 8260 cal yr B.P.
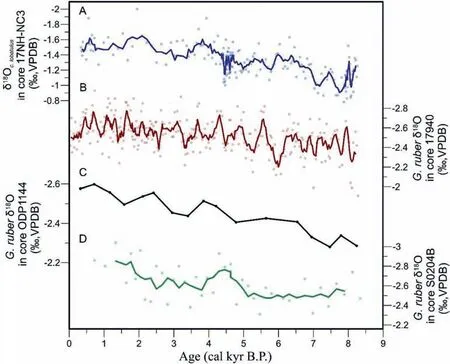
Fig.4 Comparison of data from core 17NH-NC3 and other records in the SCS.A)δ18OC. lobatulus in core 17NH-NC3;B)δ18O of G.ruber in core 17940(Wang et al.,1999);C)δ18O of G.ruber in core ODP1144(Wei et al.,2007);D)δ18O of G.ruber in core S0204B(Yang et al.,2019).In A,B and D, thick curves show 5-point running averages.
The respective impacts of the intruded marine water on the surface layer and the bottom layer in the study area are unclear.However,the influence for these two layers should be almost equal,considering the deepest water depth of our sampling site is~40 m(Dong et al.,2004;Xiong et al.,2018).Therefore,the vertical salinity stratification recorded in core 17NHNC3 was mainly caused by fluctuations in the SSS,which resulted from the large amounts of plume waters in the surface layer, under a relatively stable sea-level background (Zong et al., 2013; Sun et al.,2016; Xiong et al., 2018; Khan et al., 2019). The plume size is significantly correlated with the river discharge, and the correlation coefficient can reach as high as 0.85 in summer (with large amounts of precipitation) (Ou et al., 2009), with the river discharge being highly correlated with the precipitation (Chen et al., 2004; Dong et al., 2004; Dai et al., 2008; Niu, 2013), i.e., runoff to rainfall ratio of approximately 0.5 (Niu, 2013). In summary, the salinity stratification recorded in our Δδ18Ob-precord in the NCSCS since 8260 cal yr B.P.contributes to the high low-latitude precipitations. Stronger salinity stratification is related to surface water freshening and lower SSS, resulting from higher precipitation.Moreover, our viewpoint was supported by the modern hydrological observations (Dong et al., 2004; Ou et al., 2009; Ye et al., 2014; Chen et al., 2017; Xu et al., 2019). For example, Dong et al. (2004)pointed out that the vertical salinity profiles vary seasonally in the PRE and outer PRE.During July 2000(wet season)with large amounts of precipitation,the salinity of the surface and bottom waters in our sampling site was<25 PSU and>34 PSU,respectively,and the water was strongly stratified.During January 2000 (dry season), the water mixed well, and little salinity differences existed in the vertical profile at the location of core 17NH-NC3, as the rainfall and runoff was greatly reduced. Ye et al. (2014) also reported the linear relationship between the modern δ18Oswwith salinity in the marginal China sea,including the northern SCS, was mainly caused by great freshwater contribution.
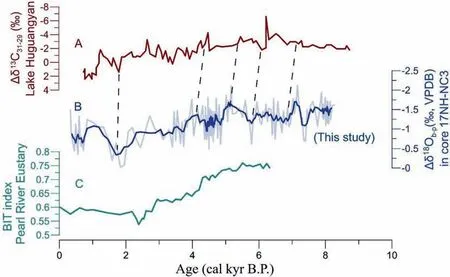
Fig. 5 Comparison of data from core 17NH-NC3 and other records. A) The leaf wax n-alkane Δδ13C31-29 values recorded from Lake Huguangyan(Jia et al.,2015);B)The Δδ18Ob-p values in core 17NH-NC3; thick curves show 5-point running average values;C)The branched and isoprenoidal tetraether (BIT) record in the PRE (Strong et al., 2013). Dashed lines represent the tied points between A and B.
Thus, the trend of Δδ18Ob-pvalues could indicate the temporal change of the low-latitude precipitation.Higher Δδ18Ob-pvalues suggest stronger precipitation,while a decrease of Δδ18Ob-pvalues implies weaker precipitation. The precipitation changes in the lowlatitude area could also be divided into two stages,according to the extent of salinity stratification. During 8260 to 5180 cal yr B.P., the Δδ18Ob-pvalues are generally above 1.23‰, and the temporal trend is towards heavier values, followed by lighter values, suggesting a large amount of precipitation, punctuated with a decreased and then increased trend. The branched and isoprenoidal tetraether (BIT) record in the PRE shows several peak values between~6320 and 5170 cal yr B.P. (Strong et al., 2013) (Fig. 5C), suggesting a high quantity of terrestrial-sourced organic matter delivered to the PRE, under the influence of large runoff, as reported in our study. Whereas, since 5180 cal yr B.P.,the Δδ18Ob-pvalues are mainly below 1.23‰, implying weaker precipitation than between 8260 and 5180 cal yr B.P. The decrease and trend to overall heavier values of Δδ18Ob-p, respectively indicate the gradually weaker precipitation since 5180 cal yr B.P., and a sub-interval precipitation fluctuation is recognized based on the lowest values of Δδ18Ob-pbetween ~2000 and 1500 cal yr B.P. The gradually weaker precipitation revealed in our study is supported by the BIT records in the PRE(Strong et al.,2013). In addition, the leaf wax n-alkane Δδ13C31-29values recorded from Lake Huguangyan (Fig. 5A) suggest a palaeoclimatic trend towards wetter and warmer conditions between~9200 and 6500 cal yr B.P.,which turned into a trend towards the drier and cooler conditions in the late Holocene(Jia et al.,2015).This is broadly consistent with our Δδ18Ob-pvariations,within the age uncertainty errors.
5.3. Possible causes of the changes in lowlatitude precipitation since the mid-Holocene
The large-scale tropical atmospheric circulation between the Eurasian continent and the Indian-Pacific oceans plays significant roles in the hydrological cycle in the region affected by the Asian Summer Monsoon.The effect includes the amounts and routes of water vapor onto land but is not limited to it (Muri et al.,2013; Liu et al., 2014; Cai et al., 2015). Monsoonal moisture balance on millennial time-scales in the Holocene has been regarded as reflecting changes in the seasonality of solar insolation and shifts in the position of the Intertropical Convergence Zone(ITCZ)(Selvaraj et al., 2007; Jin et al., 2014). During the Holocene,Northern Hemisphere insolation has become less seasonal,following a decreased change of the capacity of the northern summer solar insolation (Fig. 6A), which is usually associated with a general southward shift of the ITCZ (Haug et al., 2001; Fleitmann et al., 2007).The southern shift of the ITCZ may cause a weaker Asian Summer Monsoon, which was usually combined with less summertime precipitation in low-latitude areas, including the SCS and southern China (Dykoski et al., 2005; He et al., 2008; Tierney et al., 2010).This is supported by the eutrophic peat/mud sequences from southern China (Zhou et al., 2004), as well as the stalagmite δ18O records in the Dongge cave(Fig. 6B), which suggested a gradually decreased East Asian Summer Monsoon intensity since mid-Holocene(Dykoski et al., 2005). Wang et al. (2016b) also speculated that the precipitation in low latitudes was primarily controlled by the Asian Summer Monsoon,based on the clear difference between planktonic foraminiferal δ18O records from SCS and LR04 stack benthic foraminiferal δ18O records.
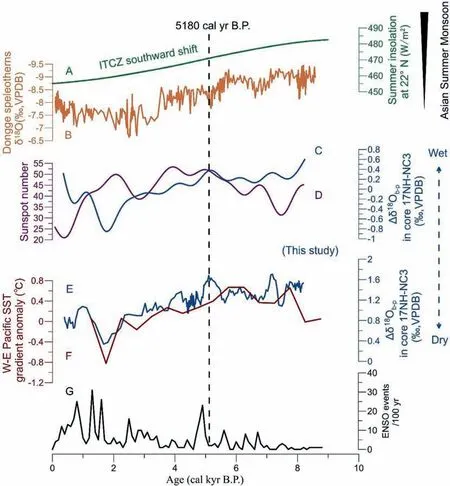
Fig. 6 The Δδ18Ob-p records in core 17NH-NC3 compared with summer insolation and the thermal state of the tropical Pacific. A) Summer insolation at 22° N in the Northern Hemisphere(Laskar et al.,2004);B)The stalagmite δ18O record in the Dongge cave(Dykoski et al.,2005);C)The Δδ18Ob-p records in core 17NH-NC3,Gaussian Kernel lowpass filtered using a 1000-year timescale;D)Sunspot record based on datasets of 10Be and 14C(Wu et al.,2018),Gaussian Kernel lowpass filtered using a 1000-year timescale;E)The Δδ18Ob-p records in core 17NH-NC3(5-point running average values);F)The zonal SST gradient in the equatorial Pacific(Koutavas and Joanides,2012);G)ENSO events per 100 years(Moy et al., 2002). The black dashed line represents the 5180 cal yr B.P.

Fig. 7 The continuous wavelet power spectrum (Grinsted et al., 2004) of Δδ18Ob-p records in core 17NH-NC3. The thick black contour designates the 5% significance level against red noise and the cone of influence where edge effects might distort the picture is shown as a lighter shade. The red dashed box reveals a period of ~1000 years before ~5000 cal yr B.P.
However,our Δδ18Ob-precord(Fig.6E)are generally above 1.23‰,suggesting relatively stable large amounts of precipitation during 8260 to 5180 cal yr B.P.,when the Asian Summer Monsoon became weaker. Different results based on foraminiferal δ18O records have also been reported in other studies.For instance,during stronger summer monsoon phases, heavier planktonic foraminiferal δ18O values were reported, based on the comparison between model simulation and sediment records(Oppo and Sun,2005;Oppo et al.,2007).During weak summer monsoon phases,the δ18O of surface sea water in the Makassar Strait, to the south of the SCS,displays the lightest value(Oppo et al.,2009).Moreover,our Δδ18Ob-precords display a wetter-wet-wetter-arid climate pattern, rather than a long-term decrease in summertime precipitation during the mid-Holocene.The wetting and warming trend in the mid-Holocene is also recorded by the decreased variations of leaf wax nalkane Δδ13C31-29values recorded from Lake Huguangyan(Jia et al.,2015)and by pollen records from southern China(Zhao et al.,2009).
Otherwise, present studies theorized that the sun activities might play an important role in controlling the hydroclimate changes,including the low latitudes(e.g., Dykoski et al., 2005; Shi et al., 2019; Zhang et al., 2020b). The continuous wavelet power spectrum (Grinsted et al., 2004) of our Δδ18Ob-precords reveals a period of~1000 years before~5000 cal yr B.P.(Fig.7).The 1000-year cycle is comparable to the Eddy cycle (around 1000 years) of sunspots (Abreu et al.,2010; Steinhilber et al., 2012; Wu et al., 2018), indicating the possible influence of solar irradiance/sunspots on the hydrological dynamics in low latitudes during the mid-Holocene. The comparison between the Gaussian Kernel lowpass filtered sunspots number(Wu et al., 2018) curve (Fig. 6D) and the Δδ18Ob-precord in core 17NH-NC3 (Fig. 6C) demonstrates good consistency characteristic during the mid-Holocene on millennial scale, while no clear correlation existing since the mid-Holocene. Thus, our Δδ18Ob-precords imply solar irradiance/sunspots impact during the mid-Holocene on a millennial scale, and weak influence of sunspots since the mid-Holocene in the tropical monsoonal regions,while some studies highlighted the influence of sunspots during the late Holocene (e.g.,Zhang et al., 2020b).
These inconsistent tendencies highlight that the hydrological climate in low latitudes may be related to other forcing mechanisms, besides solar insolation and sun activities since the mid-Holocene.Different explanations have been put forwards.For example,different interpretations of the planktonic foraminiferal δ18O(the redistribution of δ18O depleted rainfall from land to the western Pacific during times of weaker summer monsoon)(Oppo and Sun,2005),the influence of ENSO activities (Jia et al., 2015; Yang et al., 2019), and the control of zonal and meridional ocean-atmosphere circulations (Zhang et al., 2020a). However, much morework isneededtotrack the mechanismresponsible for low-latitude precipitation changes since the mid-Holocene, especially in the transitional region between subtropical and tropical zones.
The remarkable consistency between the variations of our Δδ18Ob-pwith the zonal SST gradient,which was calculated as the difference of the western and eastern Pacific mean state of the tropical Pacific(Koutavas and Joanides, 2012) (Fig. 6F), may suggest that the low-latitude precipitation changes since 8260 cal yr B.P. were in accordance with the tropical atmosphere-ocean dynamics stimulated by tropical zonal SST changes, analogous to the ENSO events(Fig. 6G).
The mechanisms about how the ENSO events affect the amounts of low-latitude precipitation have been discussed (e.g., Ichiyanagi and Yamanaka, 2005; Tan,2014; Cai et al., 2017; Sun et al., 2018). One hypothesis invokes variation in the convection intensity in the moisture-source region with the different frequency of ENSO events attributing to the precipitation changes in the Asian Summer Monsoon region (Cai et al., 2017;Ruan et al., 2019). While others suggest that the changes in the proportions of moisture from the Pacific to the Indian Ocean during El Ni~no events are responsible (e.g., Tan, 2014). However, all emphasized that in low latitudes precipitation during El Ni~no events is lower than during La Ni~na events(Tan,2014;Cai et al.,2017; Sun et al., 2018).
The zonal SST asymmetry between the cold eastern and warm western Pacific is an essential indicator of the ocean-atmosphere coupling. When the zonal SST gradient is stronger during the La Ni~na phases, the warmer SSTs in the western tropical Pacific enhance the East Asian Walker circulation,and then force the center of the warm pool of the western Pacific to extend to eastern Asia. This increases the interaction of atmospheric convection around the northern low-latitude areas, including southern China and SCS, leading to more precipitation in this region. When during El Ni~no phases,the SSTs in the western tropical Pacific is lower than in the eastern Pacific, the inverse occurs (Klein et al., 1999; Clement et al., 2000). Numerous modern observations and model simulations revealed that drought events would occur in South China and SCS during the El Ni~no phases, while the stronger precipitations occur during the La Ni~na phases(e.g.,Huang and Wu,1989;Gao and Wang,2012;Xu et al.,2016).In addition, the record of landfalls of tropical cyclones also supports that annual precipitation is reduced during El Ni~no phases and increased during La Ni~na phases(Wu et al., 2004). Polissar et al. (2013) also suggested that such a linkage between precipitation and El Ni~no phases as well as La Ni~na phases would be pervasive throughout the Holocene in the outer-tropical Andes.
Between 8260 and 5180 cal yr B.P.,the higher W-E SST gradient in the equatorial Pacific reported by Koutavas and Joanides(2012)(Fig.6D)suggests a more sustained La Ni~na-like mean state, leading to large precipitation in low latitudes.The La Ni~na-like pattern in the western Pacific during mid-Holocene was also pointed out by the coupled ocean-atmosphere models of a study of global upper ocean evolution during the Holocene(Liu et al.,2000,2003).Since 5180 cal yr B.P.,the W-E SST gradient in the equatorial Pacific(Fig.6D)generally decreased, implying an El Ni~no-like mean state, causing less precipitation in the study area.Moreover, numerous model simulations and paleorecords spanning the equatorial Pacific indicate that the strength and frequency of ENSO events increased during the late Holocene (Fig. 6E) (Moy et al., 2002;Woodroffe et al., 2003; McGregor and Gagan, 2004;Polissar et al.,2013).The smallest W-E SST gradient in the equatorial Pacific and the highest frequency of ENSO events might make contributions to the subinterval lowest precipitation fluctuation recognized between ~2000 and 1500 cal yr B.P. Thus, we propose that the precipitation at low latitudes was adjusted by the SST gradient of the tropical zone,besides the solar insolation and sun activities, which was also pointed out by Jia et al.(2015).The more sustained La Ni~na-like state caused large precipitation between 8260 and 5180 cal yr B.P., while the increased ENSO events contributed to less precipitation since 5180 cal yr B.P.
6.Conclusions
Based on a comparison of δ18O values of planktonic and benthic foraminifera proxy of the core 17NH-NC3,we suggest that the variation of the Δδ18Ob-pcan be used as a proxy of the relative amplitude of the salinity variations between the sea bottom and the surface waters,which is caused by a large amount of precipitation.The overall trend of the Δδ18Ob-pvalues indicates the temporal variations of precipitation.Based on the Δδ18Ob-precords, a large amount of low-latitude precipitation was suggested between 8260 and 5180 cal yr B.P., followed by weaker precipitation since 5180 cal yr B.P.The inconsistent tendencybetween our records and the solar insolation and sun activities suggests that the hydrological climate at low latitudes is linked with other forcing mechanisms besides the solar insolation and sun activities. The tropical atmosphere-ocean dynamics stimulated by the SST changes of the tropical zone,analogoustotheENSOevents,mightprimarilyadjustthe low-latitude precipitation.
Appendix A. Supplementary data
Supplementary data to this article can be found online at https://doi.org/10.1016/j.jop.2022.05.001.
Availability of data and material
The data of the manuscript is provided in the Supplementary file 1.
Authors' contributions
YQW conceived the idea of the study,performed the experiment and the data analysis, and drafted the manuscript.XQY drilled the core,conceived the idea of the study, participated the statistical analysis with constructive discussions, and helped to modify the manuscript. JY participated in the statistical analysis and helped to modify the manuscript. FTF helped perform the experiment with helpful discussion and helped to modify the manuscript.TWZ participated in the data analysis.CLL helped to modify the manuscript.All authors read and approved the final manuscript.
Funding
This work was supported by Guangdong Province Introduced Innovative R&D Team of Geological Processes and Natural Disasters around the South China Sea (Grant no. 2106ZT06N331), the National Natural Science Foundation of China(Grant no.41872217),and Innovation Group Project of Southern Marine Science and Engineering Guangdong Laboratory (Zhuhai)(Grant no. 311021004).
Conflicts of interest
The authors declare that they have no competing interests.
Acknowledgements
We thank the anonymous reviewers for their valuable comments on this manuscript. We also thank the editor, Xiu-Fang Hu, for detailed and helpful editing.We acknowledge support from the China Scholarship Council (CSC) during the research stay of YQW in Erlangen (File no. 201906380105).
Abbreviations
AMSAccelerator mass spectrometry
BITBranched and isoprenoidal tetraether CECommon Era
ENSO El Ni~no-Southern Oscillation
ITCZIntertropical Convergence Zone
NCSCS Northern coast of the South China Sea PRDPearl River Delta
PREPearl River Estuary SBSSea bottom salinity SCSSouth China Sea
SSSSea surface salinity SSTSea surface temperature VPDB Vienna Pee Dee Belemnite
杂志排行
Journal of Palaeogeography的其它文章
- Clay mineral formation and transformation in non-marine environments and implications for Early Cretaceous palaeoclimatic evolution:The Weald Basin, Southeast England
- Intensive peatland wildfires during the Aptian-Albian oceanic anoxic event 1b:Evidence from borehole SK-2 in the Songliao Basin, NE China
- Petrography and tectonic provenance of the Permian Tunas Formation: Implications on the paleotectonic setting during the Claromec′o Foreland Basin evolution, southwestern Gondwana margin, Argentina
- Diagenetic mineralogy and its effect on the reservoir properties of the sandstones of the Permian of S120 block (Sulige gas field), Ordos Basin, NW China
- Origin of soft-sediment deformation structures in Nihewan Basin
- Research status of lacustrine mudrock deposition constrained from astronomical forcing
