Preoperative contrast-enhanced computed tomography-based radiomics model for overall survival prediction in hepatocellular carcinoma
2022-08-18PengZhanDengBiGengZhaoXianHuiHuangTingFengXuZiJunChenQiuFengWeiXiaoYiLiuYuQiGuoShengGuangYuanWeiJiaLiao
Peng-Zhan Deng, Bi-Geng Zhao, Xian-Hui Huang,Ting-Feng Xu, Zi-Jun Chen, Qiu-Feng Wei, Xiao-Yi Liu, Yu-Qi Guo, Sheng-Guang Yuan, Wei-Jia Liao
Abstract
Key Words: Hepatocellular carcinoma; Radiomics; Contrast-enhanced computed tomography; Survival prediction
lNTRODUCTlON
Primary liver cancer is the sixth most common malignancy and the third leading cause of cancer-related mortality in the world. Hepatocellular carcinoma (HCC) accounts for 75%-85% of primary liver cancers[1]. Presently, the main therapies for HCC include surgical resection, local ablation, interventional embolization and liver transplantation. For HCC patients with early-stage disease, hepatectomy and liver transplantation are the mainstay curative treatments. Due to the insidious onset and lack of evident clinical symptoms in the early stage, patients with HCC are often diagnosed at an advanced stage. Even after surgical resection, the prognosis of HCC patients remains poor due to postoperative recurrence and metastasis. It has been reported that the recurrence rate within 5 years reaches 60%[2].
Alpha-fetoprotein (AFP) has been widely applied as a biomarker of HCC for diagnosis, monitoring treatment response, assessing prognosis and detecting early recurrence. However, the specificity of AFP for diagnosing HCC is 99%-100%, but the sensitivity is only 20% to 45%[3]. Moreover, nearly 31% of patients with HCC are AFP negative[4]. Therefore, AFP still has limitations as a biomarker of HCC. It has been reported that the tumour microenvironment is closely related to the initiation and progression of HCC[5]. Recent studies have shown that a high density of tumour-infiltrating lymphocytes is associated with favourable outcomes[6]. The neutrophil-to-lymphocyte ratio (NLR) was reported to be an independent prognostic factor for patients with HCC[7,8].
Radiomics is a new method of medical image analysis that uses a series of data-mining algorithms or statistical analysis tools for the high-throughput extraction of quantitative metric features[9,10] to obtain prognostic and predictive information for clinical decision support. It has been recognized that intratumor heterogeneity is often associated with tumour subtyping and can significantly impact prognosis and response to treatment[11,12]. Traditional radiological analysis is mainly based on nakedeye observation, which primarily focuses on tumour size and anatomical location but ignores intratumor heterogeneity. Radiomics features are able to provide a comprehensive overview of intratumor heterogeneity in a noninvasive manner[13]. Several recent studies indicate that radiomics features may potentially be a useful diagnostic and prognostic biomarker in liver cancer and other tumour types[14-16].
Due to the insufficiency of accurateness and objectiveness for prognostic markers in the prognostic evaluation of HCC patients, a precise and reliable tool to predict the prognosis of HCC patients is urgently needed. In the present study, we aimed to develop and validate a model based on contrastenhanced computed tomography (CECT) images and clinical-pathologic characteristics to predict the overall survival (OS) of HCC patients.
MATERlALS AND METHODS
This study was composed of the following steps: (1) Patient recruitment and data collection; (2) CECT image acquisition, tumour segmentation, region of interest (ROI) selection, radiomics feature extraction and radiomics signature construction; (3) The radiomics signature and clinical-pathologic characteristics were combined to build a predictive model and visualizedviaa nomogram; and (4) Evaluation of the predictive model using receiver operating characteristic (ROC) curves, calibration curves, decision curve analysis (DCA) and Kaplan-Meier curves.
Patients
This retrospective study was approved by the research ethics committee of the Affiliated Hospital of Guilin Medical University and conducted in accordance with the Declaration of Helsinki. Informed consent was obtained from all patients.
A total of 208 HCC patients who underwent radical resection at the Affiliated Hospital of Guilin Medical University with pathologically confirmed HCC were recruited from January 2014 to September 2017. Among them, 150 individuals fulfilled the inclusion and exclusion criteria (Figure 1). Radical resection was defined as a completed resection of the tumour mass with pathologically confirmed negative margins and no residual tumour or new lesion observed in two observations at an interval of no less than 4 wk. All tumour tissue samples were diagnosed by at least two experienced pathologists independently. All patients underwent CECT scans and haematological examinations before surgery.The 150 enrolled HCC patients were randomly divided into a training cohort (n= 107) and a validation cohort (n= 43) at a ratio of 2.5:1. Demographic and clinical-pathologic data were collected from medical records, including age, sex, alanine aminotransferase, AFP, American Joint Committee on Cancer tumor,node and metastasis (TNM) stage, Barcelona clinic liver cancer (BCLC) stage, hepatitis B surface antigen(HBsAg) and NLR.
Each patient was followed upviaoutpatient review. Routine postoperative examinations, including routine blood tests, liver function tests, renal function tests, serum AFP levels and abdominal ultrasonography, were performed every 2 mo after surgery within 2 years and then every 6 mo thereafter. A CECT scan was recommended if the examination results were abnormal or tumour recurrence was suspected. For patients who did not attend the follow-up visit, follow-up information was obtained by phone. OS was defined as the time from surgery to death or the last follow-up date, while disease-free survival (DFS) was defined as the time from surgery to tumour first intrahepatic and/or extrahepatic recurrence, death, or the last follow-up date.
CECT scan protocols and image preprocessing
Abdominal CECT scans were performed with two scanners: A Lightspeed VCT XT (GE Healthcare,United States) and an Optima CT660 (GE Healthcare, United States). The scanner was operated in cine mode, and the parameters were as follows: tube voltage of 120 kV, automatic tube current modulation with noise index of 8, tube rotation speed of 600 ms, pitch of 0.985:1, collimator of 0.625 mm. Iopromide(Ultravist 300, Bayer-Schering Pharma, Germany) was given intravenously in a volume of 1.5 mL/kg at a rate of 4 mL/sviathe antecubital vein. The slice thickness and interval of the arterial and portal venous phase images was 5 mm. All images were reconstructed into images with a 1.25 mm slice thickness and 1.25 mm interval. All data were transferred to an advanced workstation (AW 4.7).
All CECT images in this study met the criteria delineated by the American Association for the Study of Liver Disease guidelines[17]. CECT images were exported in digital imaging and communication in medicine (DICOM) format from the picture archiving and communication system database. All DICOM images were converted to neuroimaging informatics technology initiative format by the SimpleITK package (version 1.2.0) of Python software (version 3.7).

Figure 1 Flowchart of the patient selection process. HCC: Hepatocellular carcinoma; CECT: Contrast-enhanced computed tomography.
Radiomics analysis and radiomics signature construction
Tumour segmentation was performed by 3D Slicer software (version 4.11.20210226). ROIs were drawn on each layer of the tumour in the horizontal plane from the upper boundary to the lower boundary.Tumour lesions were semiautomatically outlined on all arterial phase and portal venous phase images,and manual corrections were implemented whenever necessary. The images were reviewed independently by two blinded radiologists with 7 and 8 years of experience, and a third radiologist resolved any discrepancies. For patients with multiple tumours, only the largest tumour was selected.
CECT image normalization and radiomics feature extraction were conducted by the Pyradiomics package (version 3.0.3) of Python software. The radiomics features extracted from ROIs included first order features, shape features (2D and 3D), gray level co-occurrence matrix features, gray level size zone matrix features, gray level run length matrix features, gray level dependence matrix features and neighbouring gray tone difference matrix features. Due to the large number of features, dimensionality reduction was essential. The least absolute shrinkage and selection operator (LASSO) algorithm with a 10-fold cross-validation approach was used to reduce the data dimension in the training cohort.Afterwards, the radiomics score, which was defined as the radiomics signature, was generated by linearly combining the selected radiomics features and their weighted coefficients. The workflow of radiomics analysis and radiomics signature construction is shown in Figure 2A. Afterwards, the concordance index (C-index) and ROC curve analysis were used to estimate the predictive value of the radiomics signature for 1-, 3- and 5-year OS.
Selection of the optimal cut-off value for NLR
According to our previous study[18], the optimal cut-off value for NLR in predicting the prognosis of HCC patients after curative resection was 2.31, which had both maximum sensitivity and specificity[area under the curve (AUC) = 0.723, 95%CI: 0.664-0.777].
Statistical analysis
Normality of distributions was tested by the Shapiro-Wilk test. Clinical-pathologic characteristics were compared by Student’sttest and are presented as the mean ± SD for continuous variables conforming to a normal distribution. Nonnormally distributed continuous variables were compared using the Wilcoxon signed rank test and are presented as the median with interquartile range. Categorical variables were compared using the Pearsonχ2test. Univariate and multivariate regression analyses were performed in the training cohort using the Cox proportional hazards model to identify the independent predictors for nomogram construction. The rms and regplot packages were used to establish a nomogram and calibration curve. The ROC curve analysis was performed using the timeROC package. The C-index, ROC curve and calibration curve were used to assess the accuracy of the nomogram. The Kaplan-Meier method and log-rank test were conducted to compare the different survival rates between the low- and high-risk subgroups in different cohorts. We built two predictive models based on BCLC and TNM staging systems. Patients were categorized into stage 0, stage A, stage B and stage C according to BCLC staging system; grade I, grade II, grade III and grade IV according to TNM staging system. DCA was conducted to compare the abovementioned two traditional staging systems with the nomogram. All statistical analyses were performed using SPSS software (version 24.0)or R software (version 4.1.2) and accepted as significant atP< 0.05.

Figure 2 Workflow of model construction and validation. A: Contrast-enhanced computed tomography image acquisition, tumour segmentation, region of interest selection, radiomics feature extraction and radiomics signature construction; B: Combination of the radiomics signature and clinical-pathologic characteristics to build the predictive model, the model was visualized via nomogram; C: Evaluation of the predictive model by using receiver operating characteristic curves,calibration curves, decision curve analysis curves and Kaplan-Meier curves. CECT: Contrast-enhanced computed tomography; ROI: Region of interest; AFP: Alpha fetoprotein; NLR: Neutrophil-to-lymphocyte ratio; OS: Overall survival; ROC: Receiver operating characteristic; AUC: Area under the curve; DCA: Decision curve analysis; BCLC: Barcelona Clinic Liver Cancer.
RESULTS
Demographic and clinicopathological characteristics
A total of 150 HCC patients were enrolled in this study according to inclusion and exclusion criteria,with an average age of 49.9 years (range, 20-75 years), and 130 patients were male. A total of 136 patients were diagnosed with cirrhosis, while 137 patients were classified as Child-Pugh class A. A total of 124 patients were positive for HBsAg. Patients were randomly divided into a training cohort (n= 107)and a validation cohort (n= 43). The demographic and clinical-pathologic characteristics are summarized in Table 1. There were no significant differences in variables between the two cohorts.
Radiomics signature construction
In total, 1926 radiomics features were extracted from the ROIs. Based on the training cohort, radiomics features were reduced to 7 survival-related features by using the LASSO algorithm. The name of the selected features and the formula of the radiomics score are shown in Supplementary Table 1. The Cindices of the radiomics signature for predicting OS in the training and validation cohorts were 0.689(95%CI: 0.626-0.751) and 0.746 (95%CI: 0.650-0.842), respectively. The ROC curves of the radiomics signature for predicting 1-, 3- and 5-year OS are shown in Figure 3 (AUC = 0.648, 0.753 and 0.807,respectively, in the training cohort; AUC = 0.921, 0.840 and 0.891, respectively, in the validation cohort).
Development and validation of the predictive nomogram
Based on the univariate regression analysis (Table 2), four variables withP< 0.05 were enrolled in the multivariate regression analysis. The results of multivariate regression analysis are displayed as forest plots (Figure 4). AFP [hazard ratio (HR), 1.8; 95%CI: 1.06-3.1,P= 0.03], NLR (HR, 2.5; 95%CI: 1.45-4.3,P< 0.001) and radiomics signature (HR, 3.7; 95%CI: 1.25-10.7,P= 0.018) were identified as independent predictors of OS. The abovementioned three variables were included to develop the predictive model and visualizedviaa nomogram (Figure 2B). The C-indices of the nomogram in the training and validation cohorts were 0.736 (95%CI: 0.681-0.791) and 0.774 (95%CI: 0.697-0.851), respectively. The AUC values of 1-, 3-, and 5-year OS were 0.850, 0.791 and 0.823, respectively, in the training cohort(Figure 5A) and 0.905, 0.884 and 0.911, respectively, in the validation cohort (Figure 5B). The calibration curves of the nomogram demonstrated good agreement between the predicted and actual survival probabilities (Figure 5C and D).

Table 1 The demographic and clinical-pathologic characteristics of patients
Evaluation of clinical practicality and risk stratification ability
DCA curves showed that the nomogram received more net benefit than the BCLC staging system model and TNM staging system model in predicting 3- and 5-year OS at reasonable threshold probability(Figure 6).
To further explore the risk stratification ability of the nomogram, we calculated the total points of the nomogram for each patient. The total points conformed to a normal distribution in the training and validation cohorts. Patients were categorized into low- and high-risk subgroups based on whether the total points of the patient were lower (training cohort ≤ 89.8; validation cohort ≤ 66.0) or higher (training cohort > 89.8; validation cohort > 66.0) than the median points of each cohort. Kaplan-Meier curves indicated that patients in the low-risk subgroup had significantly longer OS and DFS, with allP< 0.001(Figure 7).

Table 2 Univariate Cox regression analysis in the training cohort
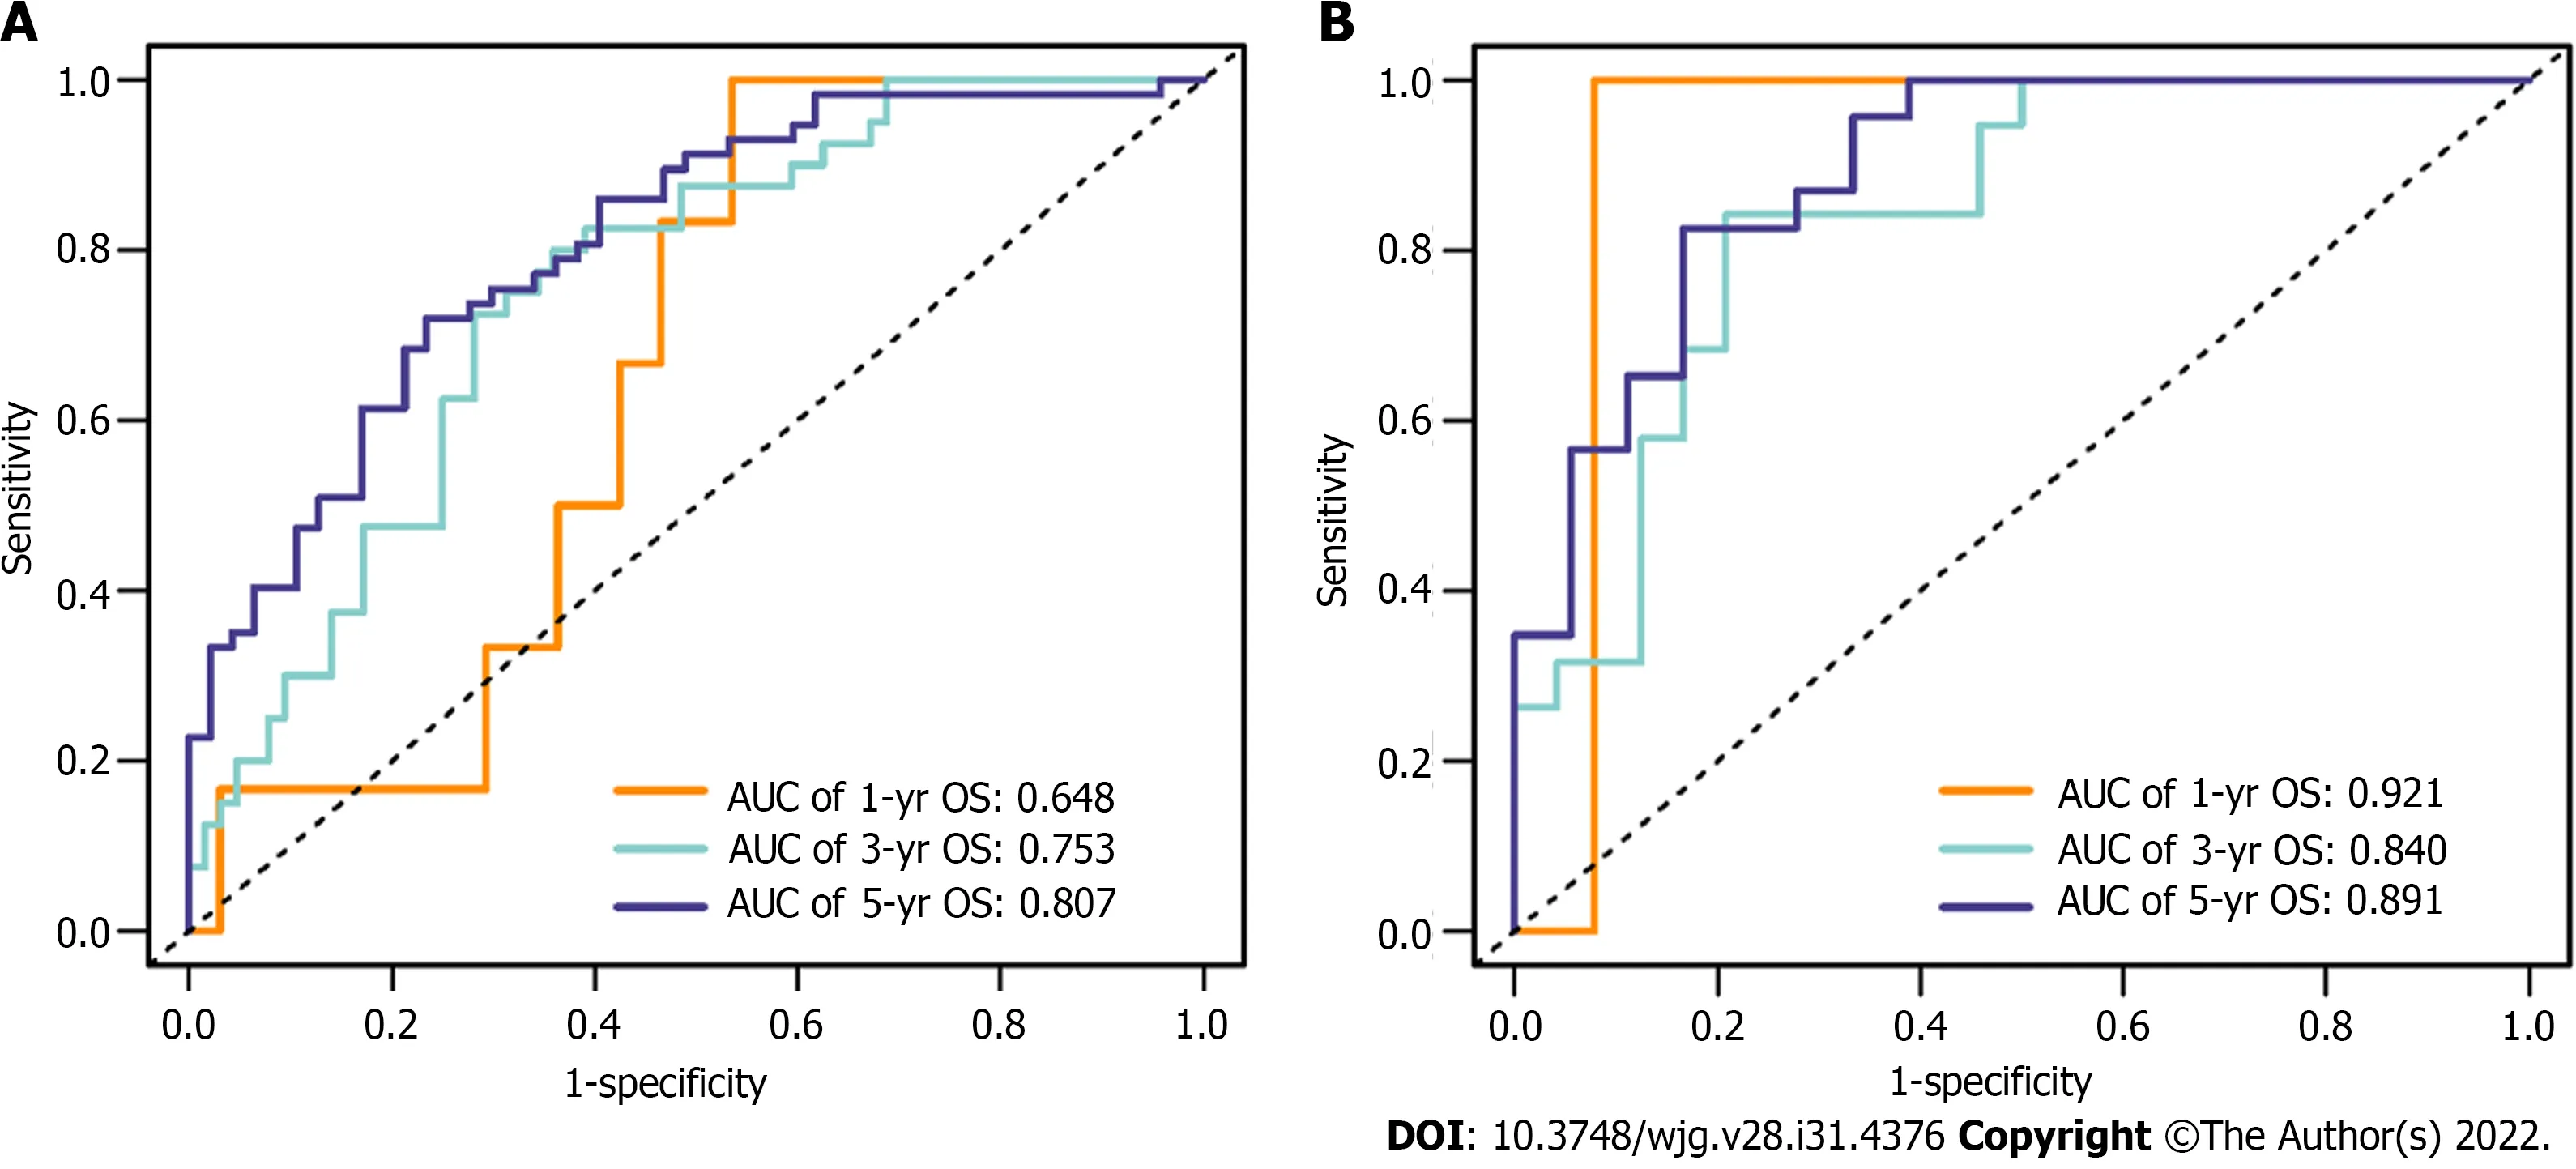
Figure 3 Receiver operating characteristic curves of the radiomics signature for predicting 1-, 3- and 5-year overall survival in the training and validation cohorts. A: Training cohort; B: Validation cohort. OS: Overall survival; AUC: Area under the curve.
DlSCUSSlON
In this study, we developed a nomogram for predicting the survival of HCC patients after radical hepatectomy. Seven radiomics features were selected from 1926 radiomics features, and then integrated into a single radiomics signature to comprehensively estimate CECT images. We included AFP, NLR and radiomics signature to build the predictive nomogram. The C-indices of the nomogram in the training cohort and validation cohort were 0.736 and 0.774, respectively. The AUCs and the calibration curve indicated satisfactory accuracy in both the training and validation cohorts (AUC of 1-, 3- and 5-year survival = 0.850, 0.791, 0.823 and 0.905, 0.884, 0.911, respectively). The high AUCs of the nomogram indicate a high accuracy in predicting OS. In DCA, comparing the traditional staging system with our nomogram with respect to predictive ability and clinical practicality, the predictive nomogram was superior to the traditional staging system (BCLC and TNM staging system) in predicting 3- and 5-year survival.

Figure 4 Forest plot of variables with multivariate regression analysis in the training cohort. Variables with a P value < 0.05 were considered significantly associated with the overall survival of hepatocellular carcinoma patients. ALT: Alanine transaminase; AFP: Alpha fetoprotein; NLR: Neutrophil-tolymphocyte ratio; HR: Hazard ratio.
To our knowledge, our radiomics-based model that contains NLR and AFP to predict survival in patients with HCC is entirely novel. A few previous studies[19,20] have investigated the capability of radiomics analysis in predicting the prognosis of HCC patients, and these studies analysed the largest cross-sectional area, whereas entire-tumour analysis was conducted in this study, which can provide more comprehensive information and more effective evaluation of the tumour. Thus, compared with previous studies, radiomics analysis in this study may achieve better performance. Various models combining radiomics features with clinical-pathologic factors to predict prognosis have been developed.Nevertheless, very few studies have enrolled radiomics features and NLR as variables to build a prognostic prediction model for HCC patients. Wanget al[21] established an magnetic resonance imaging-based radiomics model incorporating a few clinical factors for predicting the 5-year survival of patients with HCC after radical surgery. The mean AUC in the validation cohort was 0.7578 (95%CI:0.7056-0.8100).
As precision medicine has developed, accurate prediction of patient prognosis is the principal component of individualized therapy and improving patient prognosis. It has been reported that intratumor heterogeneity is common in a variety of tumours and correlated with clinical outcomes[22].However, information about intratumor heterogeneity obtained from routine clinical examinations is limited. Radiomics analysis refers to computer-aided data mining of quantitative high-throughput imaging features extracted from medical images[9,10], and it has been reported that radiomics features have potential prognostic value in liver cancer[14], lung cancer[15] and breast cancer[16]. Compared with the interpretation of traditional radiology, radiomics could provide comprehensive information regarding intratumor heterogeneity that may be unable to be obtained by the naked eye of radiologists.To a certain extent, radiomics overcomes these limitations of traditional radiology. As a biomarker associated with HCC, AFP has been widely used for early diagnosis and monitoring of HCC. AFP was considered an independent risk factor for postoperative survival; moreover, patients with low serum AFP levels had longer OS after radical resection. However, AFP still has some limitations in the prognosis prediction of HCC. Prior studies have reported that AFP has no ability to predict prognosis in small HCC (diameter ≤ 3 cm)[23]. Immune cells such as neutrophils, macrophages and lymphocytes within the tumour microenvironment have been confirmed to affect tumour development and progression[24]. There is evidence suggesting that lymphocytes can inhibit tumour proliferation,invasion, and metastasis by enhancing immune surveillance[25]. Moreover, tumour-infiltrating lymphocytes were associated with better outcomes in a variety of tumours, probably linked to tumour infiltration, antitumor activity, lymphocyte induction and inhibition of angiogenesis[26]. One study indicated that neutrophils promote tumour invasion[27]. Neutrophils can inhibit the proliferation of lymphocytes and induce lymphocyte apoptosis[28]. Patients with an elevated NLR level have relative neutrophilia and lymphocytopenia. Therefore, a high NLR indicates a poor prognosis, and this has been confirmed in numerous cancers, including gastric cancer[29], colorectal cancer[30] and pancreatic cancer[31]. To date, there is growing attention to the potential of NLR to be a prognostic biomarker in patients with HCC[32,33]. The NLR is a modality of measuring systemic inflammation that is relatively inexpensive and conveniently obtained from routine preoperative blood tests. In our previous study, the optimal cut-off value of NLR was determined to be 2.31 for predicting the prognosis of patients with HCC, and this was confirmed by not only our previous retrospective trial but also other prospective clinical trials[32]. In summary, NLR is a potential independent predictor for HCC.
As a standardized and noninvasive imaging modality, CECT is widely utilized for diagnosis, staging,clinical decision-making and treatment response monitoring across numerous cancer types. An advantage of radiomics analysis is that it was performed on existing CECT images as a routine preoperative examination for patients with malignant tumours. Moreover, the variables included in this nomogram were easily acquired from routine blood examinations.
All CECT images were reconstructed with a slice thickness of 1.25 mm, and a previous report showed that slice thickness does not considerably influence the stability of the parameters[34].
The current study has several limitations. First, this study was a single-centre retrospective study.Insufficient data heterogeneity could be a major limitation of single-centre studies. Therefore, more patients from other centres are needed to further validate the reliability and clinical applicability of this prognostic model. Second, HCC is considered to be related to various aetiological factors, including alcohol, aflatoxin, hepatitis B virus and hepatitis C virus. Different aetiologies might result in different outcomes in HCC. Hepatitis B virus was the main aetiology of HCC in the present study. Thus, future studies are required to validate the efficacy and accuracy of this predictive model in HCC with different aetiologies. Third, the different contrast agents or the different injection speeds may affect the quantification of radiomic features[35] and thus affect the accuracy of the model. To overcome this limitation,multi-institutional validation and cross-validation are required in the future. Fourth, regions of interest were outlined semiautomatically and corrected manually when necessary. Hence, a certain degree of selection bias of the ROIs might be created by the different observers. This is a challenging problem for radiomics analysis to eliminate or reduce biases. Fifth, the correlation between radiomics features and biological behaviour remains unknown. Recently, radio-genomics has become an emerging area that integrates radiomics and genomics. Radio-genomics is the discipline that studies the relationship between image phenotypes and genomics, which may contribute to precision medicine development[36]. Further research is still required to determine the potential correlation between radiomics and genomics in HCC. In future studies, we will incorporate genomic characteristics associated with HCC prognosis to construct a more comprehensive radio-genomics predictive model.

Figure 6 Decision curve analysis was performed in all hepatocellular carcinoma patients to evaluate the clinical practicality of the nomogram for predicting 3- and 5-year overall survival compared with the Barcelona clinic liver cancer staging system model and tumor,node and metastasis staging system model. A and B: Decision curve analysis of the nomogram, Barcelona clinic liver cancer staging system model and tumor, node and metastasis staging system model in predicting 3- (A) and 5-year (B) OS. In the decision curve, the threshold probability is represented on the x-axis,and the net benefit is represented on the y-axis. A higher curve indicates a greater net benefit at any given threshold probability. The decision curve showed that the nomogram adds more net benefit than traditional staging system models. BCLC: Barcelona clinic liver cancer; TNM: Tumor, node and metastasis.

Figure 7 Risk stratification ability of the nomogram was estimated by the Kaplan-Meier method and log-rank test in the training and validation cohorts. A and B: Kaplan-Meier curves between the low- and high-risk subgroups of overall survival in the training cohort (A) and validation cohort (B);C and D: Kaplan-Meier curves between the low- and high-risk subgroups of disease-free survival in the training cohort (C) and validation cohort (D). Patients with hepatocellular carcinoma in the training and validation cohorts were divided into low- and high-risk subgroups according to whether the total points of each patient were lower or higher than the median points of each cohort.
CONCLUSlON
In conclusion, the nomogram combining the radiomics signature, NLR and AFP may contribute to postoperative outcome prediction and clinical treatment decision-making for HCC patients.
ARTlCLE HlGHLlGHTS
FOOTNOTES
Author contributions:Deng PZ, Zhao BG and Huang XH contributed equally to this work; Liao WJ was the guarantor and designed the study; Deng PZ, Zhao BG, Xu TF, Chen ZJ, Wei QF, and Liu XY participated in the acquisition,analysis, and interpretation of the data; Deng PZ and Huang XH drafted the initial manuscript; Guo YQ, Yuan SG,and Liao WJ revised the article critically for important intellectual content.
Supported bythe National Natural Science Foundation of China, No. 81372163; the Science and Technology Planning Project of Guilin, No. 20190218-1; the Openin Project of Key laboratory of High-Incidence-Tumor Prevention &Treatment (Guangxi Medical University), Ministry of Education, No. GKE-KF202101; the Program of Guangxi Zhuang Autonomous Region health and Family Planning Commission, No. Z20210706; and the Innovation and Entrepreneurship Project of University Students in Guangxi, No. 202110601002.
lnstitutional review board statement:The study was reviewed and approved by the research ethics committee of Affiliated Hospital of Guilin Medical University (Approval NO. 2021WJWZC14).
lnformed consent statement:Informed consent was obtained from all patients.
Conflict-of-interest statement:There are no conflicts of interest to report.
Data sharing statement:No additional data are available.
Open-Access:This article is an open-access article that was selected by an in-house editor and fully peer-reviewed by external reviewers. It is distributed in accordance with the Creative Commons Attribution NonCommercial (CC BYNC 4.0) license, which permits others to distribute, remix, adapt, build upon this work non-commercially, and license their derivative works on different terms, provided the original work is properly cited and the use is noncommercial. See: https://creativecommons.org/Licenses/by-nc/4.0/
Country/Territory of origin:China
ORClD number:Peng-Zhan Deng 0000-0003-1221-7664; Bi-Geng Zhao 0000-0001-6203-4159; Xian-Hui Huang 0000-0002-4306-1327; Ting-Feng Xu 0000-0003-0303-5471; Zi-Jun Chen 0000-0002-2488-8038; Qiu-Feng Wei 0000-0001-9355-2098;Xiao-Yi Liu 0000-0001-5563-7488; Yu-Qi Guo 0000-0002-6687-6828; Sheng-Guang Yuan 0000-0003-4846-0543; Wei-Jia Liao 0000-0002-8906-8612.
S-Editor:Zhang H
L-Editor:A
P-Editor:Cai YX
杂志排行

World Journal of Gastroenterology的其它文章
- Influence of different portal vein branches on hepatic encephalopathy during intrahepatic portal shunt via jugular vein
- Evidence-based considerations on bowel preparation for colonoscopy
- Current standard values of health utility scores for evaluating cost-effectiveness in liver disease: A metaanalysis
- Simple cholecystectomy is an adequate treatment for grade I T1bN0M0 gallbladder carcinoma: Evidence from 528 patients
- Nationwide retrospective study of hepatitis B virological response and liver stiffness improvement in 465 patients on nucleos(t)ide analogue
- Approaches to reconstruction of inferior vena cava by ex vivo liver resection and autotransplantation in 114 patients with hepatic alveolar echinococcosis