The Development Status and Main Application Progress of China’s Ocean Satellites
2022-08-18LINMingsenZHANGYouguang
LIN Mingsen ,ZHANG Youguang
1 National Satellite Ocean Application Service,Beijing 10081
2 Key Laboratory of Space Ocean Remote Sensing and Application,Ministry of Natural Resources,Beijing 100081
Abstract: China’s ocean satellites are divided into three series based on ocean color satellites (HY-1),ocean dynamic environment satellites (HY-2) and ocean monitoring satellites (HY-3).The three series of ocean satellites operate today in a multi-satellite network.The HY-1D satellite launched in June 2020 and the HY-1C satellite,already in orbit,realized a network observation capability and completed the formation of the ocean color satellite constellation.The HY-2D satellite launched in May 2021 joined the HY-2B and HY-2C satellites,which have been on orbit already and completed a network observation capability,thus establishing the ocean dynamic environment satellite constellation.The GF-3 02 satellite (1 m C-SAR 01) launched in November 2021 has networked with GF-3,initially establishing an ocean monitoring satellite constellation,which has finally completed its construction with the launch of the GF-3 03 satellite(1 m C-SAR 02) in April 2022.The GF-3 three-satellite network effectively boasts a wide capability in applications of satellite data products and services in many fields,such as ocean environmental monitoring,ocean disaster prevention and mitigation,marine scientific research and polar research.
Key words: ocean color satellite,ocean dynamic environment satellite,ocean monitoring satellite,satellite constellation
1 INTRODUCTION
Since the launch of the first ocean color satellite on May 15,2002,more than 10 ocean satellites have been launched,including HY-1 series of ocean color satellites (HY-1A,HY-1B,HY-1C and HY-1D),HY-2 series of ocean dynamic environment satellites (HY-2A,HY-2B,HY-2C,HY-2D) and China-France Oceanography Satellite (CFOSAT) ocean dynamic environment satellite as well as HY-3 series ocean monitoring satellites (GF-3,GF-3 02 and GF-3 03).At present,the HY-1A and HY-1B have stopped working,the HY-2A is degraded,while all the other satellites are in orbit and operating normally.
The ocean satellites have evolved into networking operations with multiple satellites.The HY-1D satellite launched in June 2020 realized a networking operation with the HY-1C satellite,and completed the construction of an ocean color satellite constellation.The HY-2D satellite launched in May 2021 realized networking operation with the HY-2B and HY-2C satellites,and completed the construction of an ocean dynamic environment satellite constellation.In November 2021,GF-3 02 satellite was launched to form a network with GF-3,initially forming an ocean monitoring satellite constellation.The successful launch of GF-3 03 satellite on April 7,2022 marks the completion of the construction of the ocean monitoring satellite constellation.The networking of the various series of ocean satellites has been completed,and the quality of satellite data products has been steadily improved.Among them,the quality of the sea surface height data of the HY-2 series of satellites has been fully recognized by international peers.Scientists of the French Space Agency (CNES) believe that the sea surface height data obtained by HY-2 series of satellites has high accuracy and has the same accuracy level as the European and the U.S.satellites considering all kinds of evaluations.The numerical prediction products provided by EUMETSAT for global users are recognized as the highest quality marine and atmospheric data products.Here the initial information required for the EUMETSAT model operation incorporates sea surface wind field data from the HY-2 series of satellites.
2 MAIN PARAMETERS OF SATELLITES
The HY-1C satellite was launched on September 7,2018.The satellite carries five payloads,including China ocean color temperature scanner (COCTS),coastal zone imager (CZI),ultraviolet imager (UVI),satellite calibration spectrometer (SCS)and automatic identification system (AIS).Compared with the HY-1A and HY-1B satellites,the observation accuracy,observation range and the mission lifetime of HY-1C was greatly improved.China’s first ocean color satellite constellation for networking observation in the morning and afternoon was formed then,along with HY-1D satellite launched on June 11,2020,which greatly improves the global coverage of the ocean color.Table 1 shows the main technical parameters of the HY-1C and HY-1D satellites.
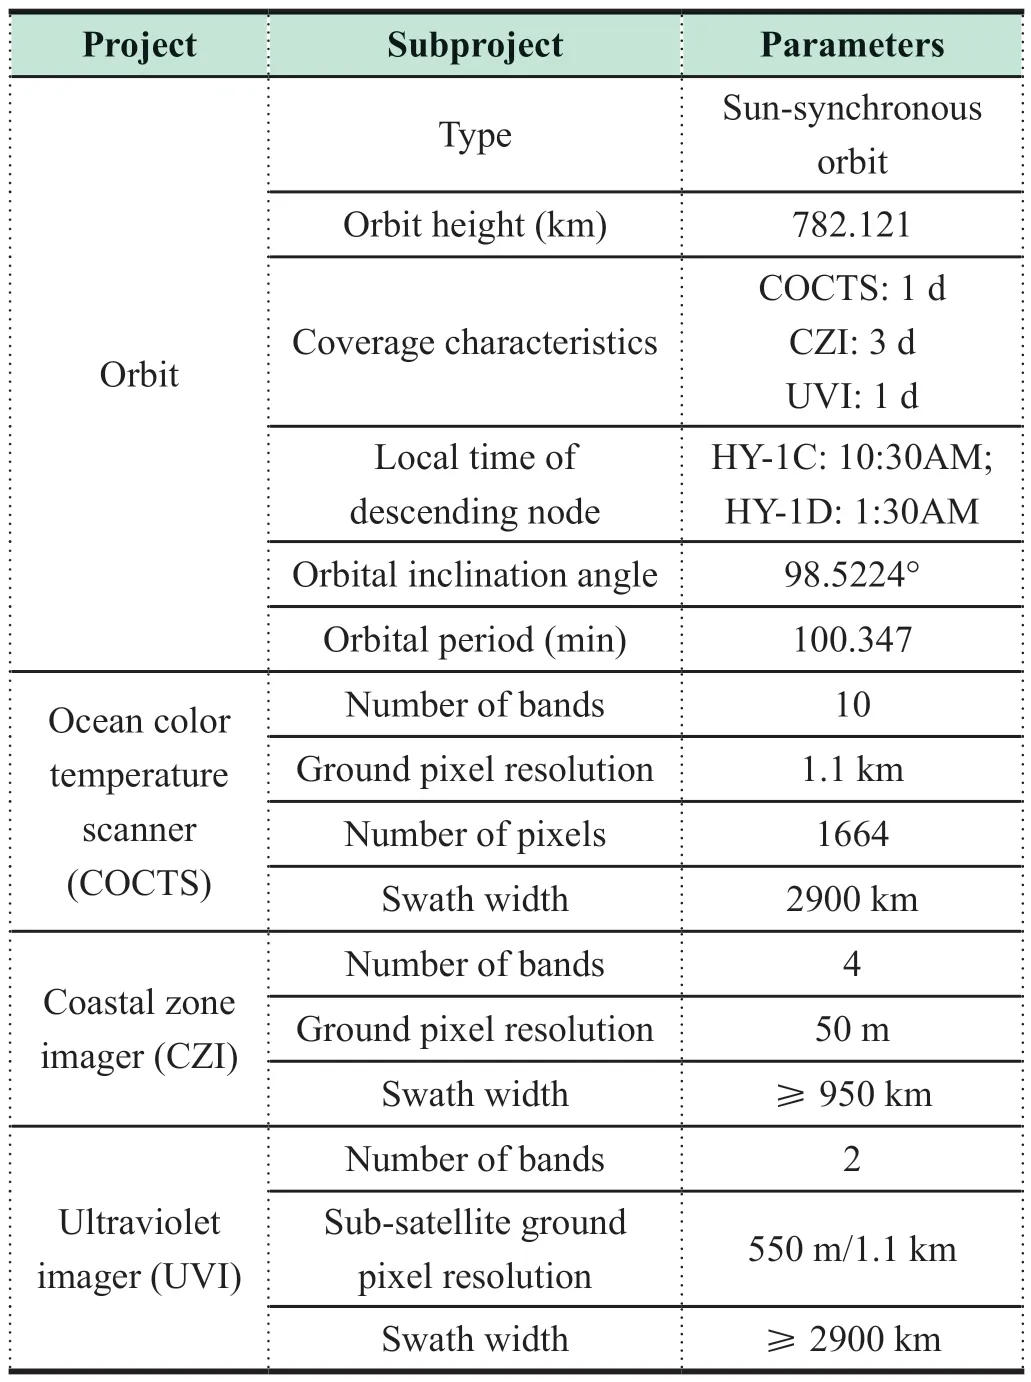
Table 1 Main technical parameters of HY-1C/D
The HY-2B satellite was launched on October 25,2018.The satellite carried six payloads including radar altimeter,microwave scatterometer,scanning microwave radiometer,calibration microwave radiometer,data collection system and ship automatic identification system.Compared with the HY-2A satellite,HY-2B has greatly improved observation accuracy,data product types and application efficiency.The HY-2C and HY-2D satellites were launched on September 21,2020 and May 19,2021 respectively,forming a three-satellite networking observation capability.In terms of payload configuration,the HY-2C and HY-2D satellites have a reduced scanning microwave radiometer payload,otherwise the other payload parameters are basically the same.Table 2 shows the main technical parameters of the HY-2 satellites.
CFOSAT,launched on October 29,2018,was the first satellite jointly developed by China and France.It was a milestone in the cooperation between China and France in the field of high technology and promoted the progress of ocean satellite projects between the two countries.The satellite carried two payloads including a microwave scatterometer and a surface wave investigator monitor,which were used for high-precision synchronous observation of wind and waves on the ocean sur-face.The satellite can also observe the land surface and obtain relevant data such as soil moisture,roughness and polar ice sheet.The data obtained could be shared and used by scientists and forecasters of the two countries and the worldwide user community.It was conducive to a better understanding of the dynamic change process of ocean parameters such as sea winds and waves.At the same time,it can provide services to guarantee maritime ship navigation safety,global marine disaster prevention and reduction,and global marine resources survey.Table 3 shows the main technical parameters of the CFOSAT satellite.
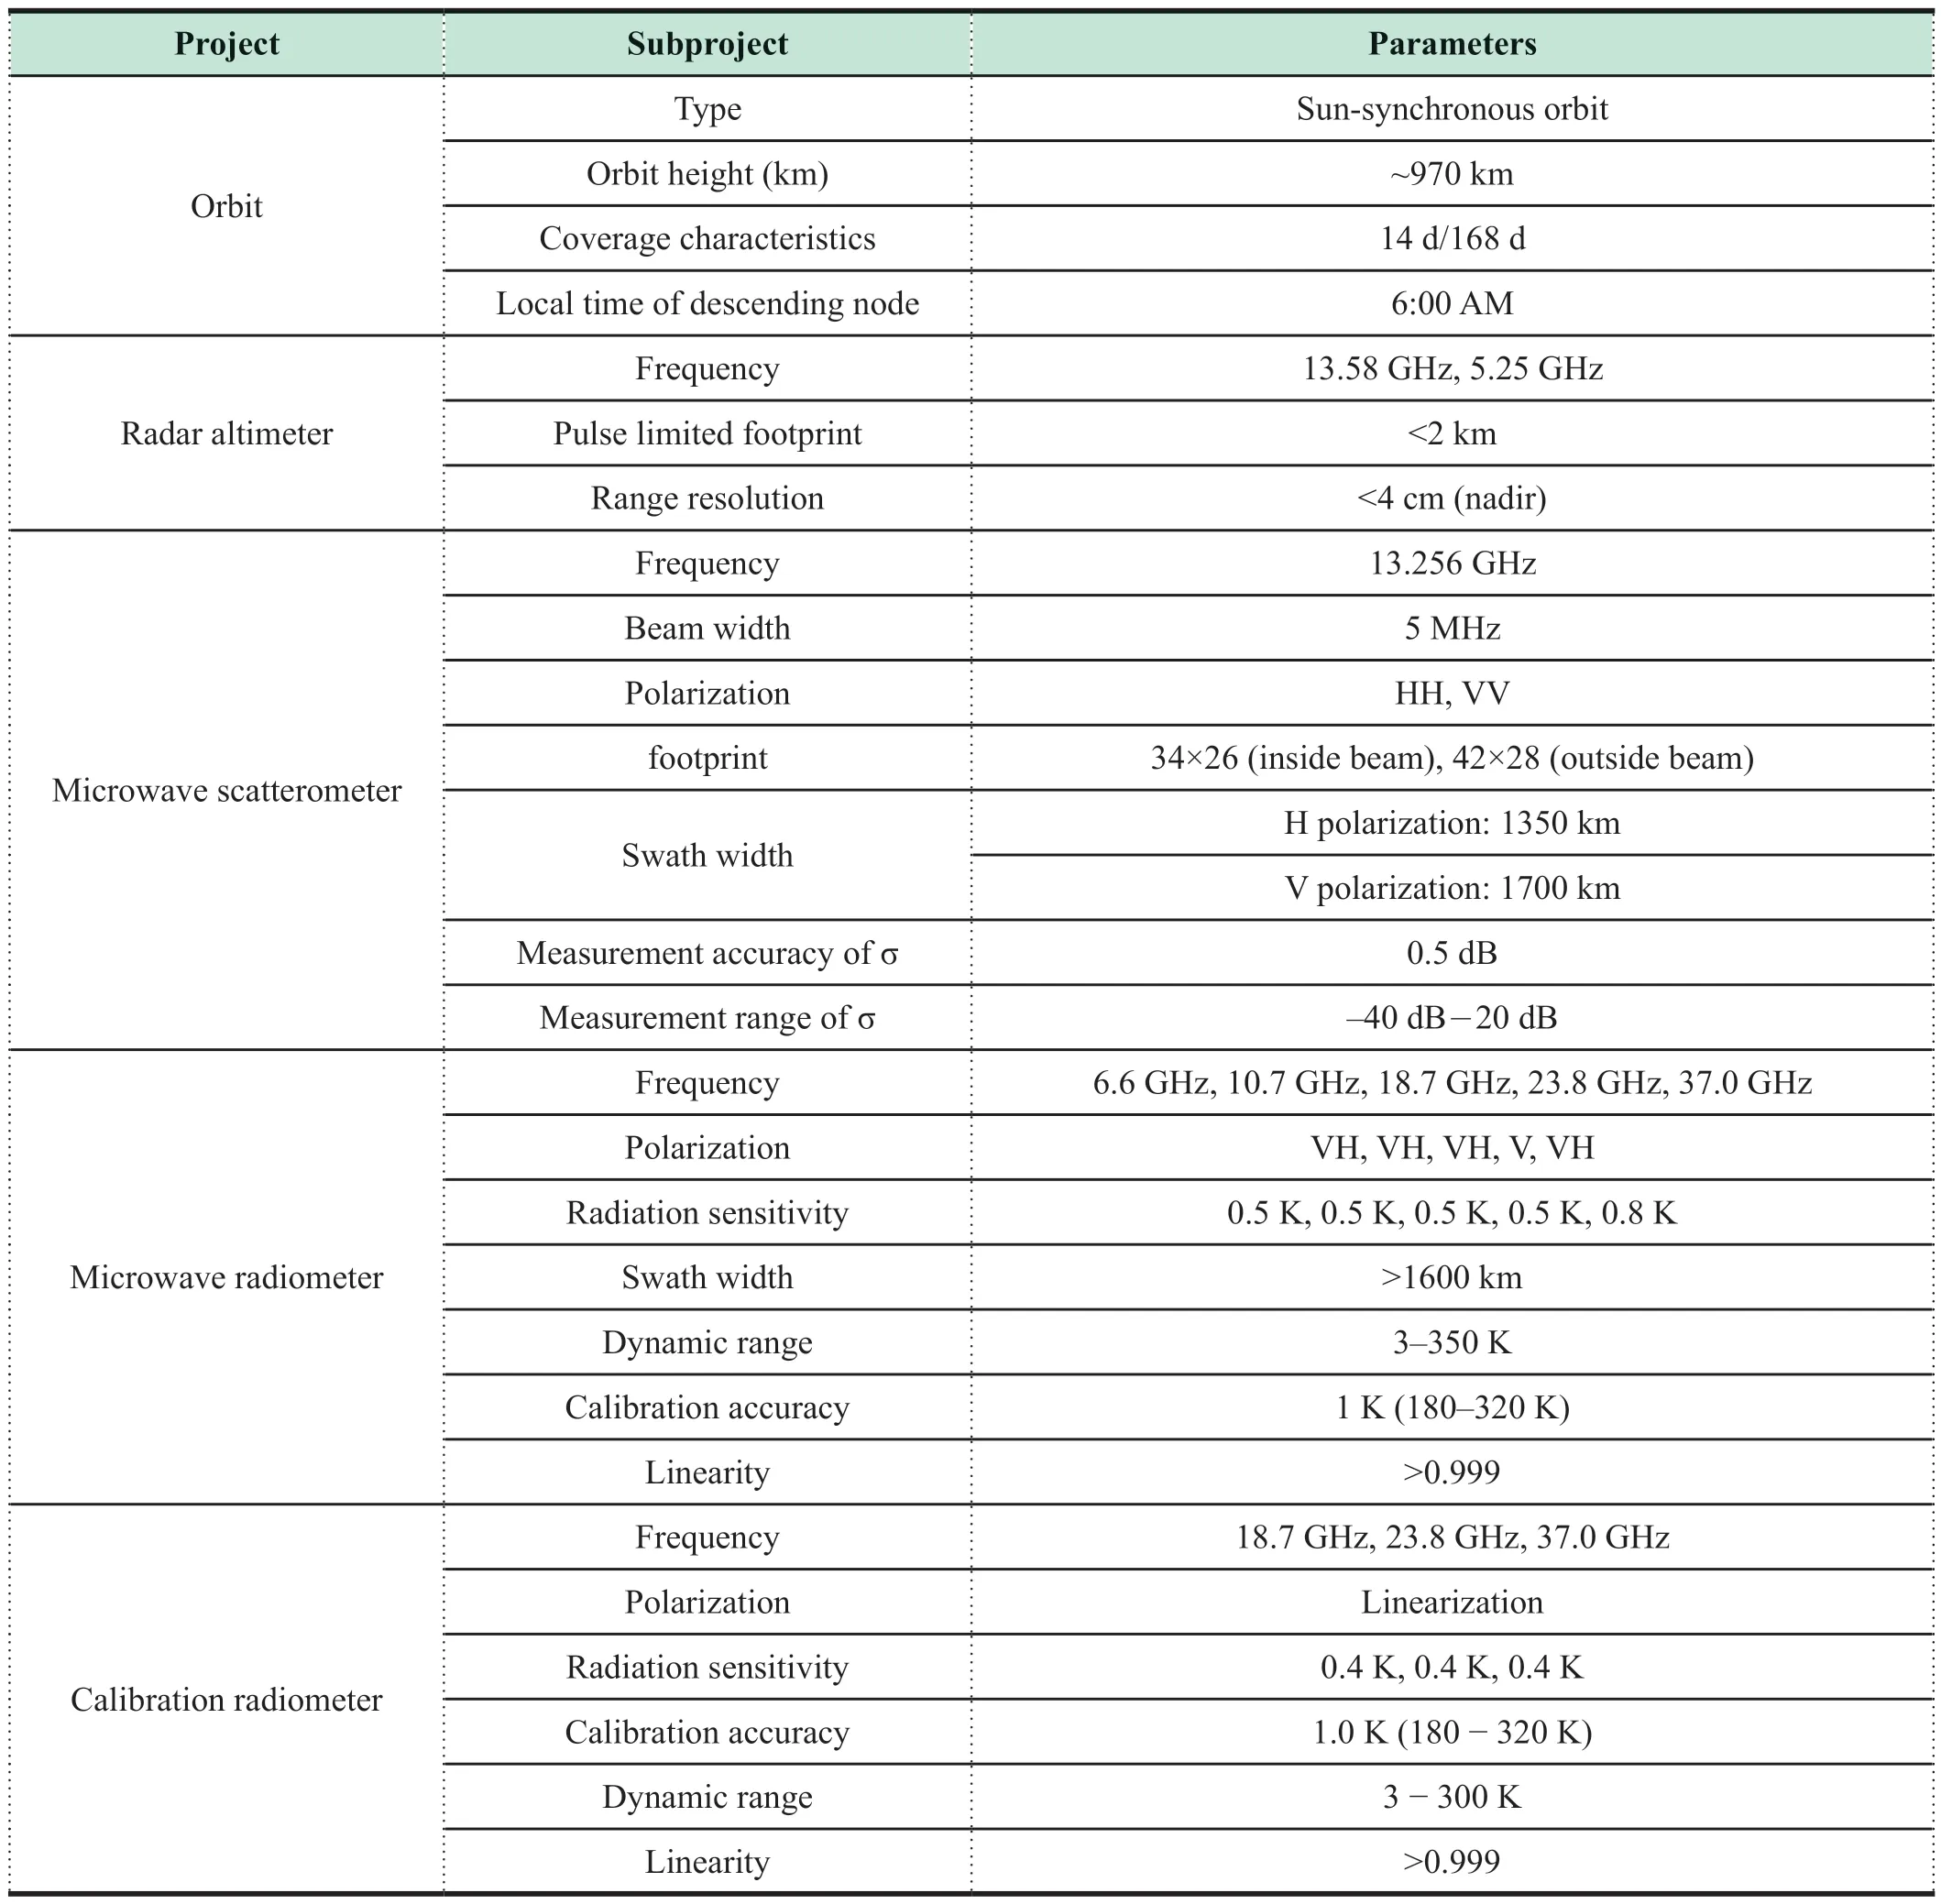
Table 2 Main technical parameters of HY-2B,HY-2C and HY-2D
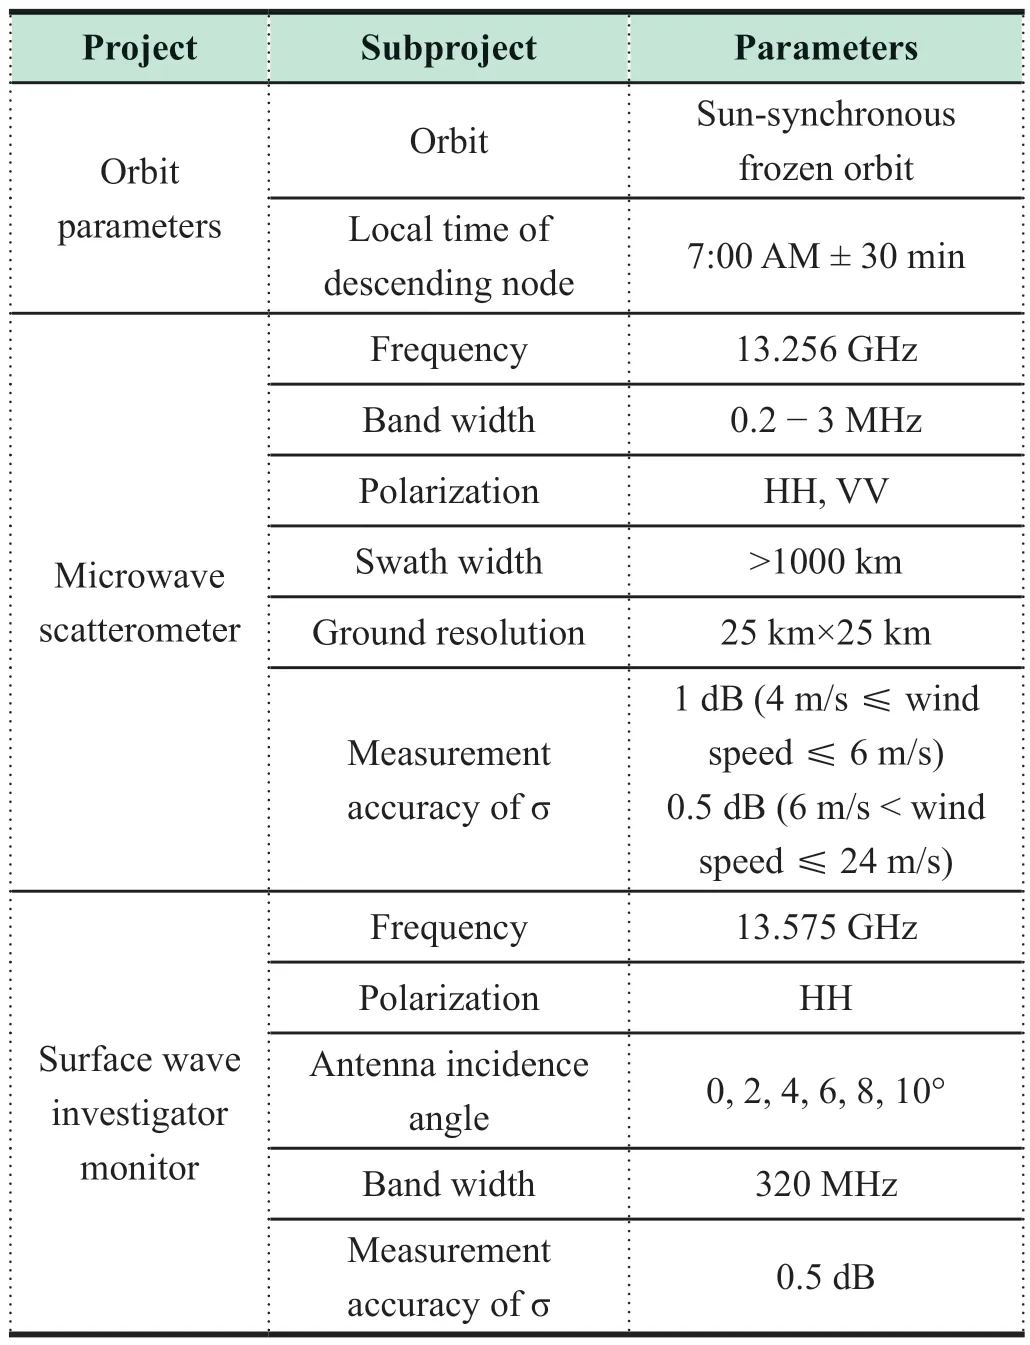
Table 3 Main technical parameters of CFOSAT
GF-3/02/03 satellites formed the radar satellite constellation for marine surveillance.The three-satellite network observation can provide reliable remote sensing data for the marine dynamic environment,emergency monitoring of natural disasters and safety products to avoid accidents.It can also provide strong support for China’s marine environment early warning and land surface disaster monitoring.The main technical parameters of the GF-3 satellite are shown in Table 4.

Table 4 Main technical parameters of GF-3 satellite
3 THEORETICAL RESEARCH PROGRESS OF OCEAN REMOTE SENSING
3.1 Remote Sensing of Ocean Color Environment
Atmospheric correction is a key issue in the field of ocean color remote sensing.The short wave infrared band (SWIR)method is widely used in atmospheric correction of a class II water body.The existing SWIR method assumes that the atmospheric correction factor changes linearly between the extrapolated band and the reference band in logarithmic coordinates.When the band span is small,this linear approximation is consistent with the simulation results of the radiative transfer model,but there is a certain difference when the band span is large.To solve this problem,the atmospheric correction factor is modified by using the method of piecewise extrapolation,and the SWIR method is improved.Due to the complex water characteristics of the Yellow Sea and the Bohai Sea as well as the limitations of climatic conditions such as cloudy fog,to carry out effective research on multi-source remote sensing data fusion technology,we need to improve the analysis accuracy of data.Meanwhile,the temporal and spatial variation law of marine Chlorophyll a (Chl-a) concentration and its relationship with marine environmental changecan be comprehensively and systematically understood.In terms of the ocean color remote sensing model research,aiming at the applicability of ocean color remote sensing algorithms or products in coastal waters of China,the authenticity test covering the Bohai Sea,the Yellow Sea,the East China Sea and the northern South China Sea was carried out,and the regional remote sensing models of ocean color elements such as chlorophyll concentration and suspended solids concentration have been developed.In terms of the inherent optical quantity remote sensing model,it mainly develops the semi-analytical algorithm of water absorption and backscattering coefficient,and the method of further separating the absorption coefficient of each component.In addition,Chinese scholars have also carried out remote sensing inversion of phytoplankton groups,for example,Tao et al.established remote sensing recognition algorithms for dinoflagellates and diatom blooms.Lou et al.retrieved the diurnal variation characteristics of prorocentrum bloom in the East China Sea by using the hourly observation advantage of static water color satellite GOCI data.
Pan et al.took the turbid water bodies of the Yangtze River Estuary,the Yellow Sea,the Bohai Sea and the East China Sea as the research area,and constructed an atmospheric correction model based on the sea air coupling model for the turbid water bodies in the offshore area.The advantages and disadvantages of single sensor inversion of suspended solids concentration in estuarine high turbidity water were analyzed,and a high-resolution high-frequency dynamic inversion model of suspended solids concentration based on spatio-temporal fusion was constructed.The inversion model of absorption coefficient of ocean color elements was constructed.
Sheng et al.used the Monte Carlo method to evaluate the uncertainty of chlorophyll concentration,backscattering coefficient and photosynthetic effective radiation used for remote sensing inversion based on the phytoplankton carbon model.They found that in the model estimation of marine primary productivity,the accuracy of chlorophyll concentration had the greatest impact on the results,and put forward suggestions to improve the estimation and inversion level of chlorophyll.
Marine particulate organic carbon (POC) is a key parameter of marine carbon sequestration.Cui et al.verified and corrected the MODIS/Aqua satellite monthly average POC remote sensing products released by NASA using the measured data of four seasons from 2009 to 2011.The temporal and spatial distribution characteristics and change trend of POC from 2003 to 2014 were analyzed by using the corrected remote sensing data.It was found that POC remote sensing products have a good linear relationship with the measured data in the north of the South China Sea.There was a high systematicness.It is necessary to use the measured data to correct the remote sensing data regionally.
3.2 Remote Sensing of the Ocean Dynamic Environment
In terms of the inversion algorithm of significant wave height,Li et al.derived the second-order theoretical echo model with skewness coefficient based on the second-order theoretical echo model.Jiang et al.reevaluated the HY-2 satellite radar altimeter significant wave height product retrieved by the four-parameter retraining algorithm,then the product accuracy was significantly improved compared with the three-parameter retraining algorithm.
In terms of sea surface wind field inversion algorithm,Wang et al.proposed a multiple solution scheme (MSS) and a two-dimensional variational analysis method (2DVAR) by using the Royal Institute of Meteorology of the Netherlands,which were applied to the wind field inversion of the HY-2 microwave scatterometer and achieved good results.Artificial neural network(ANN) was employed to combine the observations of the two sensors onboard the HY-2 series satellite:radiometer and scatterometer to achieve wind field retrieval in typhoon conditions.
In the research of sea surface temperature inversion algorithm,Wang et al.established the inversion algorithm of sea surface temperature,sea surface wind speed,atmospheric water vapor content and other marine environmental parameters by using radiation transfer equation simulation.In addition,Sun et al.developed a gridded sea surface temperature data fusion method using optimal interpolation technology and expanded the sea surface temperature data products obtained by satellite remote sensing.
In the research of sea ice concentration inversion algorithm,Shi et al.have statistically analyzed the spectral gradient rate and polarization gradient rate of typical sea areas,and determined the characteristic value of brightness temperature required for calculating sea ice concentration.The calculation results are consistent with the two operational sea ice concentration products provided by the National Snow and Ice Data Centor (USA)and the University of Bremen in Germany.
Wu et al.proposed a method for retrieving the ocean significant wave height (SWH) from Sentinel-1 (S1) SAR data in horizontal-horizontal (HH) polarization based on a back propagation neural network (BPNN).A total of 4,273 scenes from S1 extra-wide swath mode data acquired in the Arctic were collocated with data from four radar altimeters (RA),yielding 126,128 collocated data pairs.These data were separated into training and testing data sets to develop the BPNN model for retrieving SWH.
GF-3 synthetic aperture radar (SAR) provides data support for the study of ocean surface current measurements in the Kuroshio region.Yang used the four available stripmap mode SARs’ data acquired by GF-3 in the Kuroshio region for measuring the ocean surface current field.In general,the Doppler centroid anomaly (DCA) estimation is a common method to infer ocean surface currents from single-antenna stripmap data,but only the radial velocity component can be retrieved.In order to measure current vectors,a novel method combining the sub-aperture processing and the least squares (LS) technology was suggested and demonstrated by applying to the GF-3 SAR data processing.The experiment’s results agreed well with model-derived ocean current data,indicating that the GF-3 SAR has the capability to accurately retrieve the ocean surface current field in the Kuroshio region.
4 MAIN APPLICATION PROGRESS OF HY SATELLITES
4.1 Significant Wave Height and Wind Field Network Observation
4.1.1 Radar altimeter networking observation
The respective radar altimeters on HY-2B,HY-2C and HY-2D have enabled three-satellite networking observation,and the coverage capability and timeliness have been simultaneously improved.Figures 2 and 3 show the joint observation distribution of significant wave height and sea surface wind speed of the HY-2B/C/D three-satellite radar altimeters during typhoon IN-FA on July 24,2021.It can be seen that the local extreme value area of wind and huge waves in Northeast Taiwan is caused by the typhoon.
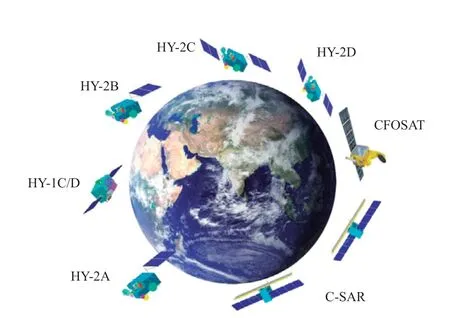
Figure 1 China's ocean satellites currently in orbit
4.1.2 Microwave scatterometer networking observation
The microwave scatterometers on HY-2B,HY-2C and HY-2D realize a networking observation.The average observational swath width of each satellite is 1500 km.In typhoon observation,it has the advantage of a larger observation area than similar satellites (MetOp Series).Three-satellite networking can cover 80% of the world within 6 hours,as shown in Figures 5-8.It should be pointed out that the microwave scatterometers carried on HY-2C and HY-2D are the only non-solar-synchronization orbit satellite scatterometers in orbit in the world.They have good complementary observation advantages compared with the scatterometer on the HY-2B satellite in polar orbit,and are conducive to calibration and verification.
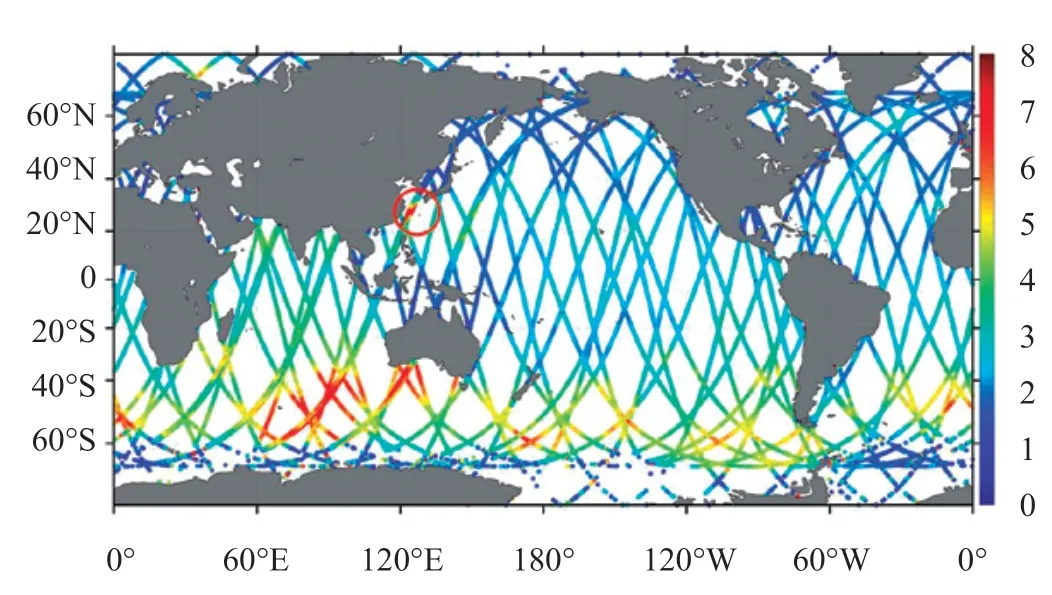
Figure 2 Joint observation distribution of significant wave height of HY-2B/C/D altimeters
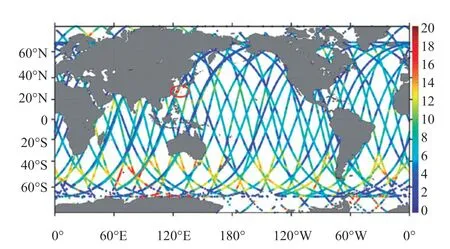
Figure 3 Joint observation distribution of sea surface wind speed of HY-2B/C/D altimeters
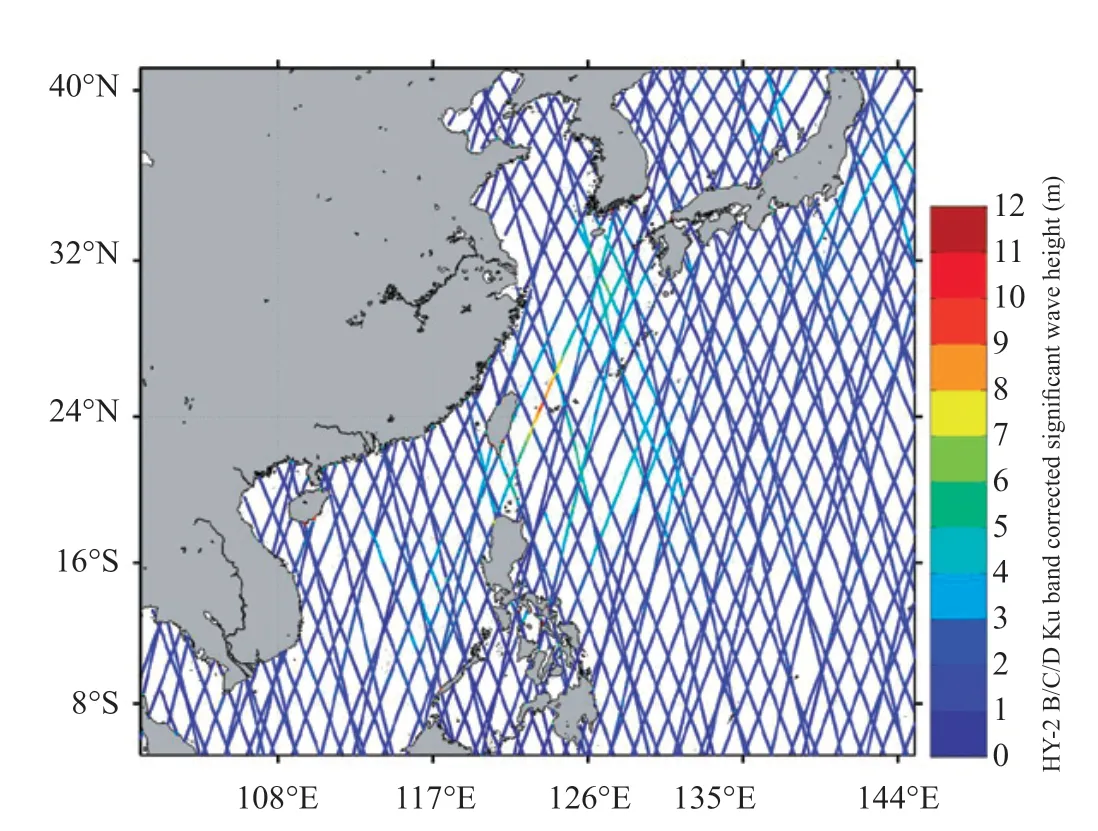
Figure 4 HY-2B/C/D observations of typhoon Chanthu significant wave height
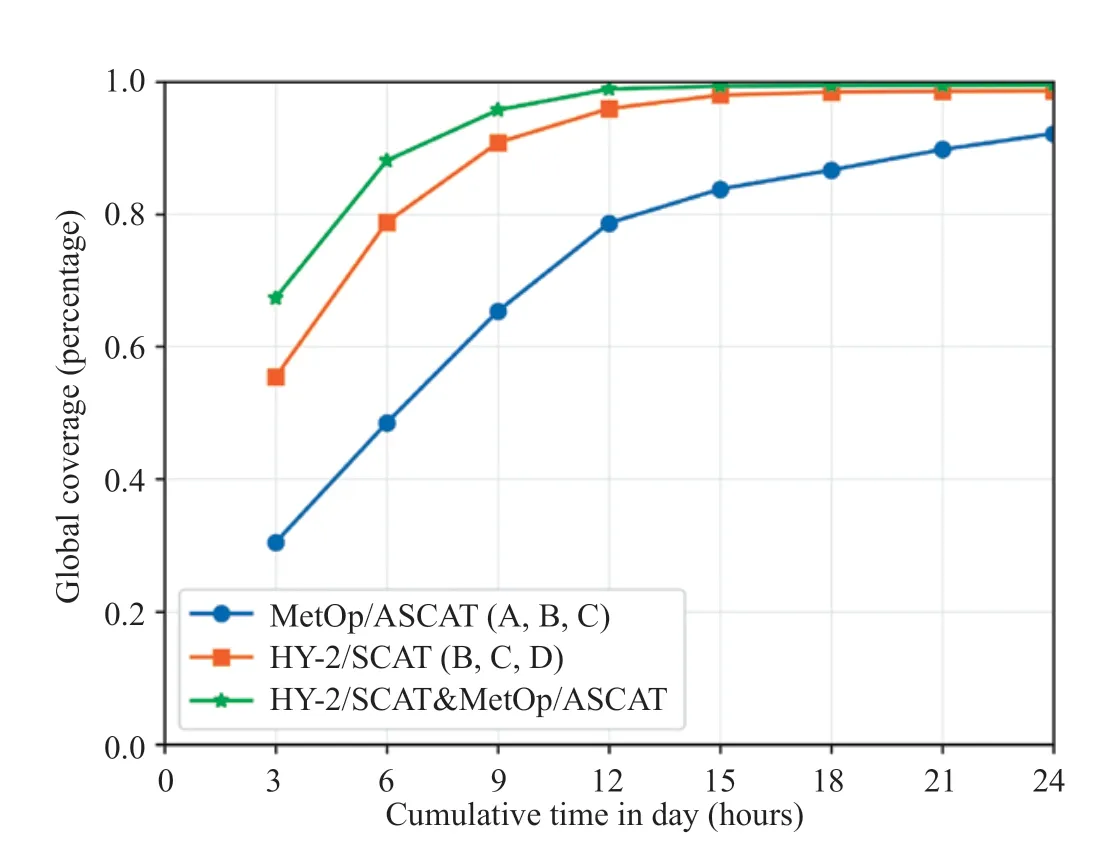
Figure 5 Observation coverage of HY-2 satellite and MetOp satellite scatterometers
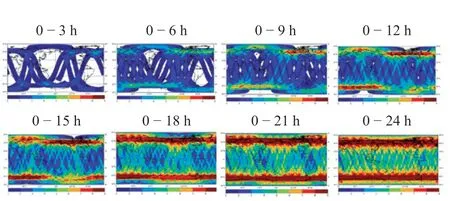
Figure 6 Observation coverage areas of HY-2B/C/D scatterometers in different periods
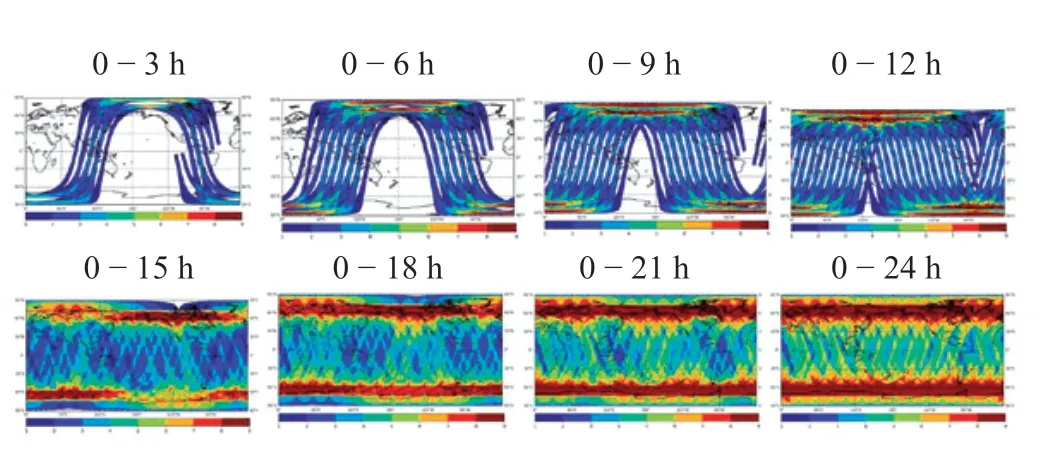
Figure 7 Observation coverage areas of MetOp ASCAT-A/B/C scatterometers in different periods
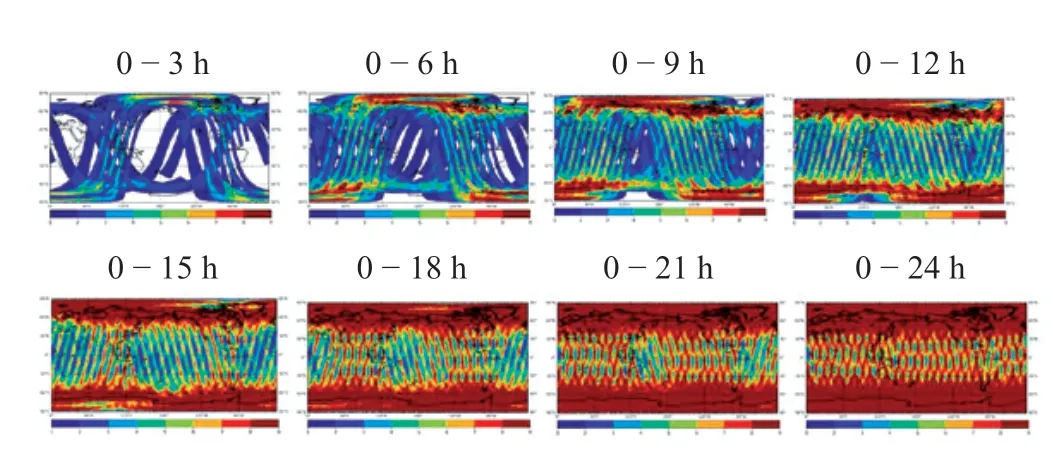
Figure 8 Observation coverage areas of HY-2 and ASCAT scatterometers in different periods
4.2 Polar Observation
Since the launch of HY-1C and HY-1D satellites,13,694 images with a spatial resolution of 50 m between 66.5 and 86.0 degrees north latitude in the Arctic Circle have been obtained,each with an image size of 1000 km × 360 km.The HY-1C satellite obtained 9341 scenes and HY-1D satellite obtained 4353 scenes,which were used to recognize,discover and study the landform,ice sheet,glacier,sea ice,iceberg,river,ocean color and snow cover.The distribution as well as daily,monthly and seasonal variation of characteristic parameters such as cloud system provide a new data source.In some areas,the annual variation characteristics of some parameters in the recent three years can also be analyzed.The remote sensing images of Young Pioneer Island observed by HY-1C and HY-1D satellites are shown in Figure 9.
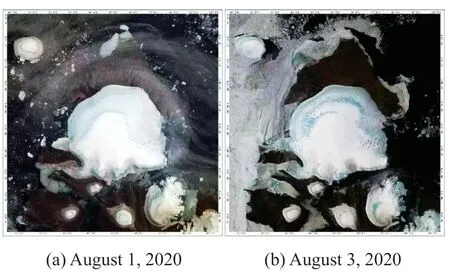
Figure 9 Remote sensing images of Young Pioneer Island observed by HY-1C and HY-1D satellites
The actual area measured from the obtained ocean satellite remote sensing images of the Young Pioneer Island was about 1535 kmand the circumference was about 219 km.As shown in Figure 9,it can be seen from the image on August 1,2020 that all the land ice and snow on the island have melted except for the glacier on the Young Pioneer Island,and the frozen soil layer is exposed.Its shape and color are similar to that of a piece of chocolate,or a large oil cake superimposed with a fried egg.The sea ice around the Young Pioneer Island was gradually decreasing.In mid and late August,the surrounding sea ice almost completely melted,and some land began to be covered with snow in late September.The image photographed in April 2021 shows that the whole island is white and covered with snow.The ice cap on the island was raised.The frozen soil layer started to appear in June,and the snow continued to decrease in July.By August 3,2021,some ice and snow on the land had melted,but the snow area of the ice cap on the island has not decreased compared with the previous year.
4.3 Typhoon Observation
The scatterometers on HY-2B,HY-2C,HY-2D,CFOSAT and MetOp satellites can obtain the global sea surface wind field.The visible light,near infrared,thermal infrared channels and ultraviolet channels of the COOTS on the HY-1C and HY-1D satellites can obtain the global distribution of surface vegetation and clouds.The multi-satellite network can obtain the typhoon wind field,cloud rainfall distribution,status changes,influence range and moving path many times a day.At 01:25 Beijing time on July 22,2021,Typhoon In-Fa,N0.6 Typhoon of 2021 was observed by the thermal infrared channel of COCTS on the HY-1D satellite,and the typhoon eye was very clear,as shown in Figure 10 and Figure 11.The wind field observed by HY-2B/C/D satellites of Typhoon No.1 (MALAKAS) in 2022 is shown in Figure 12.
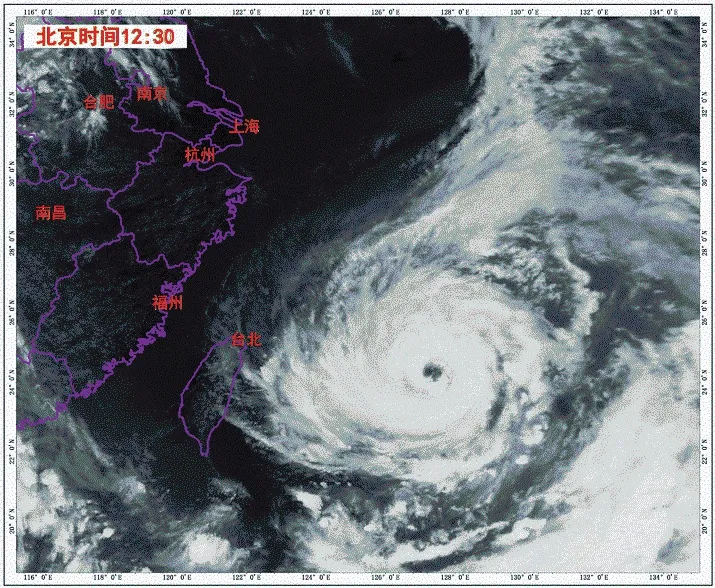
Figure 10 Thermal infrared cloud image of Typhoon In-Fa
4.4 Hurricane Observation
Ocean satellites can also observe hurricanes at high frequencies.On August 29,2021,Hurricane IDA landed in Louisiana in the southern United States,with a maximum wind speed of about 240 km per hour.The network among HY-2B,HY-2C and HY-2D satellites continuously observed the hurricane landing process and corresponding wind field information from August 28 to 29.During the two days,HY-2C and HY-2D observed the hurricane 8 times in total,including three times by HY-2B,two times by HY-2C and three times with HY-2D,as shown in Figure 13.
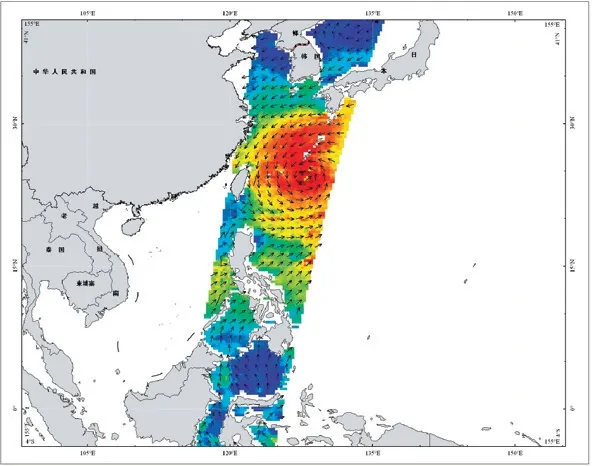
Figure 11 Observed wind field of Typhoon In-Fa by CFOSAT satellite

Figure 12 Wind field observed by HY-2B/C/D satellites of Typhoon No.1 (MALAKAS) in 2022
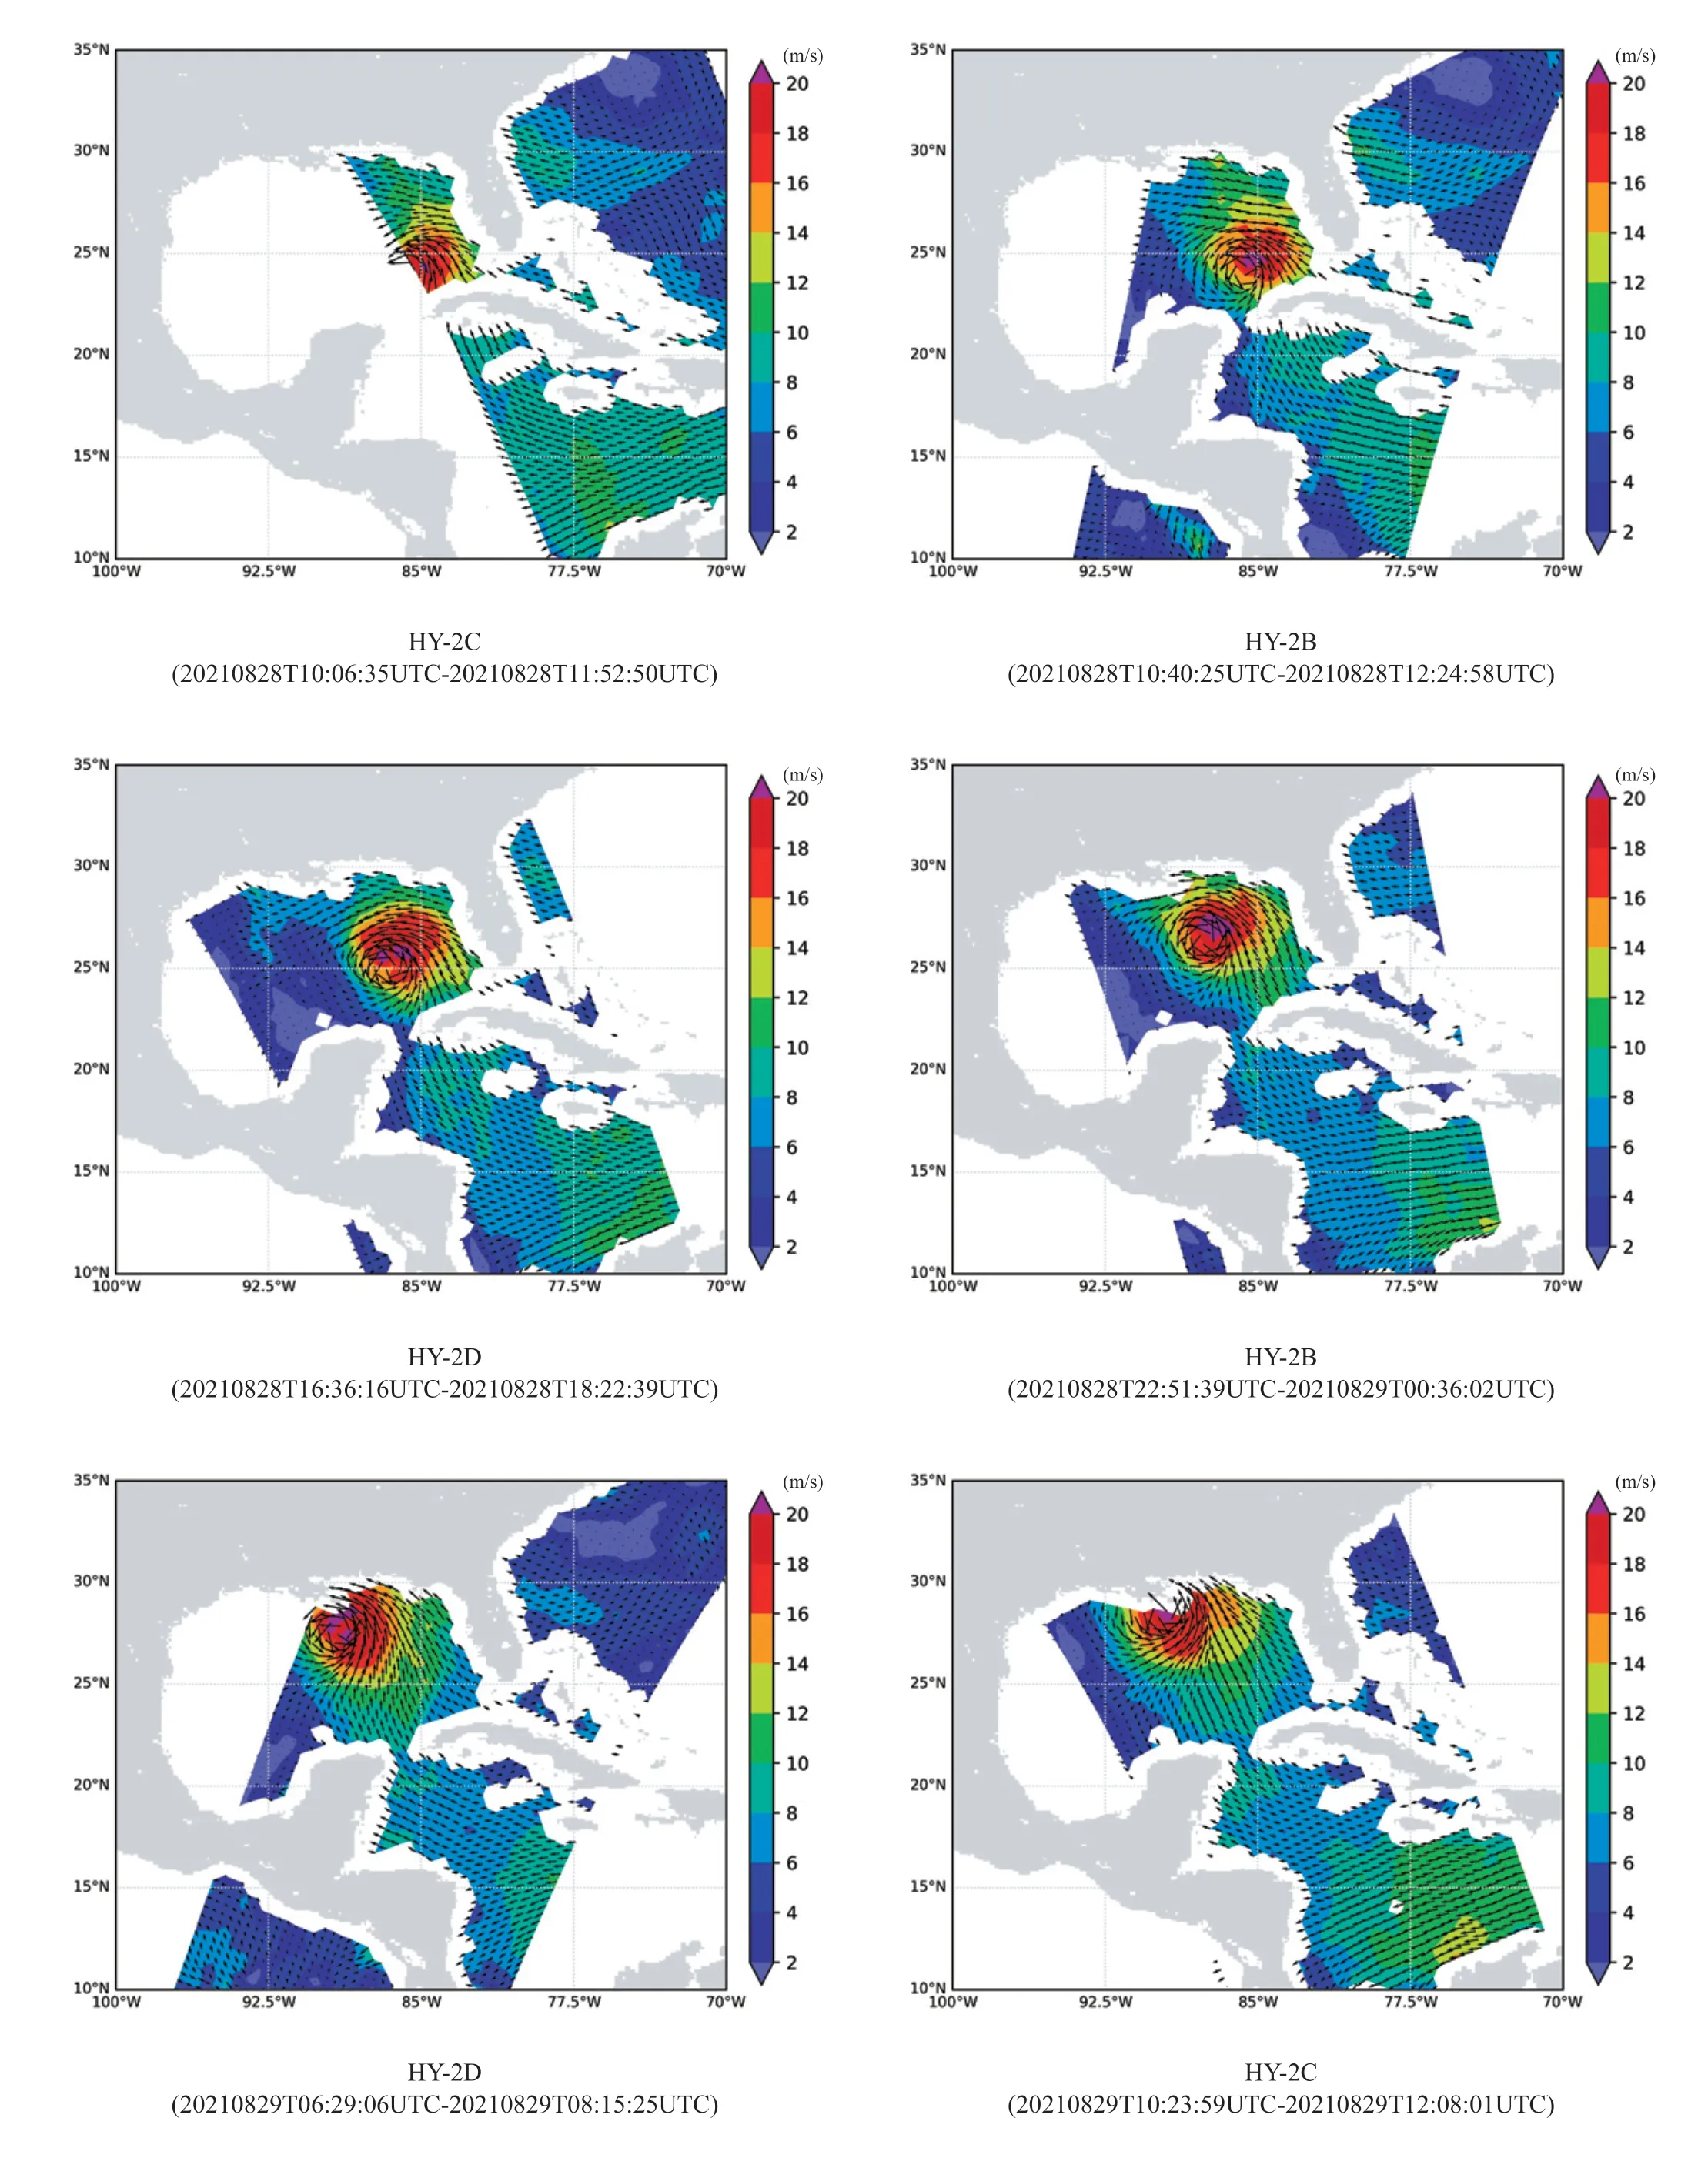
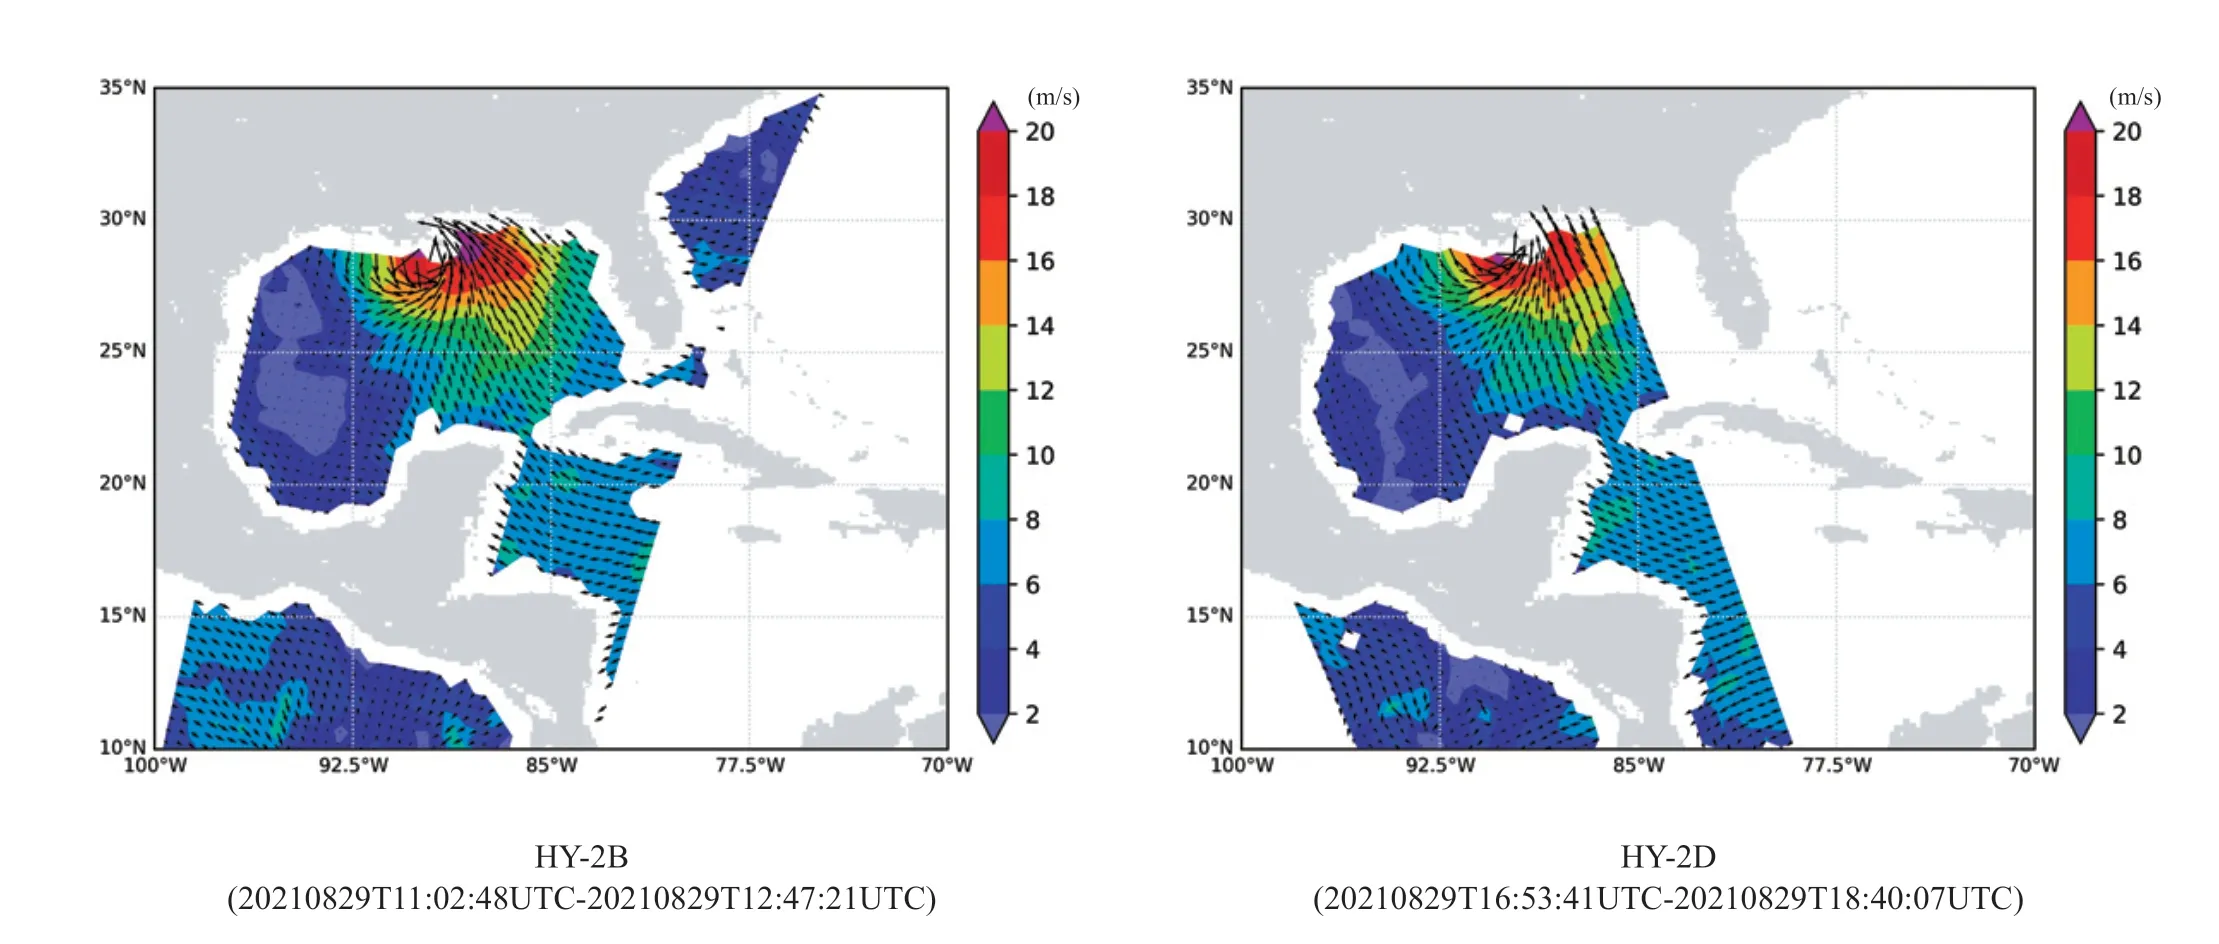
Figure 13 HY-2B/C/D joint observation of Hurricane IDA
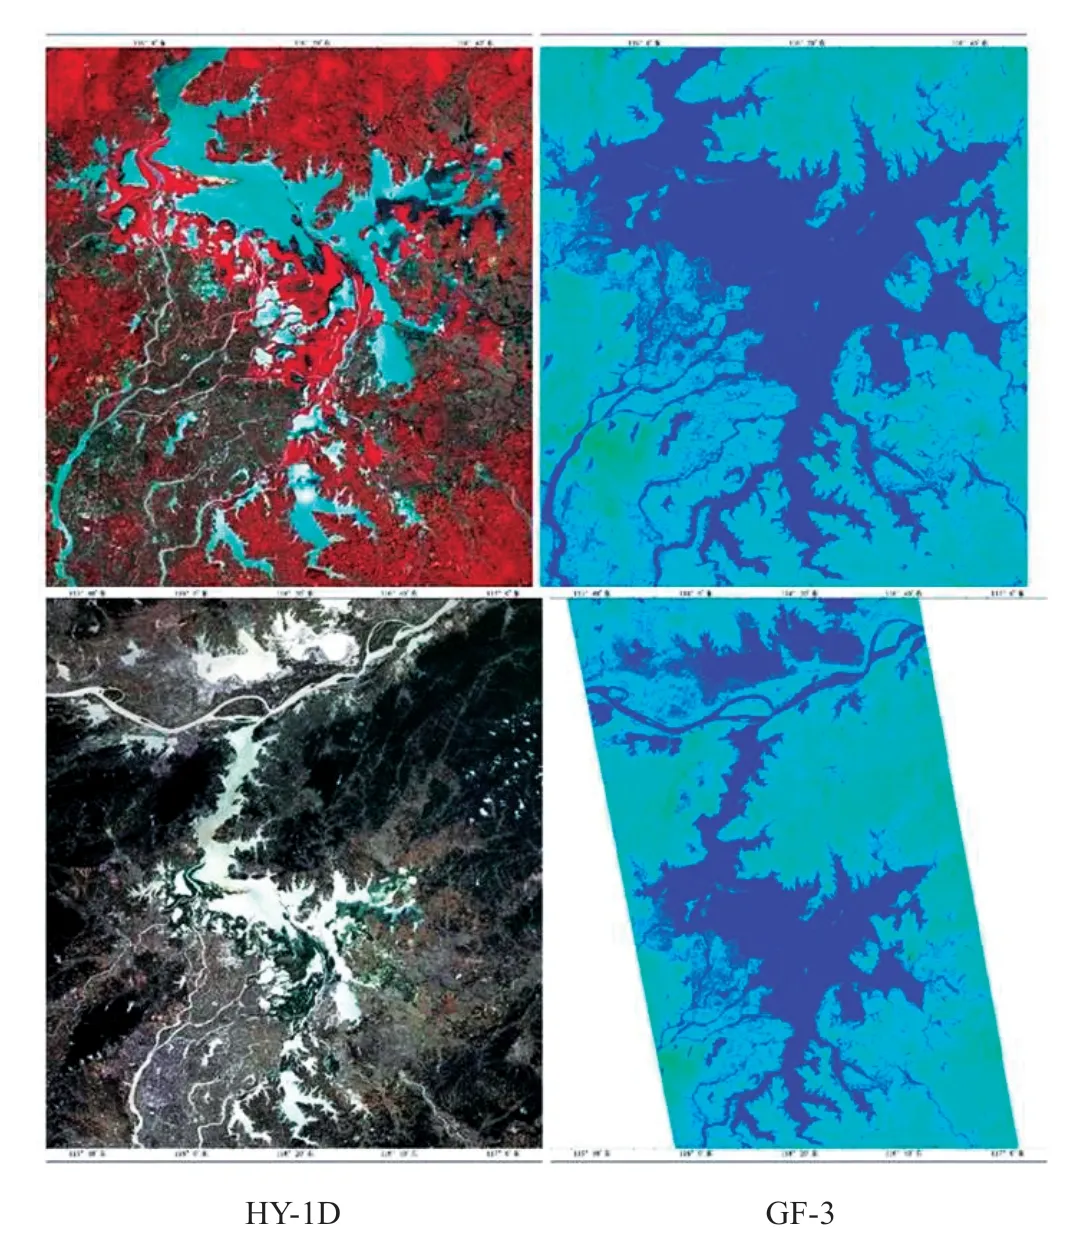
Figure 14 Multi-satellite water monitoring in Poyang Lake
4.5 Land and Water Monitoring
During the period from March 29 to May 31,2021,the HY-1C/D satellite CZIs took 42 photos of Poyang Lake area,as shown in Figure 14.There were 3 sunny days on April 9,April 30 and May 1 with a clear sky,accounting for less than 10%,and more than 90% of the time was cloudy and rainy.Two sets of all-weather and all-time SAR data were obtained when the data from the GF-3 satellite was combined.The remote sensing thematic maps of the HY-1C/D satellites,GF-3 satellite and relevant data provide a strong basis for rapid response to floods.
4.6 Marine Ecological Environment Monitoring
Land-based pollution emissions,marine production and operation activities,oil exploitation and transportation have led to changes in the marine ecological environment,and some activities endanger the marine ecological security.The impact can be continuously observed by multiple marine satellites.
4.6.1 Red tide
Red tide is an abnormal phenomenon of the marine ecosystem that occurs frequently in China’s offshore waters.The explosive and rapid reproduction of plankton in the ocean causes the sea water to show different colors such as yellow,green,brown and red.In recent years,HY-1C/D satellites have been used to monitor many red tide events in the Bohai Sea,Yellow Sea,East China Sea and South China Sea,obtaining important information such as its location and impact range,which is provided to relevant business departments.The red tide in Zhujiang River estuary is shown in Figure 15.
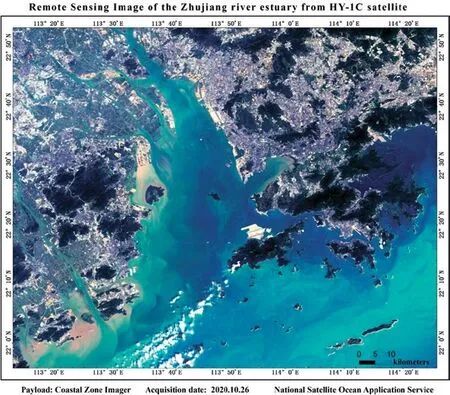
Figure 15 Red tide in Zhujiang River estuary
4.6.2 Green tide (Enteromorpha prolifera) monitoring
Since the outbreak of Enteromorpha prolifera in Qingdao in 2008,Enteromorpha prolifera monitoring has become an operational monitoring activity.The information on Enteromorpha prolifera and sargassum in the Yellow Sea and East China Sea has been extracted by using a variety of satellite data such as HY-1A/B/C/D,EOS/MODIS and GF satellites,which has realized the early detection and whole process tracking and monitoring of green tide disasters,and provided accurate and timely information services for the prediction of green tide drift path and disaster prevention and reduction.
4.6.3 Oil spill pollution
Oil spill pollution does great harm to the marine environment,marine ecology and human economic life.Marine oil spill can be detected by microwave radar,optical remote sensing,and thermal infrared,ultraviolet and other remote sensors.The 50 m CZIs of the HY-1C/D satellites and the GF-3 satellite were used to monitor multiple oil spills in the Bohai Sea,the South China Sea and the East China Sea.Figure 16 shows the HY-1C/D satellite monitoring of oil spill pollution.
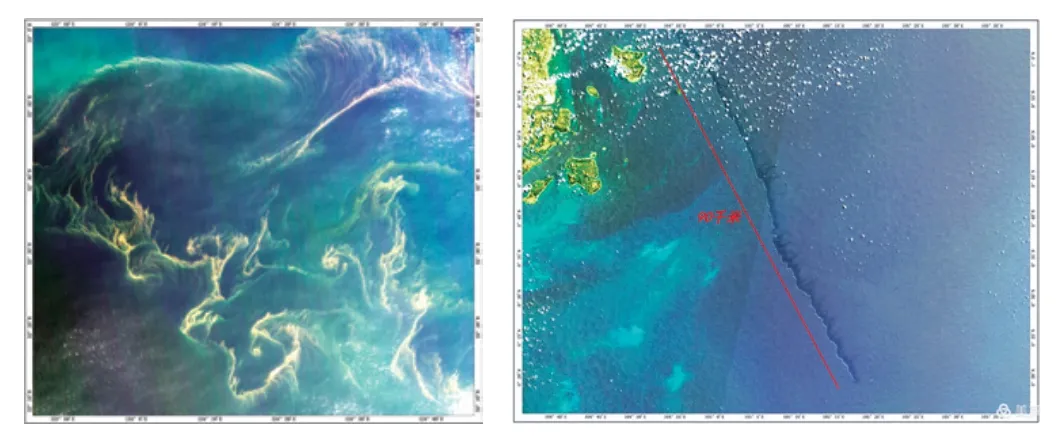
Figure 16 HY-1C/D satellite monitoring of oil spill pollution
4.7 Forest Fire Monitoring
Taking advantage of the short revisit period of HY-1C and HY-1D satellites and the high signal-to-noise ratio of CZIs,effective monitoring and analysis have been carried out on forest fires in Russia,Turkey,Australia,Brazil,the United States,Myanmar,Ukraine,India,Indonesia and other countries,as well as Qingdao,Shanxi,Guangdong,Sichuan,Yunnan,Jiangxi,Beijing and other places in China.After the disaster,the thematic maps of fires were obtained through the analysis of vegetation changes and smoke directions of multi-temporal images,and were provided to the emergency management department and the front headquarters of relevant provinces for the first time,providing effective services for emergency relief.Figure 17 shows the HY-1C/D satellite forest fire monitoring.
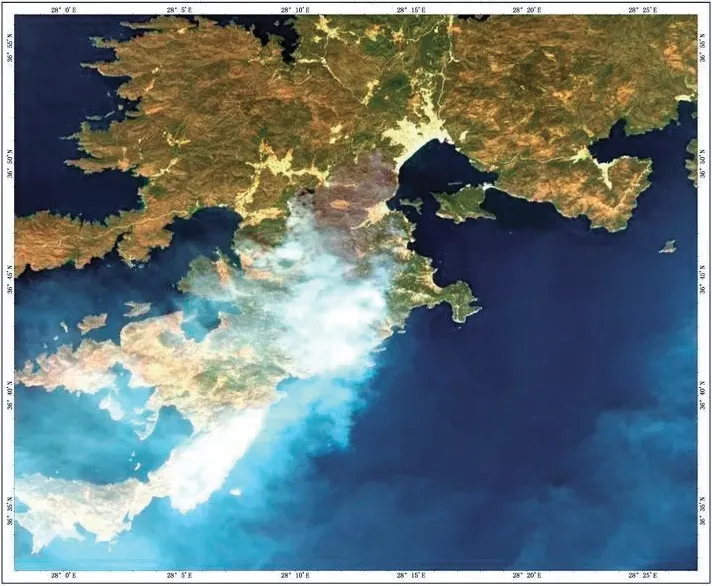
Figure 17 HY-1C/D satellite forest fire monitoring
4.8 Sea Ice Monitoring
HY-1C,HY-1D,GF-3 and MODIS satellites are used to monitor the changes of sea ice in the Bohai Sea and the Yellow Sea from January 21 to February 20,2022.During this period,the sea ice reached its maximum.From February 5 to 13,due to the weak cold air,the sea ice melted periodically,and the sea ice increased rapidly due to a cold wave after 15 days.The CZIs on HY-1C and HY-1D have become the preferred data source for sea ice monitoring because of the advantages of dual satellite networking,providing wide coverage and high signal-to-noise ratio.GF-3 satellite data has become an effective supplement to optical measurement in cloud covered weather.MODIS data is used to make up for the lack of regional coverage of domestic data sources.The HY-1 C/D and GF-3 satellite sea ice monitoring are shown in Figure 18 and Figure 19 respectively.

Figure 18 HY-1 C/D satellite sea ice monitoring

Figure 19 GF-3 satellite sea ice monitoring
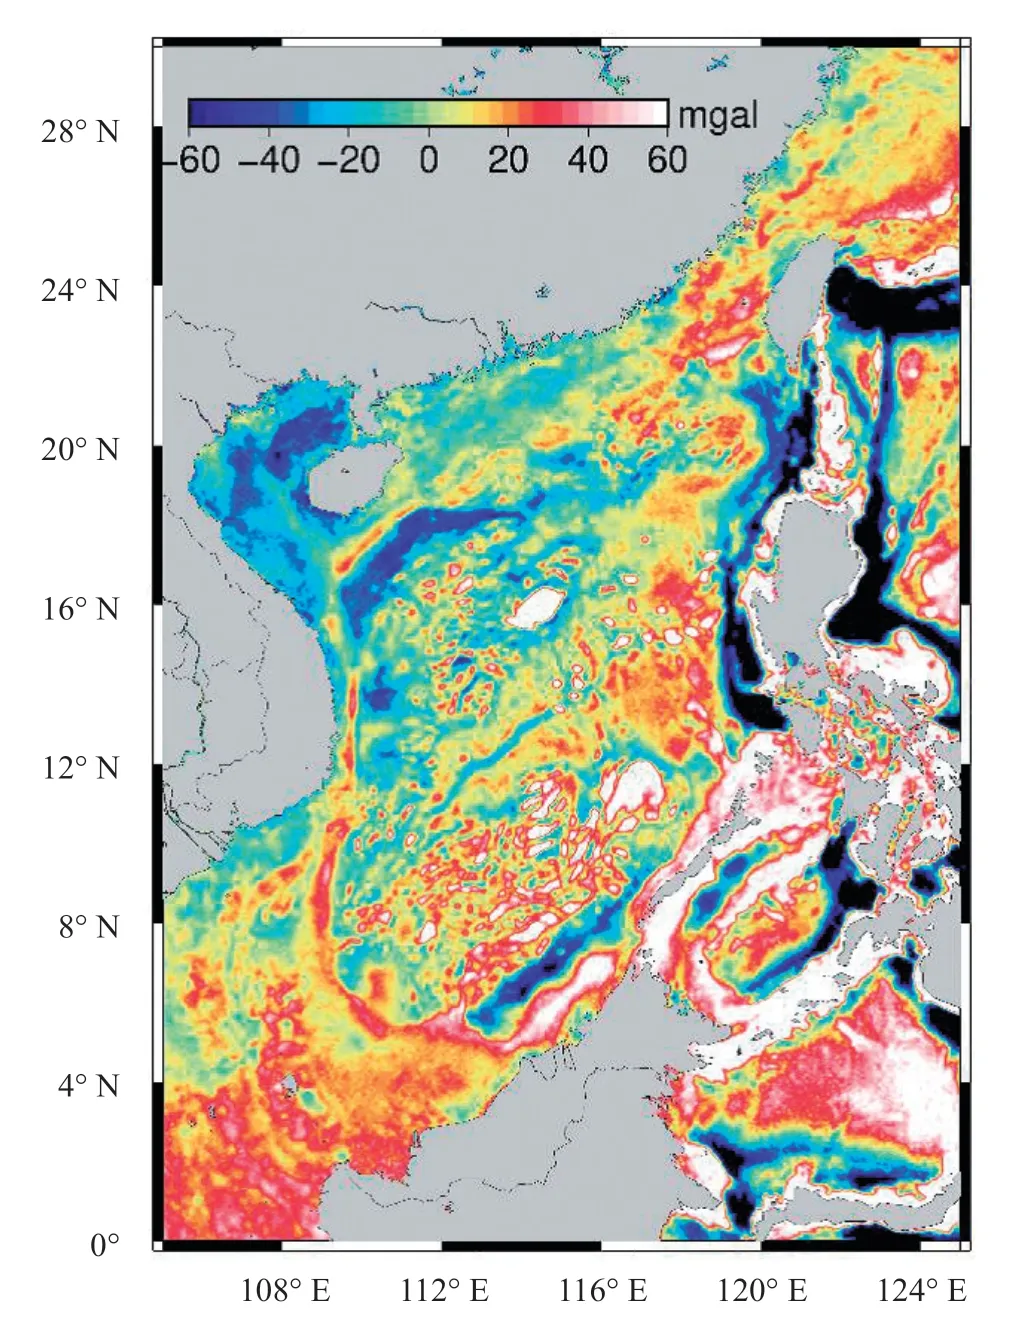
Figure 20 Gravity anomaly in the South China Sea
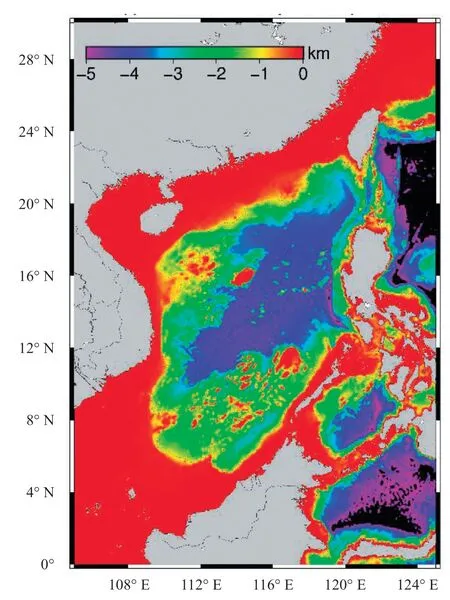
Figure 21 Seafloor topography in the South China Sea
4.9 Application of HY-2 Satellite Data in Geodesy and Geophysical Research
The HY-2 series of satellites are equipped with radar altimeters,which can provide more sea surface height (SSH) data for the research of Geodesy and geophysics.Using the SSH data obtained by HY-2A geodetic model (GM),the retrieved 1'×1' of the South China Sea grid gravity anomaly is better than 6 mgal.The deeper the water depth in the area without large seabed structure,the higher the inversion accuracy.The reliability of HY-2A/GM altimetry data applied to the inversion of gravity anomalies in the South China Sea was verified.
5 CONCLUSION
China’s ocean satellites have realized multi-satellite networking operation,including the ocean color satellite constellation consists of HY-1D and HY-1C satellites,the ocean dynamic environment satellite constellation with HY-2D,HY-2B and HY-2C satellites and the ocean environment monitoring satellite constellation composed of GF-3,GF-3 02 and GF-3 03 satellites,and have the efficient observation ability in ocean color,ocean dynamic environment and marine environment monitoring.The completion of the construction of ocean satellite networks has effectively promoted the application of satellite data products in many fields,such as for ocean environmental monitoring,ocean disaster prevention and mitigation,marine scientific research and polar research.
The subsequent development of ocean satellites will not only provide services in many fields,but also continue to improve in accuracy,spatial resolution and timeliness of satellite observation.Further build a complete space-based ocean observation system with high and low orbit coordination,sun-synchronous and non-sun-synchronous orbit satellites,and low,medium-and high-resolution observation capabilities,so as to realize the synchronous acquisition of large-,medium-and small-scale marine environmental information and the simultaneous observation of ocean surface,subsurface and seabed information.
杂志排行
Aerospace China的其它文章
- Shenzhou 12 Under Development
- The Development of Memory Alloy Satellite-Rocket Separation Device for Commercial Small Satellites
- A Brief Introduction to China Manned Space Program Missions
- The Propulsion System of Shenzhou 13 Manned Spaceship
- Development of Solid Rocket Motor for Manned Launch Vehicle Escape System
- High Reliability LM-2F Launch Vehicle for Space Station Mission
