Passenger management strategy and evacuation in subway station under Covid-19
2022-08-01XiaoXiaYang杨晓霞HaiLongJiang蒋海龙YuanLeiKang康元磊YiYang杨毅YongXingLi李永行andChangYu蔚畅
Xiao-Xia Yang(杨晓霞), Hai-Long Jiang(蒋海龙), Yuan-Lei Kang(康元磊),Yi Yang(杨毅), Yong-Xing Li(李永行), and Chang Yu(蔚畅)
1School of Information and Control Engineering,Qingdao University of Technology,Qingdao 266520,China
2School of Mechanical and Automotive Engineering,Qingdao University of Technology,Qingdao 266520,China
3CRRC Qingdao Sifang CO.,LTD.,Qingdao 266111,China
4Beijing Key Laboratory of Traffic Engineering,Beijing University of Technology,Beijing 100124,China
Keywords: COVID-19,social force model,subway station,evacuation
1. Introduction
Covid-19 has brought a serious threat to the safety of human life around the world and dealt a serious blow to the world economy. To 15 August 2021, the global cumulative number of confirmed cases even reached more than 214.81 million and the cumulative number of deaths was more than 4.47 million.The transportation system is particularly vulnerable under the impact of Covid-19. The conventional passenger flow management and station operation mode can not stop the spread of Covid-19 virus. It is urgent to establish new regulations to ensure the safety of passengers under the background of the epidemic.
The effectiveness verification of passenger flow management strategy in subway station under epidemic situation is a basic premise for the implementation of the strategy.Although the human experiment in the station can achieve the purpose of verification,it often needs to invest a lot of human and material resources, and the personal safety of the experimental participants is difficult to be guaranteed.[1]Thanks to the rapid development of computer systems,the passenger flow simulation in subway station based on pedestrian dynamics model provides a convenient and efficient research method to verify the effectiveness of the strategy, which has been widely recognized by scholars around the world. According to different degrees of detailed description,pedestrian dynamics models can be divided into macroscopic models and microscopic models. The macroscopic model mainly refers to the fluid/gas dynamics model,[2,3]which focuses on the study of the overall movement law of passenger flow on the basis of density and speed. The crowd object is depicted as a whole and the model calculation speed is fast,but it often ignores the behavior habits and movement law of individuals. The microscopic model[4–7]takes the individual pedestrian as the modeling object,which pays more attention to the simulation of individual motion rule and the interaction between individual and surrounding environment. The accuracy of microscopic model is usually relatively high. Microscopic models can be divided into discrete and continuous types according to their different temporal and spatial continuity. The typical discrete microscopic model mainly includes the cellular automata model[8,9]and the lattice gas model.[10,11]The social force model, as a typical representative of continuous microscopic models, has been widely used.[12–17]The social force model attributes the movement of pedestrians to the comprehensive action of various forces, and fully considers the behaviors of pedestrians such as conformity behavior,[13]anxiety state,[15]dependence on others,which can well reproduce the self-organization phenomenon of people with high accuracy. Although the calculation amount of social force model is relatively large,this problem can be overcome with the rapid development of computer technology. Therefore,this paper takes the social force model as the basic model to drive the passenger movement in the subway station. For more information on pedestrian dynamics model,please refer to Refs.[18,19].
The environment and passenger flow streamline in the subway station are relatively complex. The space size and layout of the station hall, platform, stair/escalator and other areas are quite different. In addition,the walking status,travel purpose, choice preference, vision range and familiarity with the subway station are different. The heterogeneity of passengers and the complexity of the environment have brought great challenges to the passenger flow management and evacuation.Many scholars conducted in-depth research on passenger flow management and evacuation from different study angles, and achieved excellent results. Jinet al.[20]studied the temporal and spatial distribution characteristics of passenger evacuation when key nodes such as ticket gates failed under the condition of multiple disaster coupling. Stubenschrottet al.[21]established a route selection model for high density passenger flow in subway stations. Zhouet al.[22]pointed that passengers with luggage and panic could hinder passenger evacuation.Yanget al.[23]studied the influence of passenger heterogeneity on boarding and alighting behavior at subway platform.
Under the strong and lasting impact of Covid-19,the operation management strategy of subway station and the individual travel characteristics of passengers have changed. Taking the subway stations in Chinese mainland as an example,the rules of testing health codes and keeping the waiting distance between passengers are added to reduce the risk of cross infection.These management strategies could undoubtedly affect the passenger flow efficiency in the station. Line 5 of Zhengzhou Metro in China was besieged by flood on 20 July 2021 due to severe rainstorm, resulting in the tragic death of 14 passengers. This tragedy reminds us that Covid-19 is not the only threat to the safety of passengers in the station. Emergencies such as flood disaster still exist, and the emergency evacuation of passengers in the subway station under the background of the epidemic and emergency should also be paid attention to. Therefore, this paper will analyze the effectiveness and related impact of the additional passenger flow management strategies in the subway station from the perspective of epidemic prevention and control, and put forward the reasonable time interval for passengers to enter the station. The emergency evacuation behavior of passengers under the epidemic situation will also be studied, which could reflect the harm of passenger evacuation without protection under the epidemic situation. The results could provide a certain theoretical basis for the operation and management of subway station under the Covid-19.
The structure of this paper is as follows: Section 2 describes the social force model that could drive passenger motion, and introduces the minimum cost model that is a specific mechanism of passenger route selection. Jinggangshan Road subway station in Qingdao, China is taken as an example in Section 3, the effectiveness of the simulation model is verified by comparing the field passenger flow data with the corresponding data obtained by simulation. Section 4 sets the basic parameters in the passenger arrival scene and evacuation scene. Section 5 demonstrates the reliability of setting the arrival time interval and the harm of passenger evacuation without protective measures by analyzing the simulation data.Section 6 summarizes the conclusion of the paper.
2. Model
This section mainly introduces the social force model driving passenger movement in the subway station and the minimum cost model to realize the function of passenger route selection.
2.1. The social force model
The social force model is a spatial continuous microscopic model,[4,5]which can be used to characterize the psychological states of individual pedestrians such as tension,anxiety and their interaction with the surrounding individuals and environment. The model could also reproduce the self-organization phenomena such as zipper effect, lane formation and arching phenomenon,which are very close to reality. The social force model is built based on Newton’s second law,which mainly includes the self-driven forcef0i,the force between peoplefi j,and the force between pedestrians and obstaclesfiW,expressed as
The forcefi jcan not only reflect the pedestrian’s willingness to keep a certain distance from the surrounding pedestrians, but also include the extrusion force and friction force generated during physical contact. It is expressed as Here,diWmeans the distance to wallW,niWrepresents the unit vector pointing from pedestrianito wallW,ti jdenotes the direction tangential to wallW.

2.2. The minimum cost model
Path selection behavior is an important part of passenger travel in subway stations. Loet al.[24]proposed an exit selection model based on game theory, and proved that the interaction of evacuees could affect the evacuation mode in multiple exit conditions. Xuet al.[25]used the combination of Bayesian information and metropolis-hasting sampling to model the route selection behavior of passengers based on the data of automatic fare collection, timetable and train loading data.At present,a large number of studies have focused on the modeling of pedestrian path selection behavior.[26–28]In this paper,the minimum cost model is taken as the passenger path selection mechanism,mainly because it comprehensively considers the distance, congestion and path conditions between the starting position and the target,which has high reliability,fast calculation speed and strong real-time performance. In addition,this paper also proves that the minimum cost model can truly reflect the path selection behavior of passengers in the actual subway station in the model validation of the next section.
The minimum cost model is expressed as
where cost is the total travel time cost,DGis the distance from the current position of the pedestrian to the destination;v0is the average desired speed of the pedestrian,v0=1.35 m·s-1;WDis the distance weight,WD=1.Qis the desired time spent in the queue before reaching the destination;WQis the queue weight,WQ=1.Lis the cost of geometric component;WLis the geometric component traversal weight,WL=1.
3. Model validation
The subway station has the characteristics of large passenger flow,strong personnel mobility and high concentration of population density,[29]which undoubtedly could increase the infection risk of passengers during the epidemic and also increase the difficulty of epidemic prevention and control in the subway station. Therefore, it is of great significance to study and analyze the passenger flow in subway stations from the perspective of epidemic prevention and control. In order to make the research content more authentic, this paper takes Jinggangshan Road station of Qingdao metro as the simulation example to carry out relevant analysis.The movement behavior and path selection behavior of passengers are realized based on the social force model and the minimum cost model described in Section 2,and the evacuation experiment of heterogeneous passenger flow in subway station is built based on Massmotion software.
The basic situation of Jinggangshan Road station is first introduced in this section. Then, the basic parameters in the simulation model are set according to the field investigation results. By comparing the field data with the simulation data,the effectiveness of the built passenger motion model in the subway station is further illustrated.
3.1. Introduction to Jinggangshan Road station of Qingdao metro
Jinggangshan Road subway station is the transfer station of Qingdao Metro Lines 1 and 13. The station is a typical island station,which adopts two-story underground structure.There are two entrances and exits C and D.Each entrance and exit is equipped with the staircase and escalators as shown in Fig. 1(a). The station hall in Fig. 1(a) is divided into two parts by the ticket gate. The red area is called station hall 1, which is connected with the entrance and exit through the stair/escalator. The blue part is called station hall 2, which is connected to the platform through the stair/escalator. The outbound gate is set on both sides of the station hall, and the inbound gate is set in the middle of the station hall. An elevator is built next to entrance and exit D for passengers who are inconvenient to walk, as shown in Fig. 1(b). The platform is equipped with two stairs parallel to each other,and escalators for passengers to go up and down are set on both sides of each stair. The layout chart of platform floor is shown in Fig.1(c).
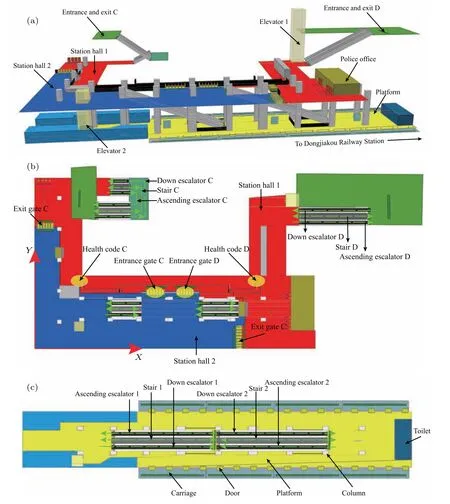
Fig.1. Qingdao Jinggangshan Road station. (a)Three-dimensional diagram of Qingdao Jinggangshan Road station. (b)Layout of hall floor.(c)Layout of platform floor.
3.2. Validation of simulated passenger behavior in subway station
During the simulation experiment, the parameters in the model are set according to the field data. For example, the field survey results indicate that it takes 42 s for passengers to arrive at the station hall from the platform by escalator,and the ticket gate has a time delay of about 2 s for passengers. Therefore, setting the speed of the ascending escalator to 0.7 m/s and setting the gate to produce a time delay of 2 s in the simulation process can basically ensure the consistency between the simulation results and the field sampling data.
The range of passenger activities in the subway station is large and the composition of passenger flow is complex. The validation of the model is realized by comparing the field value and simulation value of the time required from passengers getting off to the outbound gate,as shown in Figs.2(a)and 2(b).The specific steps of model validation are as follows.
When the train arrives and opens the door,start to record the time dataTffor each passenger from getting off the train to passing through the ticket gate. Collect 5 groups of field data using the same way.
Generate the same number of outbound passengers corresponding to each group of field data in the simulation, and extract the simulation time dataTswhen alighting passengers arrive at the outbound gate.
The simulation data are compared with the corresponding field data to verify the effectiveness of the model.
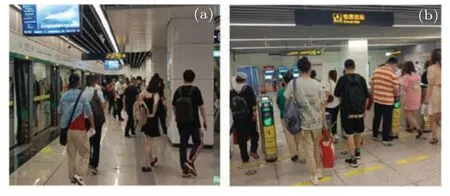
Fig. 2. Snapshots of passenger leaving the station of Qingdao Jinggangshan Road station. (a) Snapshot of passenger getting off. (b) Snapshot of passenger passing through the gate.
Table 1 lists the mean,variance and standard deviation ofTfandTs.Table 1 reflects that the difference between the mean value ofTfand mean value ofTsin each case is small,and the variance value ofTfis often higher than that ofTs. Comparing the passenger departure process in the field case with that in the simulation case,it can be found that passengers in the field case occasionally receive and make calls, go to the bathroom and so on. The consistency of the field time data of these passengers is poor. However, the number of these passengers is small,and their impact on the mean data of overall time is limited. Since the model simulates the normal outbound behavior of passengers, passengers often arrive continuously andTsis relatively centralized and uniform as shown in Fig.3.

Table 1. Comparison of mean,variance and standard deviation between field data and simulated data.

Fig.3 Comparison of passenger arrival time distribution between field and simulation cases.

Table 2. Normal distribution test of field data. Sig.: significance,d.f.: degree of freedom.
Tables 2 and 3 show the normality test results ofTfandTs, respectively. It can be seen that the significance value of data test for each case is greater than 0.05. Therefore, it can be considered that both the simulated data and the field data conform to the normal distribution under the 95%confidence level.This indicates that the model can basically simulate passenger behavior from a microscopic perspective.
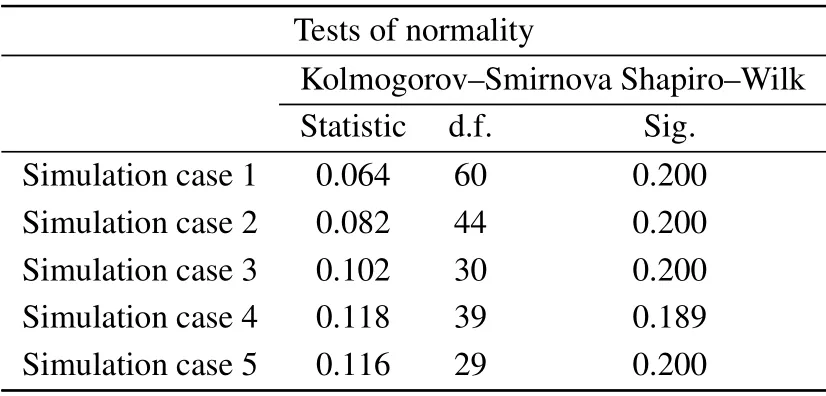
Table 3. Normal distribution test of simulated data.
SinceTfandTsconform to the characteristics of normal distribution, we can use independent sample test to further verify the reliability of the model. Table 4 shows the independence test results betweenTfandTsin each case, and the confidence level of the test is set to 0.95. It can be seen from Table 4 that the corresponding significance value of Leven in each case is greater than 0.05, which means that the variance ofTfandTsin each case is homogeneous. In the mean value equivalencet-test,the significance value of each case is larger than 0.05,it can be considered that there is no statistically significant difference between the field data and the simulated data.
To sum up,TfandTsare approximately in line with the normal distribution. Under the confidence level of 0.95, the variance and mean ofTsare close to those ofTfin the same case. The data obtained from the simulation experiment with the model has high reliability.
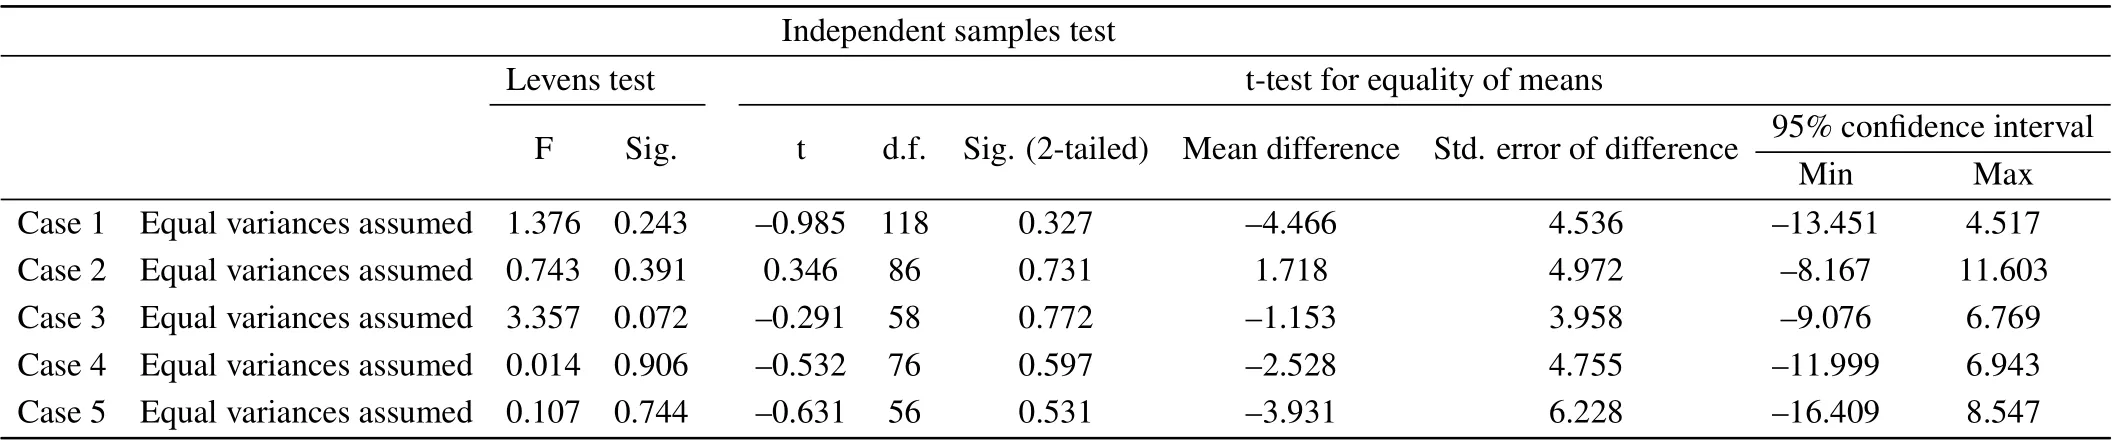
Table 4. Independence test of simulated data and field data. F:F statistic,t: t statistic,Std.: standard,Min: minimum,Max: maximum.
4. Parameter setting in simulation
4.1. Parameter setting of inbound passenger
This paper adopts the method of controlling variables.Taking the arrival time interval of passengers as a single variable, the experimental simulation is carried out only for the inbound passengers,which can better reflect the impact of arrival time interval on passenger social distance. This is also conducive to more accurate analysis of simulation results and search for relevant laws.
In order to avoid contact between passengers in the subway station, passengers always give priority to the route on the same side of the entrance. Taking China as an example,the safety distance between passengers should be greater than 2 m according to the epidemic prevention safety requirements,so the independent safety area of passengers should be greater than 3.14 m2. In this paper, it is assumed that the minimum safety distance between passengers isL=2 m,the minimum independent safety area of passengers isS=3.14 m2,and its radius isR=1 m, as shown in Fig. 4. If the social distance between passengers is less than 2 m,it is defined that passengers will have risk contact. At the same time, the unit area is defined as a circle with any point in the station as the center and 1 m as the radius. The more passengers in the unit area,the greater the risk of infection of passengers. The area of the platform is about 780 m2. In order to ensure the safety of waiting passengers at the platform, the maximum number of people entering the station within one headway is 250. In the simulation experiment, we also set the number of passenger entering the station as 250.
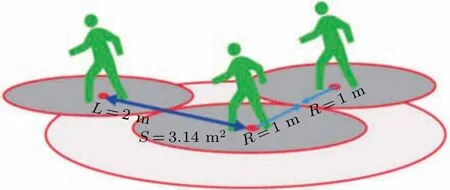
Fig.4. Schematic diagram of passenger safety area.
Field investigation in China shows that most subway stations control the distance between passengers by setting the time interval between inbound passengers. In order to control the passenger spacing and ensure the traffic efficiency, a reasonable time interval value requires to be obtained. Five different time interval values are set for simulation experiments as shown in Table 5. Among them, case C1 is a simulation scene without time interval,which is used as the control group of other cases. Note that the number of passengers and passenger attributes in all simulation cases are the same, but the value of inbound time interval is different.

Table 5. Parameter setting of inbound passengers(in units of persons,i.e.,p)in simulation experiment.
4.2. Parameter setting of evacuees
In the passenger evacuation simulation experiment, the passengers at the platform are selected as the main body of evacuation, and the arrival of passengers at the entrances and exits C/D is taken as the sign of the end of evacuation. Moreover, different density values of passengers at the platform listed in Table 6 are set to have a deeper analysis of the evacuation characteristics of passengers. The passengers are randomly distributed at the platform in the initial stage of evacuation.
In the simulation process, the radius and speed of passengers are set according to the field observation and statistics data collected in the subway station and also in combination with the passenger attribution parameters in Ref.[23]. In addition,the model validation in Section 3.2 also shows that the attribute parameters set in this paper can reflect the motion characteristics of passengers in the actual scene.
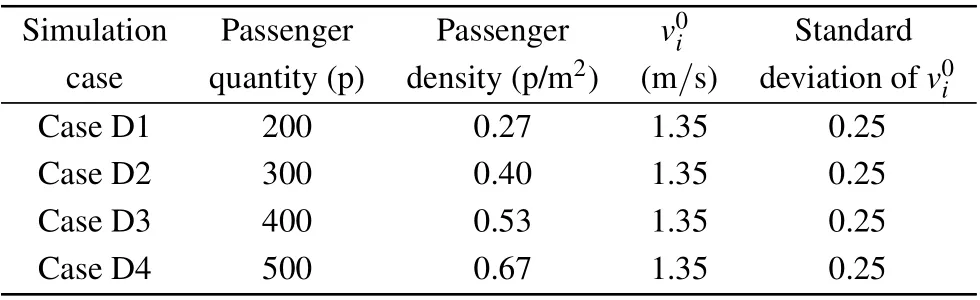
Table 6. Parameter setting of evacuees in simulation experiment.
4.3. Color mapping for the level of service
Color mapping transforms density values into colors in the chart. Density color mapping can also be used to color individuals. Color values are taken from Fruin standard and IATA (International Air Transport Association) service level mapping. Among them,white is used to indicate that no individual walks in the area.
Level of service is related to the travel efficiency,comfort of passengers and so on. It is an important index to measure the travel quality of passengers. The high service level not only shows the rationality of the structural design of the subway station,but also represents the effectiveness of passenger flow management strategy. Table 7 lists the mapping of the service level corresponding to the density value during passenger evacuation. Table 8 defines the color of the area center corresponding to the contact time in the unit area. This will help us to present the dynamic attributes of passenger flow in different cases from a macroscopic perspective.
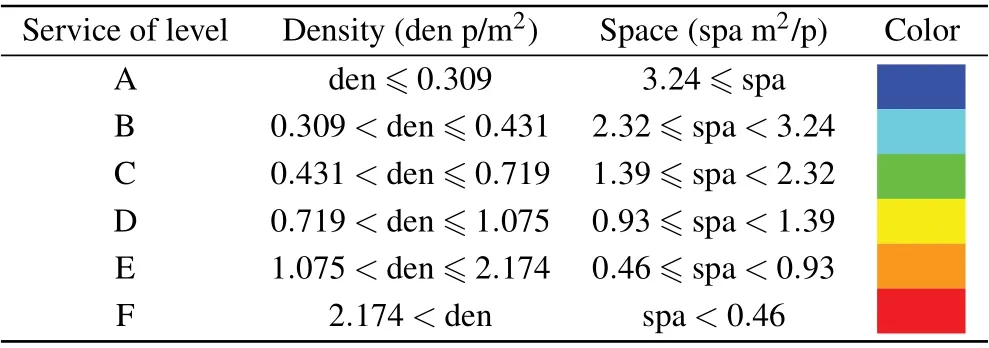
Table 7. Service levels corresponding to different passenger densities.
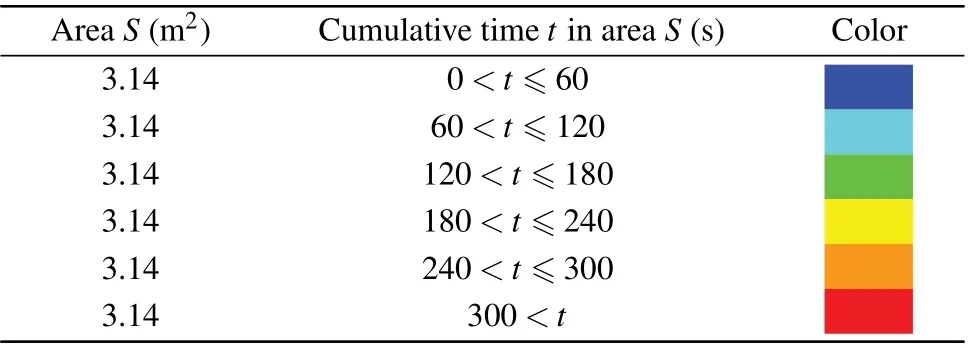
Table 8. The area center color corresponding to the cumulative of contact time of the same unit area on the passenger path.
5. Simulation result analysis
This paper carries out relevant simulation analysis on passenger flow management and evacuation under Covid-19 by taking Jinggangshan Road subway station as the simulation experiment scene. The purpose of controlling the distance between passengers is achieved by setting the time interval between inbound passengers. Firstly, the changes of passenger density at key locations,the traffic efficiency and social dance under different time intervals are studied. Then, the reasonable control value of time interval is obtained. Moreover, the evacuation of passengers in the station under the background of Covid-19 is studied.
5.1. Analysis of inbound passenger management strategy under Covid-19
5.1.1. Influence of different time intervals on passenger density
Passengers usually need to show their health code before security inspection after entering the subway station through the entrance. Therefore, passengers are easy to gather at the security inspection place and ticket gate as shown in Fig.5. In the simulation experiment,the yellow area marked in Fig.1(b)is defined as the key location of epidemic prevention and control in the subway station. In order to get the aggregation of passengers at these four locations under different time intervals, the density change of passengers at key locations in the station is characterized through regional capacity density.Note that the time interval for density data acquisition is 5 s.According to the requirements of safe social distance, the safety value of passenger area density shall not be higher than 1 p/3.14 m2=0.318 p/m2.
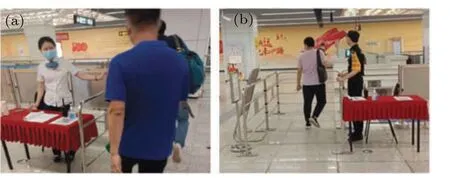
Fig. 5. Health code inspection office in Qingdao Jinggangshan Road station. (a)Health code location C.(b)Health code location D.
Figure 6 shows the comparison of passenger density changes at the four key locations which are health code location C,health code location D,entrance gate C and entrance gate D in Fig.1 under different time intervals. It can be seen from Figs.6(a)and 6(b)that when the health code is presented,the density of passengers in cases C1,C2 and C3 increases first and then decreases, and their density values exceed the safe density range for a long time,so these three cases do not meet the safety prevention and control requirements. The density value at the place where the health code is displayed in cases C4 and C5 remains low,but some density values of passengers in case C4 exceed the safe density range. The density value of passengers under the condition of case C5 is always lower than the safe density range. Therefore, only case C5, maintaining the inbound time interval at 3 s,at the place where the health code is presented can meet the safety prevention and control requirements.
Figures 6(c)and 6(d)show that the safety density requirements at the ticket gates still do not meet the requirements of safety prevention and control under cases C1,C2 and C3. The requirements are met at the entrance gate C,but not at the entrance gate D under case C4. The safety and epidemic prevention requirements can be met at the gate under case C5, but the total time taken by all passengers to complete the travel is much higher than that in the other four cases. Therefore, the inbound time interval set by case C5 is the most desirable from the perspective of ensuring the safe travel of passengers.
Fig.6. Changes of passenger density at different time intervals. (a)Health code location C.(b)Health code location D.(c)Entrance gate C.(d)Entrance gate D.
5.1.2. Influence of different time intervals on passenger traffic efficiency
In order to further explore the impact of different inbound time intervals on passenger traffic efficiency, the time data of all passengers arriving at the platform under the five cases of Table 5 is collected as shown in Fig. 7. It can be found that there is little difference in the distribution of passenger arrival time at the platform under cases C1–C4. The median arrival time of all passengers at the platform under cases C1–C4 are 260 s, 262 s, 262 s, 275 s, respectively, while the median value under case C5 is 325 s. The main reason may be that passengers can only line up at the place where the health code is checked. Although passengers could quickly arrive at the health code inspection place in the case of no time interval and small time interval,the health code inspection place plays a secondary isolation role for passengers. Only when the time interval set at the entrance is greater than the time interval of checking the health code, passengers will not be affected by the health code delay segmentation. Combined with the above data analysis, it can be obtained that when the time interval between passengers is set to 3 s, there will be no delay due to the inspection of health code. When the interval is set to 2 s, the health code inspection place will delay the traffic of passengers. However,this impact is very small.

Fig.7. Distribution of arrival time of passengers at different time intervals.
In the simulation experiment,passengers arrive at station hall 1 through stairs from the entrance, then arrive at hall 2 through ticket gate, and then arrive at the platform through stairs 1 and 2. Figure 8 shows the change of the number of passengers arriving at station hall 1, station hall 2 and platform with time under different time intervals. It can be seen that the arrival time of passengers entering station hall 1 under cases C1–C5 is about 40 s. The change of the number of passengers in the subway station with time is similar under cases C1 and C2, which may be mainly due to the limited capacity of the entrance stairs. Passengers under cases C1 and C2 are congested at the entrance. The peak number of passengers in station hall 1 under case C3 is lower than that under cases C1 and C2,but there will also be time delay when passing through the health code inspection place. Therefore,the change in the number of passengers in dtation hall 2 and platform is similar to that under cases C1 and C2. The inbound time interval of passengers entering the station under case C4 is large, and the passenger flow entering station hall 1 from the entrance is approximately equal to that entering station hall 2 through station hall 1. Therefore,it can be seen that the change of the number of passenger flow in station hall 1 is relatively stable.This also explains that the inbound time interval of 2 s is close to the delay time at the health code inspection place.
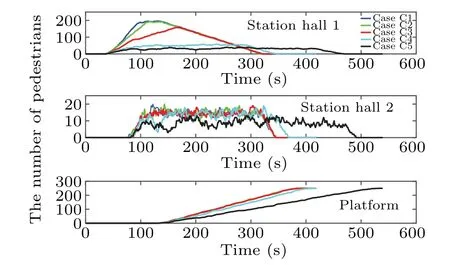
Fig. 8. Changes of the number of passengers in different areas of the station with time.
According to the above analysis, the time delay at the health code inspection place is about 2 s. The 3 s inbound time interval under case C5 is greater than the 2 s time delay,so the passengers under case C5 will not be affected by the inspection of health code,and the change of passenger quantity in each area of the station is relatively stable. Although the passenger spacing under case C5 is well controlled, the time to reach the platform is much higher than that of the other four cases.
5.1.3. Influence of different time intervals on social distance
Figure 9 shows the cumulative time of risk exposure of passengers in the same unit area under different cases in the whole simulation process. It can be found that the noninbound time interval and 0.5 s inbound time interval under cases C1 and C2 have poor control over the safe social distance of passengers, and the risk exposure time at the place where they show their health code is up to 3–4 min. This further verifies that the inbound time interval under cases C1 and C2 is not desirable. The social distance of passengers under cases C4 and C5 is well controlled,and passengers do not have a risk exposure time higher than 3 min in the whole travel process which can play an effective prevention and control effect on the epidemic.
In brief,the safest inbound time interval is 3 s after analyzing the results of Figs.7–9, even though it will reduce the operation efficiency of the subway station. If the prevention and control measures taken by passengers themselves are relatively strict(such as wearing masks and protective clothing),the inbound time interval can be controlled at about 2 s, so that there will be neither too much risk exposure nor serious impact on the efficient operation of the subway.
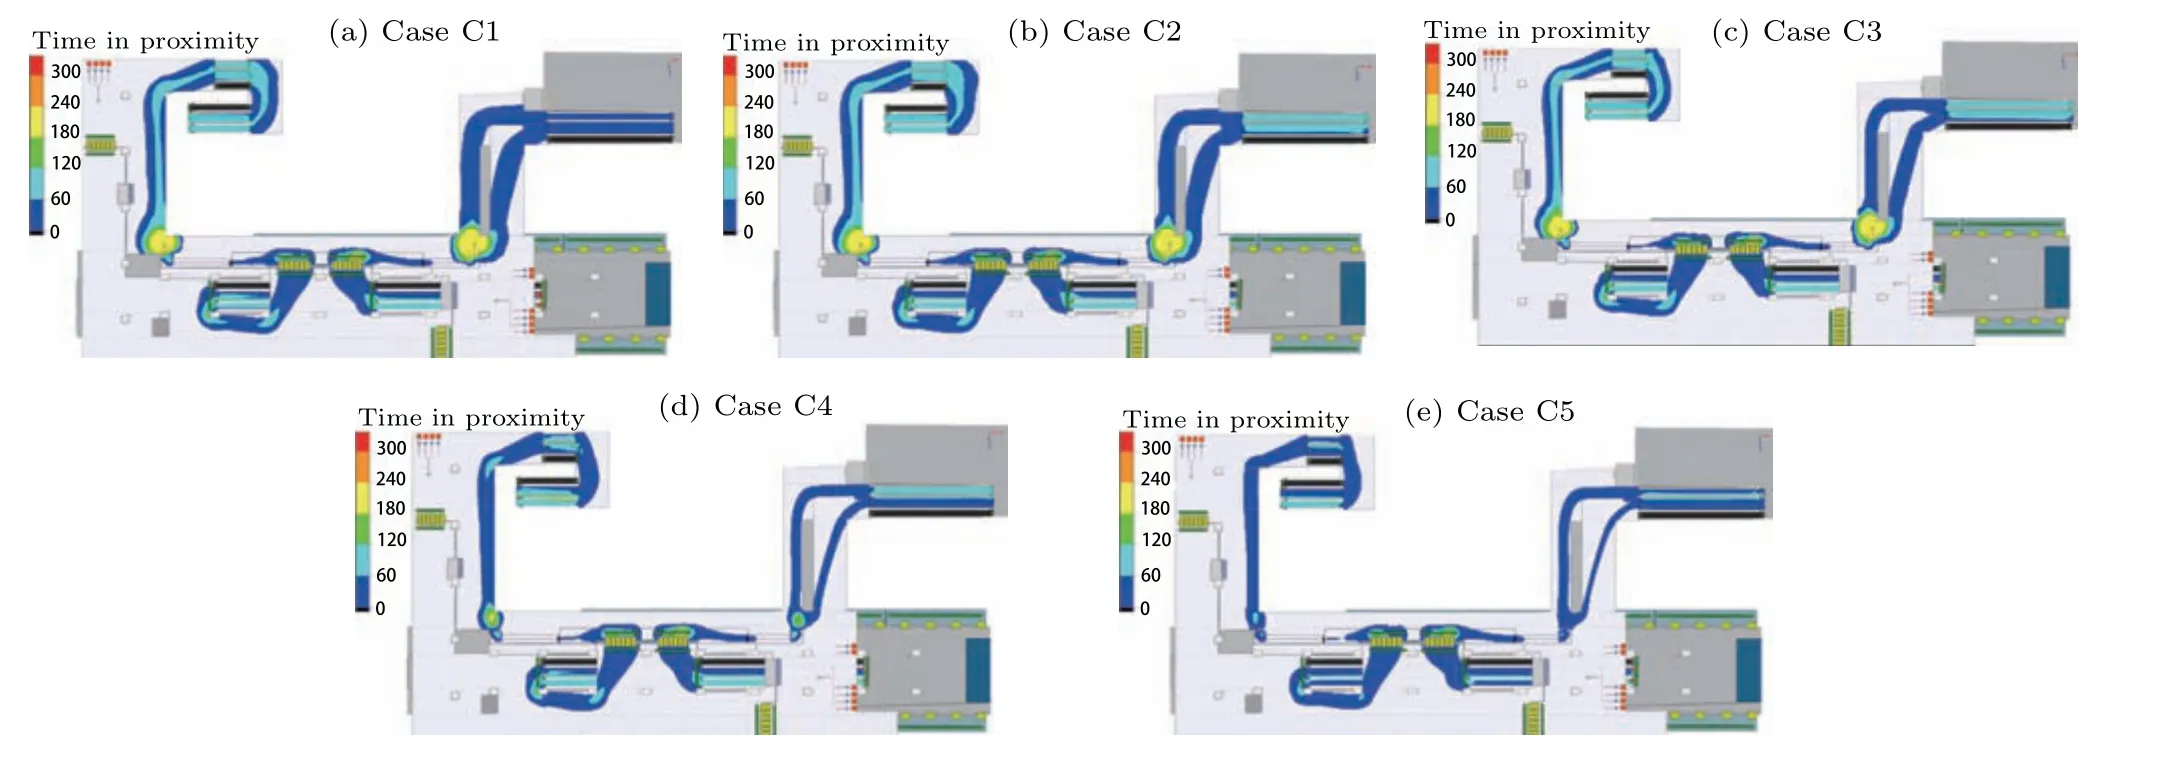
Fig.9. Cumulative contact time of passengers in various areas of the subway station during arrival.
5.2. Analysis of passenger evacuation capability under Covid-19
When there are floods, earthquakes and other emergencies in the subway station, passengers often do not take into account the impact of the epidemic situation in the process of evacuation. This has also brought serious challenges to the epidemic prevention and control of subway stations. This section mainly simulates the passenger evacuation behavior under different densities of passengers at the platform to obtain various key parameters such as passenger density,evacuation time.Furthermore,the evacuation process is analyzed from the perspective of epidemic prevention and control, so as to provide a theoretical basis for the customization of relevant evacuation strategies.
Figure 10 shows the change of the number of passengers at different density service levels with evacuation time under 4 initial densities.The simulation results in Fig.10 show that the number of people at density service levels E and F,NEFwill increase sharply in the initial stage of the evacuation experiment.Note thatNEFrepresents the number of passengers at density service levels E and F.This may be because the passengers at the platform will react quickly and gather at the entrance of the stairs/escalators at the beginning of the evacuation,but the traffic capacity of the stairs/escalators is limited. Meanwhile,NEFin case D1 is less than 50% of the total number,NEFin cases D2 and D3 is about 50%of the total number,whileNEFin case D4 is higher than 50%of the total number.This further reflects that the overall density of passenger during evacuation will also increase with the increase of the initial density at the platform, which will increase the risk of passengers infected with Covid-19 in a large area.
Figure 11 shows the comparison of passenger evacuation efficiency under different cases. It can be found from Fig.11(a)that these four cases have similar evacuation rules.The numbers of people who complete evacuation in the early and late stages of evacuation increase slowly, while the number of people who complete evacuation in the middle stage of evacuation increases approximately linearly with time and the growth rate is relatively large. At the same time,it can be observed that the evacuation time extends with the increase of the number of evacuees,and the evacuation time corresponding to case D1-Case D4 is 343 s,357 s,378 s and 414 s,respectively.Figure 11(b) shows the average evacuation speed of passengers in different cases. The average speeds of evacuees corresponding to cases D1–D4 are 0.70 m/s,0.66 m/s,0.64 m/s and 0.60 m/s,respectively,which reflects that the overall speed of evacuation gradually decreases with the increase of the number of evacuees.
Figure 12 shows the cumulative risk exposure time in each unit area of the subway station during passenger evacuation under different cases. The risk exposure time of a few areas in the evacuation path under case D1 is longer than 60 s, which indicates that the evacuation process is relatively smooth and the passenger congestion is not serious. However,the risk exposure degree of passengers under cases D2,D3 and D4 is gradually deepened. It can be seen from Fig.12(d)that there is serious risk exposure not only in the stairs/escalators and ticket gates,but also in the path section from the ticket gate to the exit stairs/escalators in case D4. This further verifies that the risk of infection in the evacuation process increases gradually with the increase of the number of evacuees.
Figure 13 shows the change of passenger density at each ticket gate with evacuation time under different cases. It can be concluded that most passengers choose entrance gate D and exit gate C for evacuation,while the utilization rate of entrance gate C and exit gate D is low. This unbalanced selection behavior further increases the congestion at some locations during evacuation,which also increases the risk of passenger infection with Covid-19. Furthermore, the number of evacuees under case D1 is 200, but the density value during evacuation is still much higher than the maximum density value of 0.318 p/m2when passengers maintain a safe distance. Combined Fig.12 with Fig.13,we can conclude that the evacuation process seriously violates the indicators of epidemic prevention and control under case D1. Therefore,the formulation of evacuation plan should comprehensively consider many factors, such as the type of emergency, the severity of the epidemic and the distribution of passenger.
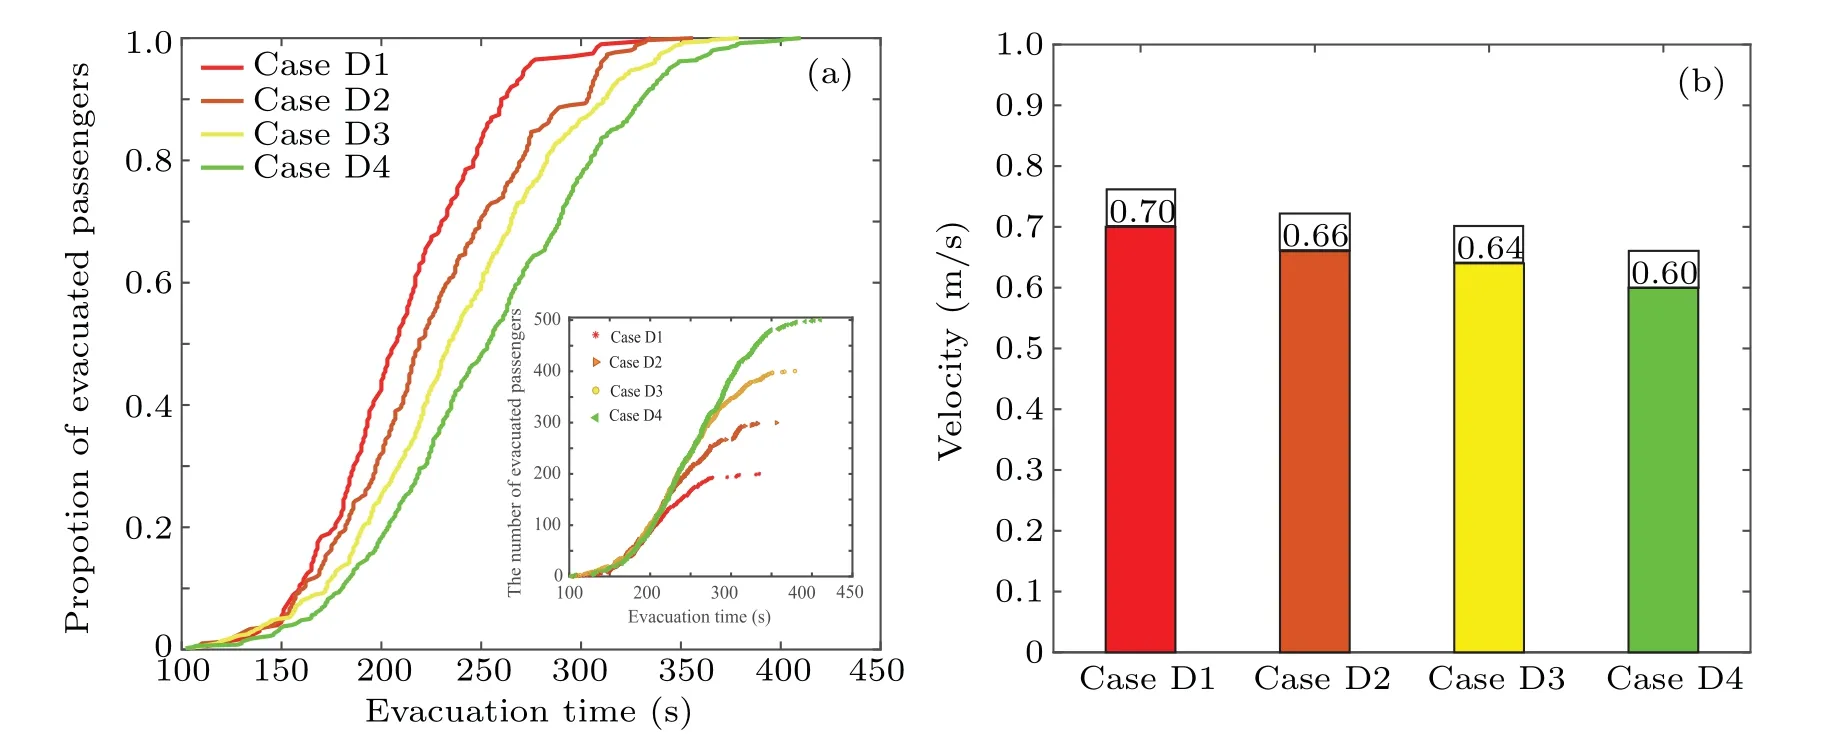
Fig.11. Analysis of passenger evacuation efficiency under different scenarios. (a)Change of evacuee quantity with time. (b)Comparison of average evacuation speed.
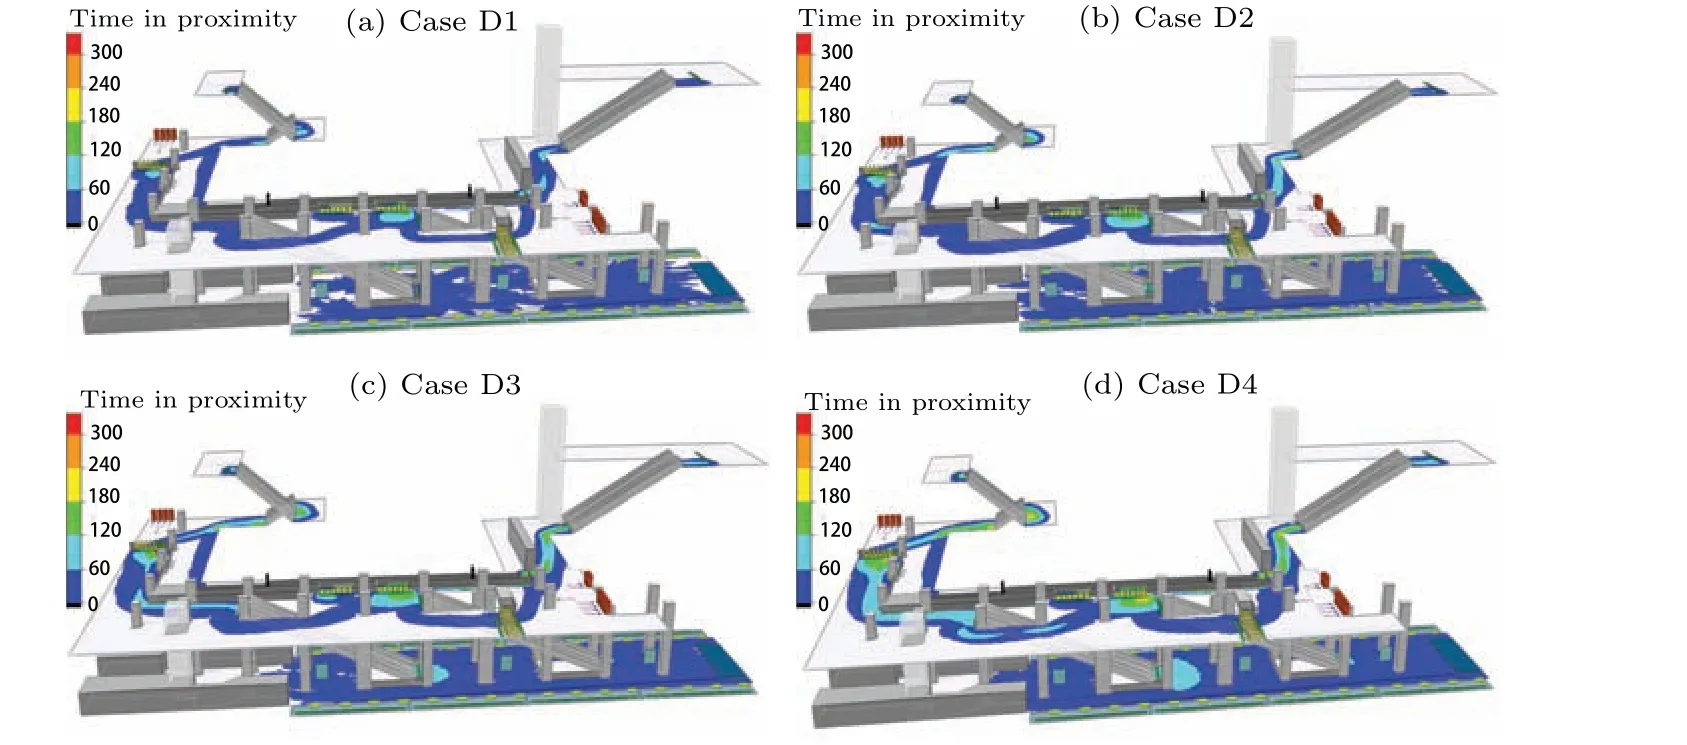
Fig.12. Cumulative contact time of passengers in various areas of the station under different cases.
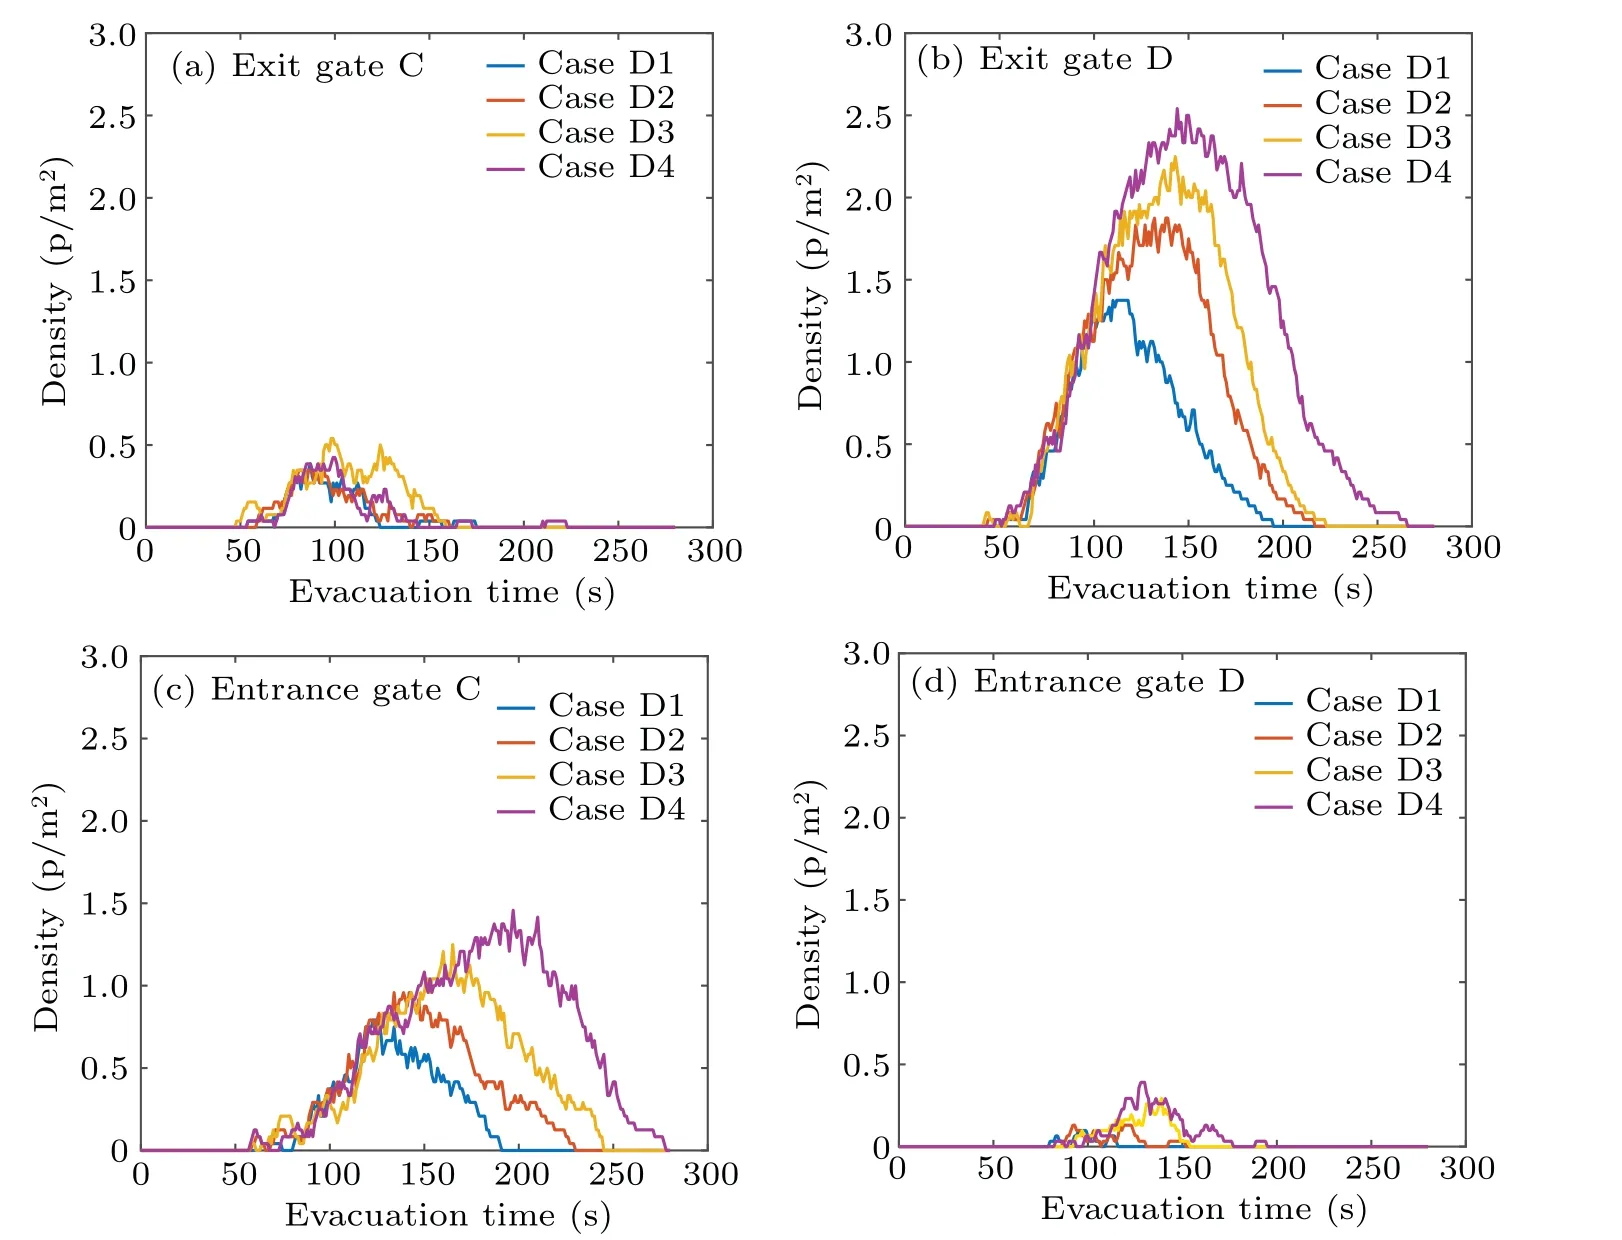
Fig.13. Density change at each gate during evacuation.
Through the analysis of the simulation results, it can be found that passengers are more likely to contact in the narrow space such as stairs and gates during evacuation. Moreover,the average speed of passengers decreases with the increase of the number of evacuees, which could greatly increase the probability of contact between passengers.
6. Conclusion
The social force model and the minimum cost model are used to describe the movement and route selection behavior of passengers, and the inbound behavior and outbound evacuation behavior of passengers in subway stations are simulated based on Massmotion. The time interval value suitable for controlling the social distance of inbound passengers is given from the perspective of epidemic prevention and control, and the passenger evacuation process under different initial densities is also analyzed. Simulation results indicate that setting the time interval between inbound passengers can effectively control the social distance between passengers in the subway station. When the time interval is controlled to 3 s,the safety area of passengers will not be violated. During the free evacuation of passengers in the station,the greater the initial density of passengers at the platform,and the longer the risk exposure time. When a small group of 200 people is evacuated, it still can not meet the safety indicators of epidemic prevention and control, which shows that the passenger evacuation strategy needs to be formulated according to the specific emergency type.This paper provides a theoretical basis for passenger flow safety management in subway stations under the background of Covid-19.
Acknowledgement
Project supported by the National Natural Science Foundation of China(Grant No.62003182).
猜你喜欢
杂志排行

Chinese Physics B的其它文章
- Real non-Hermitian energy spectra without any symmetry
- Propagation and modulational instability of Rossby waves in stratified fluids
- Effect of observation time on source identification of diffusion in complex networks
- Topological phase transition in cavity optomechanical system with periodical modulation
- Practical security analysis of continuous-variable quantum key distribution with an unbalanced heterodyne detector
- Photon blockade in a cavity–atom optomechanical system