Changes in hepatic fibrosis and incidence of HCC following direct-acting antiviral treatment of F3 chronic hepatitis c patients: a prospective observational study
2022-07-25GamalShihaRehamSolimanAymanHassanNabielMikhail
Gamal Shiha, Reham Soliman, Ayman A. Hassan, Nabiel N.H. Mikhail,4
1Egyptian Liver Research Institute and Hospital (ELRIAH), Sherbin, Mansoura 35111, Egypt.
2Hepatology and Gastroenterology Unit, Internal Medicine Department, Faculty of Medicine, Mansoura University, Mansoura 35516, Egypt.
3Tropical Medicine Department, Faculty of Medicine, Port Said University, Port Said 42526, Egypt.
4Biostatistics and Cancer Epidemiology Department, South Egypt Cancer Institute, Assiut University, Assiut 71515, Egypt.
Abstract Aim: Studies of clinical outcomes in chronic hepatitis C (CHC) patients with pretreatment advanced liver fibrosis(F3) after sustained virologic response (SVR) are scarce, and most studies are of small cohorts and retrospective in nature. Our aim was to assess the clinical outcomes following direct acting antiviral (DAA) treatment among hepatitis C F3 patients after SVR.Methods: This study included 1517 chronic hepatitis C patients with F3 fibrosis receiving DAAs in the out-patient clinics at the Egyptian Liver Research Institute and Hospital (ELRIAH). We included patients 18 years or older with HCV who received DAAs, have F3 by transient elastography, and have no history of hepatocellular carcinoma(HCC). Patients were followed up every six months after end of treatment using ultrasonography and AFP.Results: Significant improvement of fibrosis occurred with decreases in LSM, FIB-4, APRI, and FIB-6. When changes in LSM were categorized depending on delta LSM, 873 patients (57.5%) showed regression, 454 (29.9%)were stable, and 190 patients (12.5%) showed progression of fibrosis. Overall, 33 cases developed HCC during follow-up with incidence rate of 0.915/100 py (95%CI: 0.64-1.27). Incidence was high with progression of liver fibrosis (6.17/100 py) compared to patients with stable fibrosis (1.09/100 py) and regression of liver fibrosis(0.75/100 py). There were no significant differences as regards fibrosis indicators at baseline (LSM, FIB-4, APRI,and FIB-6) between those who developed HCC and those who did not.Conclusion: CHC Patients with F3 fibrosis showed a high rate of regression of fibrosis and decreased HCC incidence after achieving SVR following DAAs.
Keywords: HCC, fibrosis changes, F3, DAAs
INTRODUCTION
Viral hepatitis, particularly HCV infection, is an important risk factor for the development of liver fibrosis and hepatocellular carcinoma (HCC)[1]. Direct-acting antivirals (DAAs) yield high rates of sustained virological response (SVR) irrespective of HCV genotype, liver fibrosis stage, or previous treatment status[2,3].
Clinical outcomes in chronic hepatitis C (CHC) patients with pretreatment advanced liver fibrosis (F3) after sustained virologic response (SVR) are scarce; most studies are of small cohorts and retrospective in nature[4]. It is also difficult to establish F3 at baseline. Serological indicators such as Fibrosis-4 index (FIB-4)and aspartate aminotransferase to platelet ratio (APRI) indices cannot distinguish between patients with F3 and stage 4 liver fibrosis (F4)[5]. Furthermore, liver stiffness measurement (LSM) values used to classify F3 and F4 have wide ranges that overlap[6]. A liver biopsy can underestimate liver fibrosis or cirrhosis owing to potential sampling errors in small specimens[7]. After SVR, these restrictions become much more pronounced, and non-invasive methods should not be utilized to measure the fibrosis stage because unreliability is increased in this situation[8,9].
In clinical practice, patients with F3 are screened for HCC and varices in the same way as patients with compensated cirrhosis[1]. However, data are scarce on the course of liver disease comparing F3 and F4 stages. Studies that have reported clinical outcomes in F3 patients receiving DAAs concentrate mainly on HCC incidence and have not generally included and specific evaluations for F3 disease[10-13]. This study investigated the clinical outcomes in CHC patients who had F3 fibrosis and achieved SVR following DAAs.
METHODS
Study design
This was an observational cohort study performed at the Egyptian Liver Research Institute and Hospital(ELRIAH). Eligible participants were consecutive adult outpatients (age ≥ 18 years) with chronic HCV and F3 fibrosis assessed by transient elastography who started DAA therapy between the start of January 2015 and the end of August 2019 and at least 12 months of follow-up data. Patients had no history of HCC or current suspicious lesions. We also excluded liver transplant recipients and patients with dysplastic nodules,cirrhotic nodules, hemangiomas, hepatitis B virus or HIV co-infection, a history of interferon treatment,decompensated cirrhosis (Child–Pugh C and B with score > 7) or ascites, renal impairment, and other malignancies. Patients with clinical signs of cirrhosis (F4 fibrosis) at enrollment were also excluded.Cirrhosis was identified by more than one of the following criteria: (a) liver cirrhosis clinical signs and laboratory parameters (e.g., splenomegaly, ascites, albumin ≤ 3.5 g/dL, and platelets count ≤ 100 cmm3); and(b) the presence of signs of cirrhosis (e.g., mild splenomegaly, minimal ascites, portal vein dilatation, and collaterals) using abdominal ultrasonography.All participants were prescribed DAAs for 12 or 24 weeks according to the Egyptian national treatment protocol[14]and WHO guideline[15]for treatment of genotype 4 chronic HCV infection.
The study protocol was approved by the Research and Ethics Committee of ELRIAH. The protocol and conduct of the study complied with the Helsinki Declaration for research involving human subjects and the International Ethical Guidelines for Biomedical Research Involving Human Subjects[16]and its amendments.Written informed consent was obtained from each patient before enrollment.
Patients’ evaluation
All patients were assessed by abdominal ultrasound and triphasic multi-slice computed tomography(MSCT)[17]for surveillance of HCC before starting DAA therapy. MSCT was also performed yearly after treatment. Clinical and laboratory data were collected before the initiation of DAA treatment and every six months thereafter, according to a standardized protocol. Hematological and biochemical tests were done, in addition to HCV RNA testing using o real-time PCR (Cobas Ampliprep, Cobas Taqman 48, Roche,Rotkreuz, Switzerland) according to the manufacturer’s instructions.
If HCC was suspected, other tests (AFP, triphasic MSCT, or MRI) were scheduled to confirm or rule out the diagnosis.
Follow-up duration was defined as the time between the end of treatment and the last follow-up or the date at which HCC was identified, whichever occurred first.
Fibrosis stage was assessed by transient elastography with a FibroScan 502 device (Echosens, Paris, France)before treatment and yearly after the end of treatment. For classification, the following liver stiffness cut-off values were used: F0/F1 ≤ 7 kPa, F2 > 7 kPa, F3 > 9.6 kPa, and F4 > 14.6 kPa[18]. Transient elastography was considered reliable when the following standard criteria had been met: (a) 10 successful measurements; (b)an interquartile range (IQR) lower than 30% of the median value; and (c) a success rate of > 60%. The liver stiffness score used was the median of all valid measurements[19]. For patients with high body mass index(BMI) (≥ 30 kg/m2), examination was performed by two experienced operators with the FibroScan XL probe[20]. Non-invasive scores (FIB-4, fibrosis-6 (FIB-6), and APRI[21-23]) were also calculated. FIB-6 is a machine learning algorithm that can be calculated using the following website: http://fib6.elriah.info.
Diagnosis of fibrosis and HCC
Diagnosis of F3 was made in patients in whom transient elastography values were > 9.6 and ≤ 14.6 kPa[18].
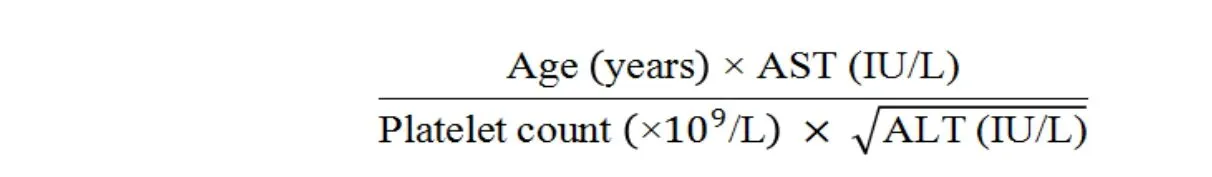
The FIB-4 score was calculated as[22]:
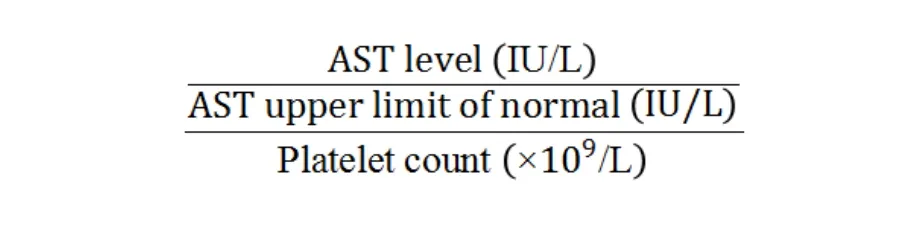
The APRI score was calculated as[21]:
The FIB-6 calculator classifies scores as optimal, rule out HCC, or rule in HCC.
MSCT or MRI was performed if any focal hepatic lesions were seen on abdominal ultrasound and/or the AFP value was > 20 ng/mL according to the European Association for the Study of the Liver (EASL) and the American Association for the Study of Live Diseases (AASLD) guidelines[24-26], Diagnosis of HCC was based on characteristic arterial enhancement and early washout in the delayed phase[27].
Statistical analyses
Statistical analyses were performed using Statistical Package for Social Sciences version 26 (IBM Corp,USA). Continuous variables were reported as median (IQR). Categorical variables were reported as frequency (%). Non-parametric analyses were performed with the Mann–Whitney test or Kruskal–Wallis for quantitative and Chi-square or Fisher’s exact test for qualitative comparisons. Comparison of liver stiffness and fibrosis indices pre- and post-treatment was done by Wilcoxon Signed Rank test. Times to events and cumulative incidences were calculated with the Kaplan–Meier method and Cox regression model and compared using the log-rank (Mantel–Cox) test. HCC incidence was calculated using Mid-P exact test and Miettinen’s modification. Significant predictors of fibrosis changes following HCV eradication were compared using multiple regression analysis.
Change in liver stiffness measurement (LSM) (delta LSM) was defined as the difference in LSM from baseline to follow-up and was categorized as less than -20% (improvement), -20% to +20% (stable), and more than +20% (impairment). This last criterion was used because values above and below 15% were considered to represent normal variability of the transient elastography procedure (as defined per the interquartile to median ratio of 30%).
P-values equal or less than 0.05 were considered statistically significant.
RESULTS
Patients’ characteristics
This study included 1823 patients with baseline LSM values of 9.6-14.6 kPa between January 2015 and August 2019. Among them, 306 (16.8%) were excluded [Figure 1]. Therefore, the final study population eligible for this study comprised 1517 patients [764 (50.4%) males and 753 (49.6%) females]. Their baseline characteristics are summarized in Table 1. The median follow-up duration was 28 months (IQR, 24-32 months) and reached up to 60 months. Baseline liver fibrosis measurements were all in the range of F3 with median LSM by FibroScan of 12.4 (11.1-14.2), median FIB-4 of 2.1 (1.4-3.3), median APRI of 0.6 (0.4-1.2),and median FIB-6 of 2.0 (1.7-2.4).
Changes after DAAs
Fibrosis improved significantly when assessed by LSM, FIB-4, APRI, and FIB-6 [Table 2]. However, when changes were categorized by delta LSM, 873 (57.5%) patients showed regression, 454 (29.9%) were stable,and 190 (12.5%) showed progression of fibrosis [Figure 2].
Table 3 shows the predictors of fibrosis changes following SVR in F3 patients. Multiple regression analysis indicated that the significant predictors of impairment are older age, female sex, higher baseline LSM,higher baseline total bilirubin, lower baseline albumin, lower baseline platelets count, presence of diabetes mellitus, and longer follow-up duration.

Table 1. Characteristics of studied patients before treatment
HCC incidence
In total, 33 (2.2%) patients developed HCC during the follow-up period (incidence, 0.915 per 100 personyear (py); 95% confidence interval (CI), 0.64-1.27; Table 4 and Figure 3). Incidence was highest in patients with progression of liver fibrosis (6.17 per 100 py), whereas in patients with stable liver fibrosis it was 1.09 per 100 py and in those with regression of liver fibrosis it was 0.75 per 100 py [Figure 4]. Incidence was higher among males than females (1.26 per 100 pyvs.0.56 per 100 py) [Figure 5]. Comparing the baseline characteristics of patients who developed HCC during follow-up with those who did not reveal significant differences in age (P< 0.001), sex (P= 0.025), total bilirubin (P= 0.011), and platelet count (P= 0.004).There were no significant differences in any fibrosis indicators at baseline (LSM, FIB-4, APRI, and FIB-6)between those who developed HCC and those who did not [Table 5].

Table 3. Predictors of fibrosis changes following HCV eradication in F3 patients
Data are presented as frequency (%) or median (IQR) by Kruskal Wallis test or Chi-square test. Obesity is defined as BMI ≥ 30 kg/m2;#Calculated probability; DM: diabetes mellitus; HTN: hypertension; AST: aspartate aminotransferase; ALT: alanine aminotransferase; HgB:hemoglobin; WBCs: white blood corpuscles; AFP: alpha fetoprotein; IQR: interquartile range.

Table 4. Incidence rates of HCC
DISCUSSION
This study included 1517 CHC patients with baseline F3 who achieved SVR after DAAs with median follow-up of 28 months (IQR, 24-32 months) that reached up to 60 months; among them, 873 (57.7%)showed regression of liver fibrosis, while 29.9% remain stationary at F3 with no change in liver fibrosis and 12.5% progressed to F4.
Shihaet al.studied 2372 HCV patients who had achieved SVR after treatment with DAAs, of whom 638(26.9%) had F3 fibrosis based on transient elastography[12]. After follow-up, 166 (26.0%) of 638 showed reversal of fibrosis to F0 or F1, 197 (30.0%) patients showed fibrosis regression to F2, 199 (31.2%) patients remained at F3, and 76 (11.9%) patients progressed to F4. In a similar study conducted by Shihaet al.involving 631 F3 patients, 26.5% and 31.5% of patients showed reversal of fibrosis and fibrosis regression,respectively, whereas 30.6% remained stable and 11.4% progressed to cirrhosis[27]. Although the methodsused in those studies to assess changes in fibrosis (defined by change in fibrosis stage) differ from our approach (LSM change), the proportions of patients who showed regression, stability, and progression are similar to our findings.

Table 5. Baseline characteristics of studied patients according to development of HCC
Our results show overall significant improvement of fibrosis with a decrease in LSM, FIB-4, APRI, and FIB-6, similar to results mentioned in earlier studies[27].
As regards HCC incidence in F3 patients, Shihaet al.reported that the incidence of HCC was 0.644 per 100 py (95%CI: 0.333-1.326) after a follow-up of 23.6 months[12]. Sánchez-Azofraet al.studied 506 F3 HCV patients with SVR after treatment with DAAs[13]. They found that the annual incidence of primary liver tumors in the cohort was 0.47%, which was lower than the 1.5% annual cut-off considered cost effective for HCC surveillance. Romanoet al.studied 3917 HCV patients with at least F3 stage fibrosis based on transient elastography [959 (24.5%) had F3] and who were receiving DAAs[10]. Patients with and without SVR were included, as were patients with HBV. Four (0.46%; 95%CI: 0.12-1.17) patients with F3 fibrosis developed HCC in the first year of follow-up. The incidence reduced to 0% in the second year. Piñeroet al.carried out a prospective study that included 233 patients with F3 fibrosis, based exclusively on transient elastography[11]. The median follow-up was 16 months, and patients with and without SVR were included.Only two cases of HCC were found in patients with F3 stage fibrosis (0.86%). Risk stratification for the incidence of HCC in F3 patients seems to be important since we found that incidence was highest among patients with progressive fibrotic changes.

Figure 1. Patient flowchart.
Type 2 diabetes mellitus (T2DM) is a well-established, independent risk factor for HCC[28]. It has been shown that the risk of developing HCC is 2.5-4-fold higher in patients with T2DM, independently of the presence of cirrhosis or of the etiology of the underlying liver disease[29-34]. The same was found in the current study of F3 CHC patients.
Our study is novel in that it assessed the clinical outcomes of DAA treatment in specific well-defined F3 patients who had achieved SVR. Other strengths of our study are its prospective design, large sample size,and a reasonably long follow-up after SVR. However, there are some limitations to this study. It reflects the findings of a single center, and most patients were predominantly genotype 4. The other limitation is the definition of F3. Even with the current strategy, some F4 patients could have been included in the cohort.
In conclusion, achieving SVR with DAA regimens was associated with significant improvements in liver and kidney functions and hematological parameters, together with a high rate of regression of fibrosis and decreased HCC incidence.

Figure 2. Change in liver fibrosis after DAAs. DAAs: Direct acting antivirals.
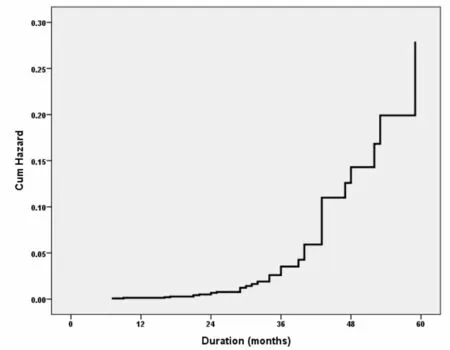
Figure 3. Cumulative hazard of HCC in patients with HCV after the end of DAA therapy, shown by Cox regression model. Cum:Cumulative; HCC: hepatocellular carcinoma; HCV: hepatitis C virus; DAA: direct acting antiviral.

Figure 4. Cumulative hazard of HCC in patients with HCV after the end of DAA therapy, shown by Cox regression model according to fibrotic changes after DAA. Cum: Cumulative; HCC: hepatocellular carcinoma; HCV: hepatitis C virus; DAA: direct acting antiviral.
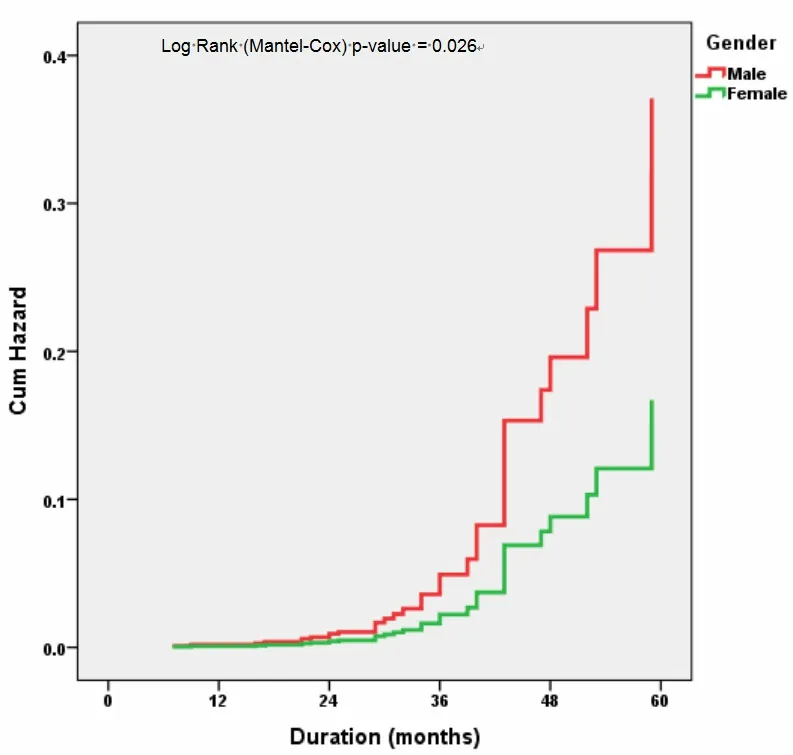
Figure 5. Cumulative hazard of HCC in patients with HCV after the end of DAA therapy, shown by Cox regression model according to gender. Cum: Cumulative; HCC: hepatocellular carcinoma; HCV: hepatitis C virus; DAA: direct acting antiviral.
DECLARATIONS
Authors’ contributions
Study concept and design: Shiha G
Analysis and interpretation of data: Shiha G, Soliman R, Mikhail NNH, Hassan AA Drafting of the manuscript: Shiha G, Soliman R, Mikhail NNH
Availability of data and materials
The data and materials are available upon request.
Financial support and sponsorship
None.
Conflicts of interest
All authors declared that there are no conflicts of interest.
Ethical approval and consent to participate
The study protocol was approved by the Research and Ethics Committee of ELRIAH (OHRP IRB #8819).The protocol and conduct of the study complied with the International Ethical Guidelines for Biomedical Research Involving Human Subjects and its amendments in 2008.
Consent for publication
All authors gave their consent for this article to be published.
Copyright
© The Author(s) 2022.