Distribution of transparent exopolymer particles and their response to phytoplankton community structure changes in the Amundsen Sea, Antarctica
2022-07-20XUESiyouHUJiFENGYubinLIDongZHANGHaifengZHAOJunHANZhengbingYUPeisongPANJianming
XUE Siyou, HU Ji, FENG Yubin, LI Dong, ZHANG Haifeng, ZHAO Jun, HAN Zhengbing, YU Peisong & PAN Jianming
Distribution of transparent exopolymer particles and their response to phytoplankton community structure changes in the Amundsen Sea, Antarctica
XUE Siyou, HU Ji*, FENG Yubin, LI Dong, ZHANG Haifeng, ZHAO Jun, HAN Zhengbing, YU Peisong & PAN Jianming
Key Laboratory of Marine Ecosystem Dynamics, Second Institute of Oceanography, Ministry of Natural Resources (MNR), Hangzhou 310000, China
To understand the response of transparent exopolymer particles (TEP) to the changes in phytoplankton communities caused by melting sea ice, we collected samples from the polynya and open ocean affected by the Antarctic circumpolar current in the Amundsen Sea. TEP, pigments, and other environmental factors were analyzed. The results showed that high TEP content was mainly found in the polynya, and was higher in the surface layer than in the deep layer. The main factor that affected TEP distribution was the phytoplankton community. In the polynya area, the phytoplankton were dominated by low-iron Haptophyta. In the Antarctic circumpolar current region affected by ice-melting water, the dominant species was diatom type II. Our results revealed that low-iron Haptophyta may be the main contributors to TEP content.
transparent exopolymer particles, Amundsen Sea, impact of sea ice, phytoplankton
1 Introduction
Transparent exopolymer particles (TEP) are acid polysaccharides that can be dyed by Alcian blue stain (Alldredge et al., 1993). TEP have attracted a lot of attention because of their characteristics, such as their low density, high viscosity, high carbon to nitrogen ratio, and negative charge, which have important effects on biogeochemistry and ecological processes in marine ecosystems (Passow, 2002).
Phytoplankton are considered the main source of TEP (Alldredge et al., 1993; Passow, 2002; van Oostende et al., 2012; Engel et al., 2015); among these, diatoms (Mari and Burd, 1998) and haptophytes, such as(Hong et al., 1997), seem to release larger amounts. However, there are also other factors that affect TEP concentrations, such as solar radiation (Ortega-Retuerta et al., 2009), temperature (Nicolaus et al., 1999; Claquin et al., 2008), CO2(Engel, 2002), nutrients (Mari et al., 2005), and viral infections (Nissimov et al., 2018). Therefore, the distribution of TEP differs in various areas.
The Southern Ocean (south of 50°S) is a key component of the global ocean circulation and the biogeochemical cycle of nutrients and carbon (Arrigo et al., 2008). It is also considered the largest region for anthropogenic CO2sequestration worldwide (Frölicher et al., 2015); it accounts for about 25% of the ocean’s absorption of atmospheric CO2(Takahashi et al., 2002), and its carbon output flux has reached 30%–50% of net primary production (Buesseler, 2001). Moreover, the direct contribution of sea ice to primary production is approximately 10%–28% in the Southern Ocean (Arrigo and Thomas, 2004).
Because global climate change affects the generation and dissipation of sea ice, the unique characteristics of phytoplankton communities in the Southern Ocean change. For example, as sea ice near the Antarctic Peninsula decreases, phytoplankton tend to become miniaturized (Murphy et al., 2012). The Amundsen Sea is an area of the Southern Ocean that has a very high level of productivity (Tortell et al., 2012). However, studies have shown that areas of sea ice in the Amundsen Sea have shrunk at a rate of 7% per decade (Cavalieri and Parkinson, 2008), which indicates that the Amundsen Sea has experienced the greatest changes in sea ice in the Southern Ocean (Konrad et al., 2018). This amplifies the phytoplankton community changes in the Amundsen Sea, especially in seasonal sea ice areas and polynyas.
TEP may account for an important fraction of particulate organic carbon (Engel, 2004; Zamanillo et al., 2019) and export flux (Passow, 2002; Wurl et al., 2011), and the contributions of different phytoplankton species to TEP can vary (Passow, 2002). Therefore, fluctuations in phytoplankton community succession caused by sea ice changes greatly affect TEP distribution, which in turn affects the biological carbon cycle (Harlay et al., 2009). Hong et al. (1997) found that the TEP concentrations measured during a-dominated bloom were higher than those produced by coastal diatom blooms in the Ross Sea. Additionally, Zamanillo et al. (2019) concluded that photobiological stress, sea ice melt, and turbulence contributed to how phytoplankton productivity drives TEP distribution across the Antarctic Peninsula area and Atlantic sector of the Southern Ocean. However, research on TEP distribution in the Amundsen Sea has been limited. Therefore, our study investigated TEP distribution in the Amundsen Sea and its response to changes in the phytoplankton community structure. These findings will help increase our understanding of the mechanism underlying biological carbon pumps in the Southern Ocean.
In this study, we describe the basic environmental parameters, composition of seven types of pigments, and distribution of TEP in the Amundsen Sea. We explored the factors controlling TEP distribution in the Amundsen Sea and the contribution of different phytoplankton communities to TEP under the influence of sea ice.
2 Materials and methods
2.1 Sample collection
During Amundsen Sea survey voyage, conducted by the 36th Chinese National Antarctic Research Expedition (CHINARE), 21 samples from seven stations were collected in the research area (66.5°S–74.5°S, 110°W–125°W) in 2020. Stations A11-00, A11-02, and A9-01 were located in the polynya area on the shelf, and the remainder were in the open ocean area affected by the Antarctic circumpolar current (ACC) (Figure 1). Samples were taken at each station from the surface layer, deep maximum chlorophyll layer (DCM), and 200-m layer (Table 1). The following parameters were measured: water temperature, salinity, dissolved oxygen (DO), nutrients, proportion of ice-melting water, pigments, and TEP.
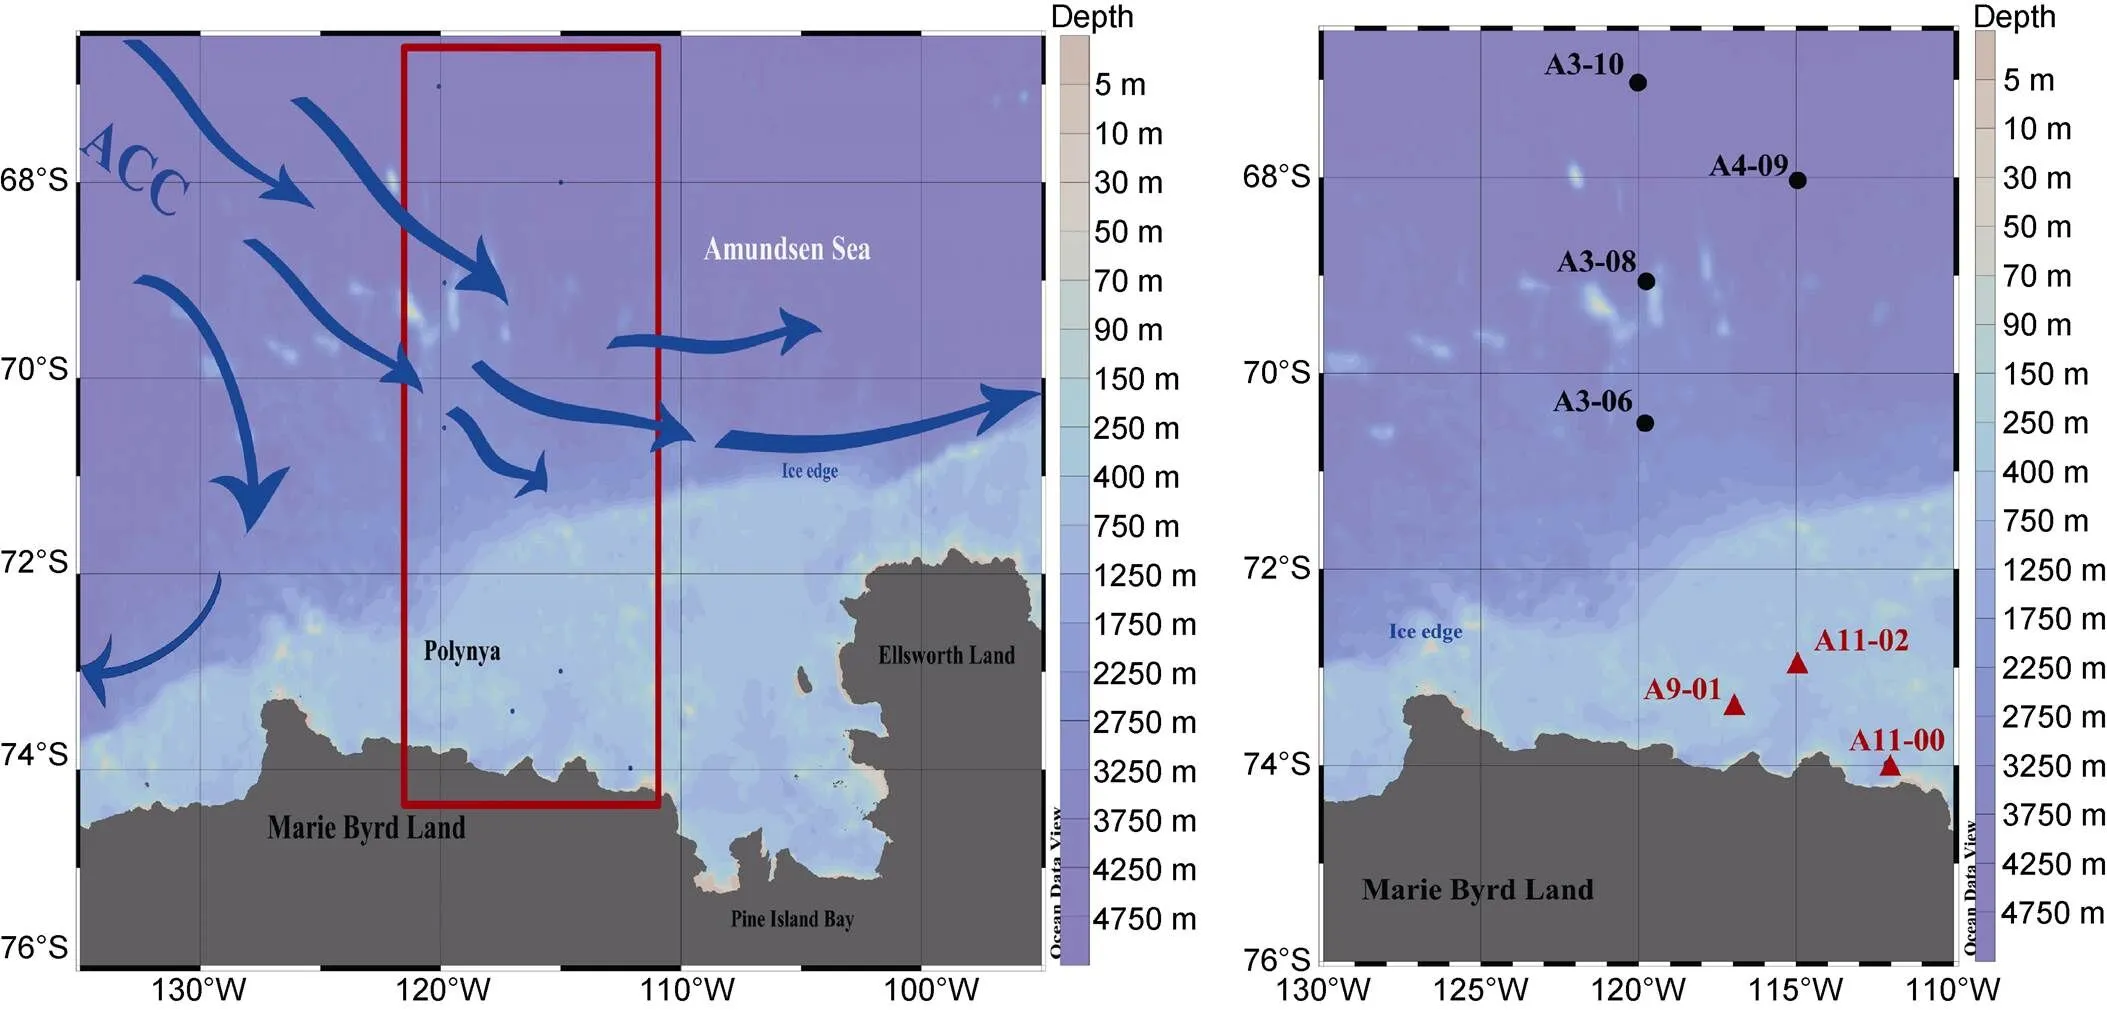
Figure 1 Sampling sites in the Amundsen Sea during the 36th CHINARE cruise in 2020 austral summer. Solid dots (●) indicate open ocean stations affected by ACC; Solid triangles (▲) indicates stations in the polynya.

Table 1 Details of each sampling station
2.2 Environmental properties and nutrient analysis
Basic environmental parameters, such as water temperature, salinity, and DO, were mainly obtained directly through the SBE 911plus CTD system on board the R/V. Silicate, phosphate, nitrite, nitrate, and ammonium values were determined as described in “Specifications for Oceanographic Surveys” (GB12763-2007). For nutrient analysis, 250-mL water samples were collected from each layer and poured into the filter cup of a suction filter device with a pre-installed 0.45-µm cellulose acetate filter membrane. The filtrate for the ammonium analysis was measured with a 7230G spectrophotometer, and the other four nutrients were analyzed with a continuous flow automatic nutrient analyzer (Skalar San++, The Netherlands). The standard solutions used in the analysis were all produced by the Standard Material Center of the Second Institute of Oceanography, Ministry of Natural Resources, China (GBW 08617-08645). The precision of ammonium, nitrate, phosphate, and silicate was 1.2%, 2.4%, 2.4%, and 3.0%, respectively.
2.3 TEP determination
TEP was analyzed as described by Passow and Alldredge (1995). A seawater sample of approximately 300–500 mL was collected and then filtered through a 25-mm diameter polycarbonate filter membrane with a pore size of 0.45 µm under vacuum conditions of less than 0.02 MPa. We then added 500 μL of Alcian blue (8 GX, pH = 2.5, Sigma) with a mass fraction of 0.02% for 2 s until the membrane surface was completely submerged. After washing off the excess dye solution with deionized water, each membrane sample was dissolved in 6 mL of 80% sulfuric acid and left for 2 h. During this time, the test tube was manually shaken 3– 5 times. Finally, the supernatant was transferred into a 1-cm cuvette, and the absorbance was measured at a wavelength of 787 nm. Triplicate samples were collected for each layer. After deducting the filter blank, the average value was recorded and final results achieved. The absorbance was calculated by the modified xanthan gum calibration method (Bittar et al., 2018).
2.4 Pigment determination and phytoplankton biomass analysis
We used a 0.7-μm GF/F membrane to quantitatively filter the water samples. The membrane samples were stored in a dark environment at −80°C. The pigment was extracted with 3 mL methanol at −20°C for 2 h, and then sonicated in an ice-water bath for 30 s. The extract was filtered through a syringe filter (4 mm, 0.45 μm PTFE, Whatman Inc., USA) to remove membrane debris. Nitrogen was blown across the extracted liquid to dryness; then, 300 μL of methanol and water mixture (V:V 19:1) was used to maintain a certain volume. All analyses were completed within 4 h. We followed Yao’s (2005) method to analyze the chromatogram using ultra-high performance liquid phase chromatography equipped with an Acquity UPLC®BEH C18 column (length, 50 cm; diameter, 1.7 μm; particle diameter, 2.1 mm), PDAeλ detector, and FLR detector (UPLC, Waters Corp., USA).
Qualitative and quantitative determination of pigment was based on comparison with the characteristic absorption wavelength of the pigment standard (Danish Institute of Water Environment, Denmark), peak area, and peak time. The precision and detection limits of this method are 0.26 μg·L−1and 2.2 μg·L−1, respectively. Additionally, CHEMTAX analysis was used to treat our data (Mackey et al., 1996; Alderkamp et al., 2012). Then, the phytoplankton biomass and information on community composition were determined for the study area.
2.5 Ice-melting water and sea surface wind speed
Observations of sea ice density mainly relied on the sea ice database of the University of Bremen (https://seaice. unibremen.de/databrowser/). We used Mendes et al.’s (2018) method to assess the extent of the effect of sea ice on the research area. The proportion of ice-melting water (%MW) was calculated using the salinity of the surface (surface) and bottom (deep, approximately 300 m) seawater. The calculation method was (Eqn 1):
%MW=[1−(surface−6)/(deep−6)]×100, (1)
Sea surface wind speed data were collected from a remote sensing system (http://www.remss.com/measurements/ccmp/) (Wentz et al., 2015).
3 Results
The average values of environmental parameters at a shallow depth of 200 m in the research area are summarized in Table 2.
3.1 Distributions of temperature, salinity, and DO
The range of water temperatures in the study area was from−1.79℃ to –1.72℃ with an average value of −0.60 ± 1.17℃ (=54). The salinity ranged from 32.68–34.62, with an average value of 33.96±0.33 (=54). The DO content ranged from 5.95–15.12 mg·L−1, with an average of 10.21±1.93 mg·L−1(=54). The distribution is shown in Figure 2. The temperature was relatively high on the surface layer, but was lower around 69°S–71°S. As the depth increased, the temperature gradually decreased. Then, at about 200 m, the temperature in the ACC area was higher than that in the polynya on the shelf.
The salinity stratification was clearly lower in the middle of the surface layer than in the surroundings; the salinity increased downward until 200 m, and the salinity in the ACC area was higher than that in the polynya area. However, the distribution of DO was mostly the opposite of that of salinity, except for the distribution of the DO in the surface layer, which was similar to that of salinity. The surveyed area was less affected by water masses as a whole and might be affected by the Circumpolar Deep Water intrusion only at 200 m, and the middle of the surface might be affected by the incomplete dissolution of floating ice.
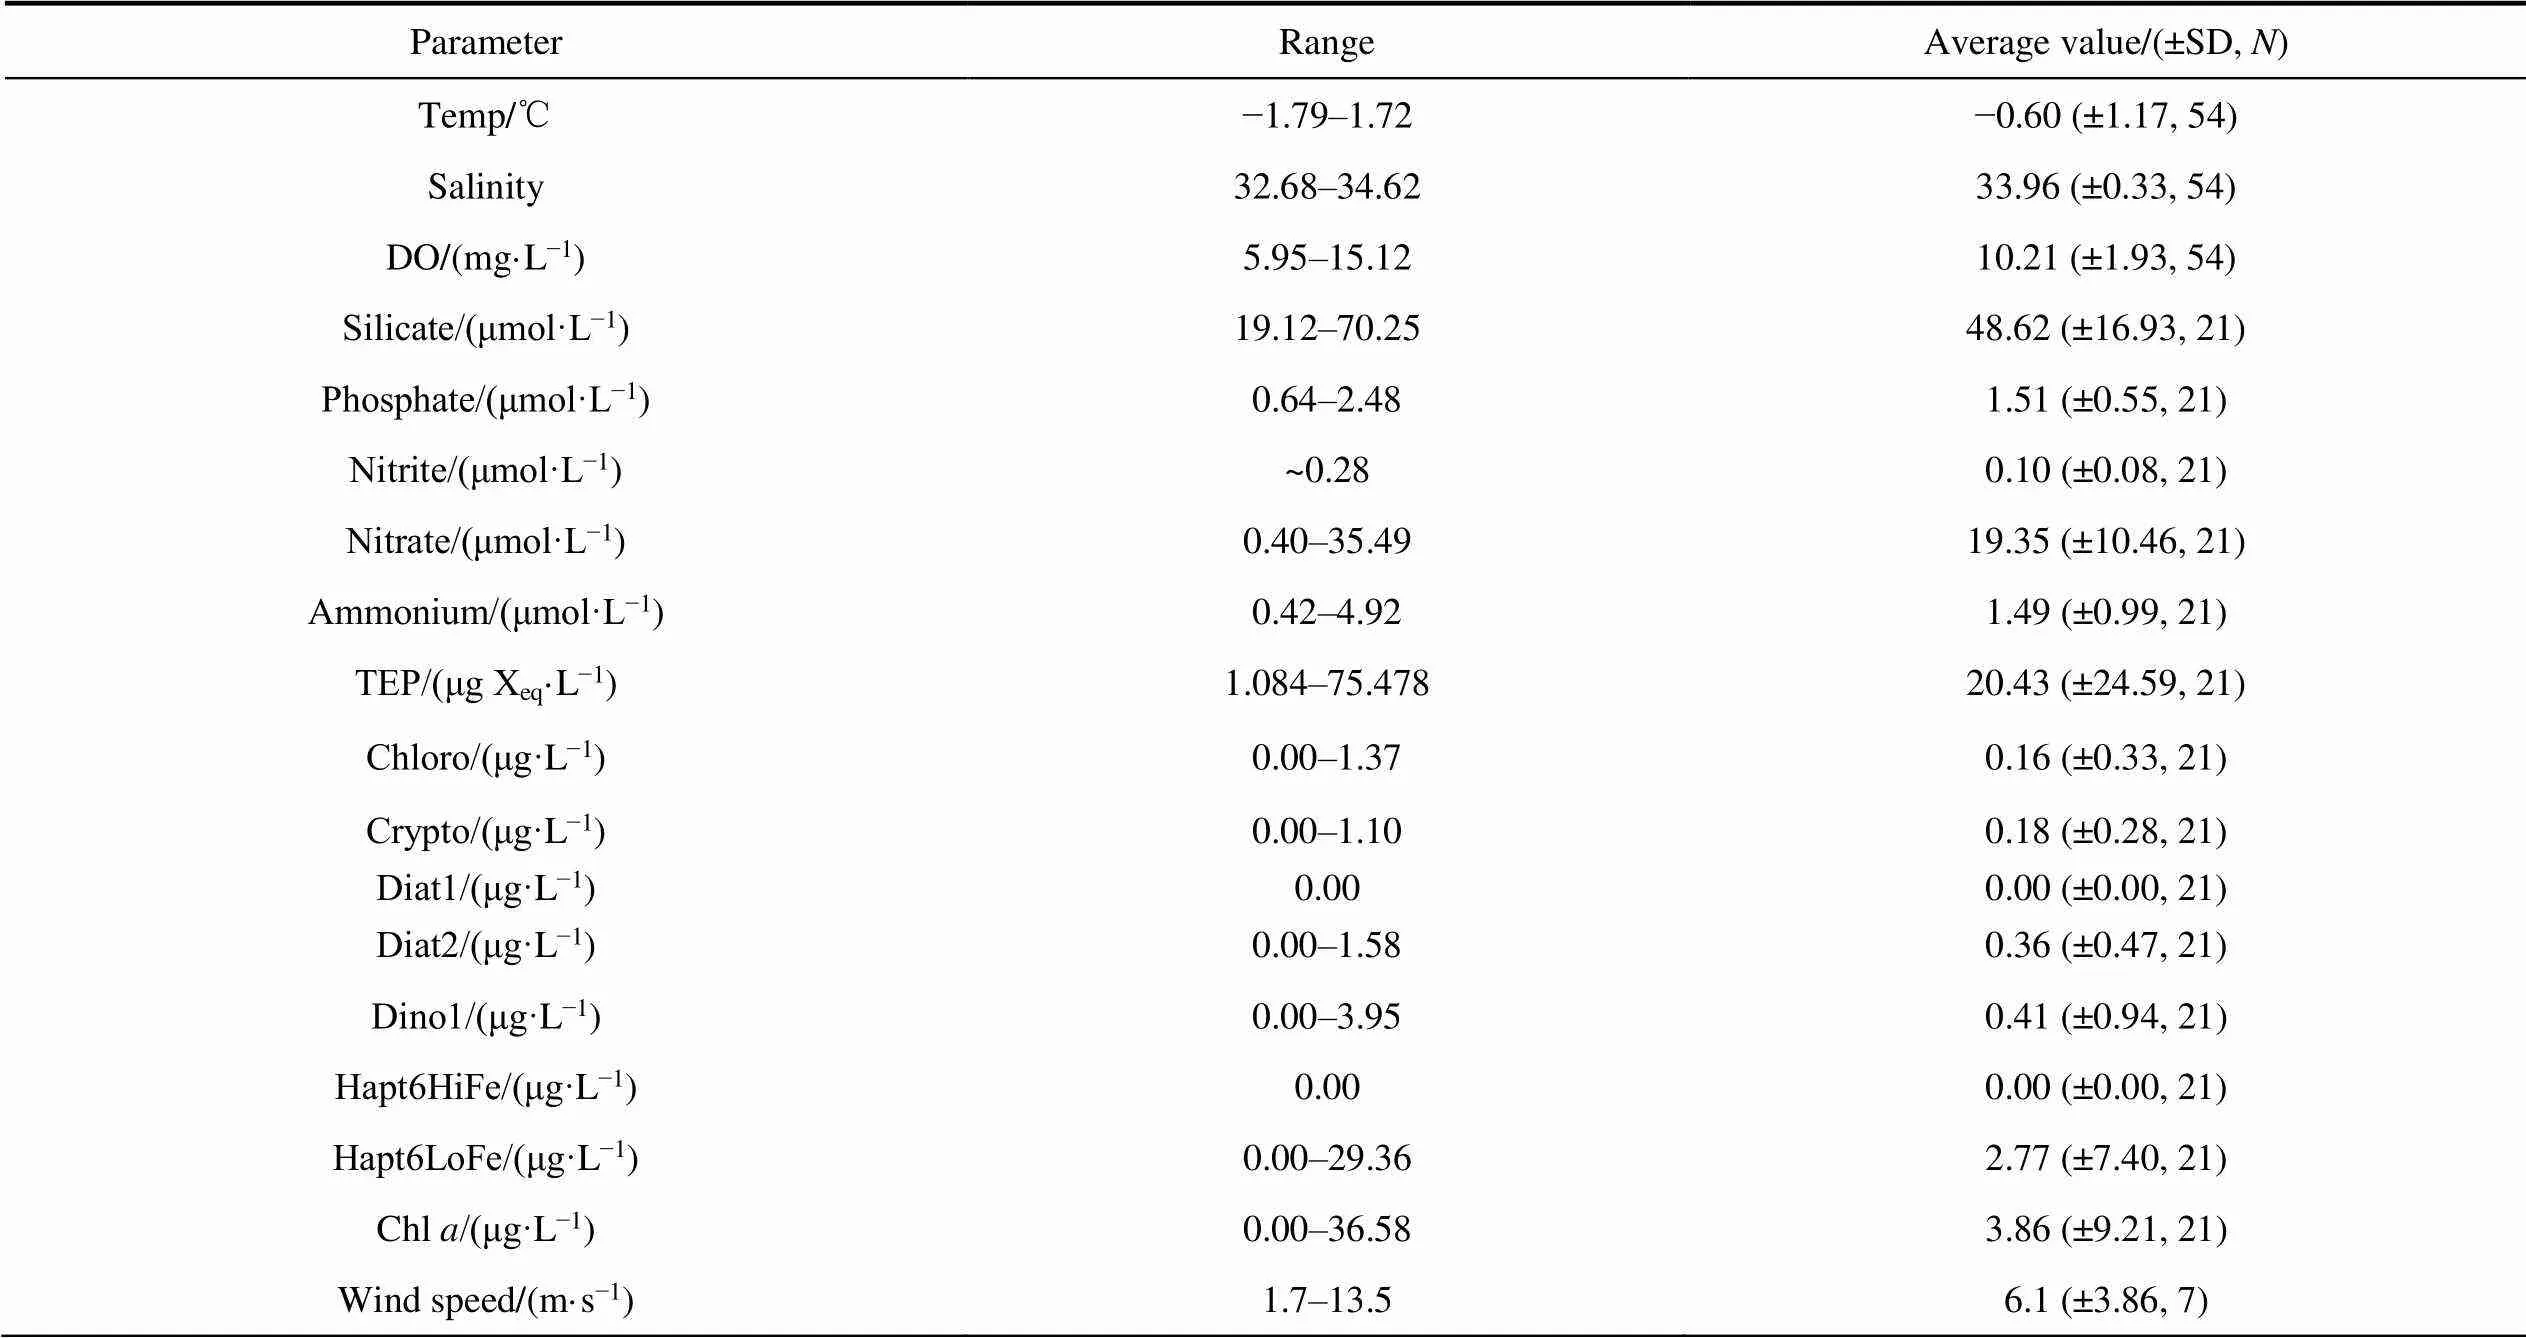
Table 2 Range and average values of environmental properties at all depths
Notes: SD, standard deviation;, number of samples.
3.2 Nutrient distribution
The distribution of nutrients in the surveyed area is shown in Figure 3. The silicate concentration in the research area ranged from 19.12–70.25 μmol·L−1, with an average value of 48.62±16.93 μmol·L−1(= 21); the high values were mainly found in the polynya area. The phosphate concentration range was 0.64–2.48 μmol·L−1, and the average value was 1.51±0.55 μmol·L−1(= 21); the phosphate concentration in the polynya area of the shelf area was lower than that in the ACC area. The nitrite concentration ranged from 0.00–0.28 μmol·L−1, with an average value of 0.10±0.08 μmol·L−1(= 21). Figure 3 shows that the nitrite concentration was higher in the upper layer than the deep layer and higher in the ACC area than in the polynya area. The nitrate concentration ranged from 0.40–35.49 μmol·L−1, with an average value of 19.35± 10.46 μmol·L−1(= 21). Figure 3 shows that the nitrate concentration in the ACC area was higher than that in the polynya. However, there the nitrate distribution tended to be lower in the upper layer than that in the deep layer. The ammonium concentration range was from 0.42– 4.92 μmol·L−1, with an average value of 1.49± 0.99 μmol·L−1(= 21). The ammonium concentration in the ACC area was low, and the maximum value was in the DCM layer of the polynya.
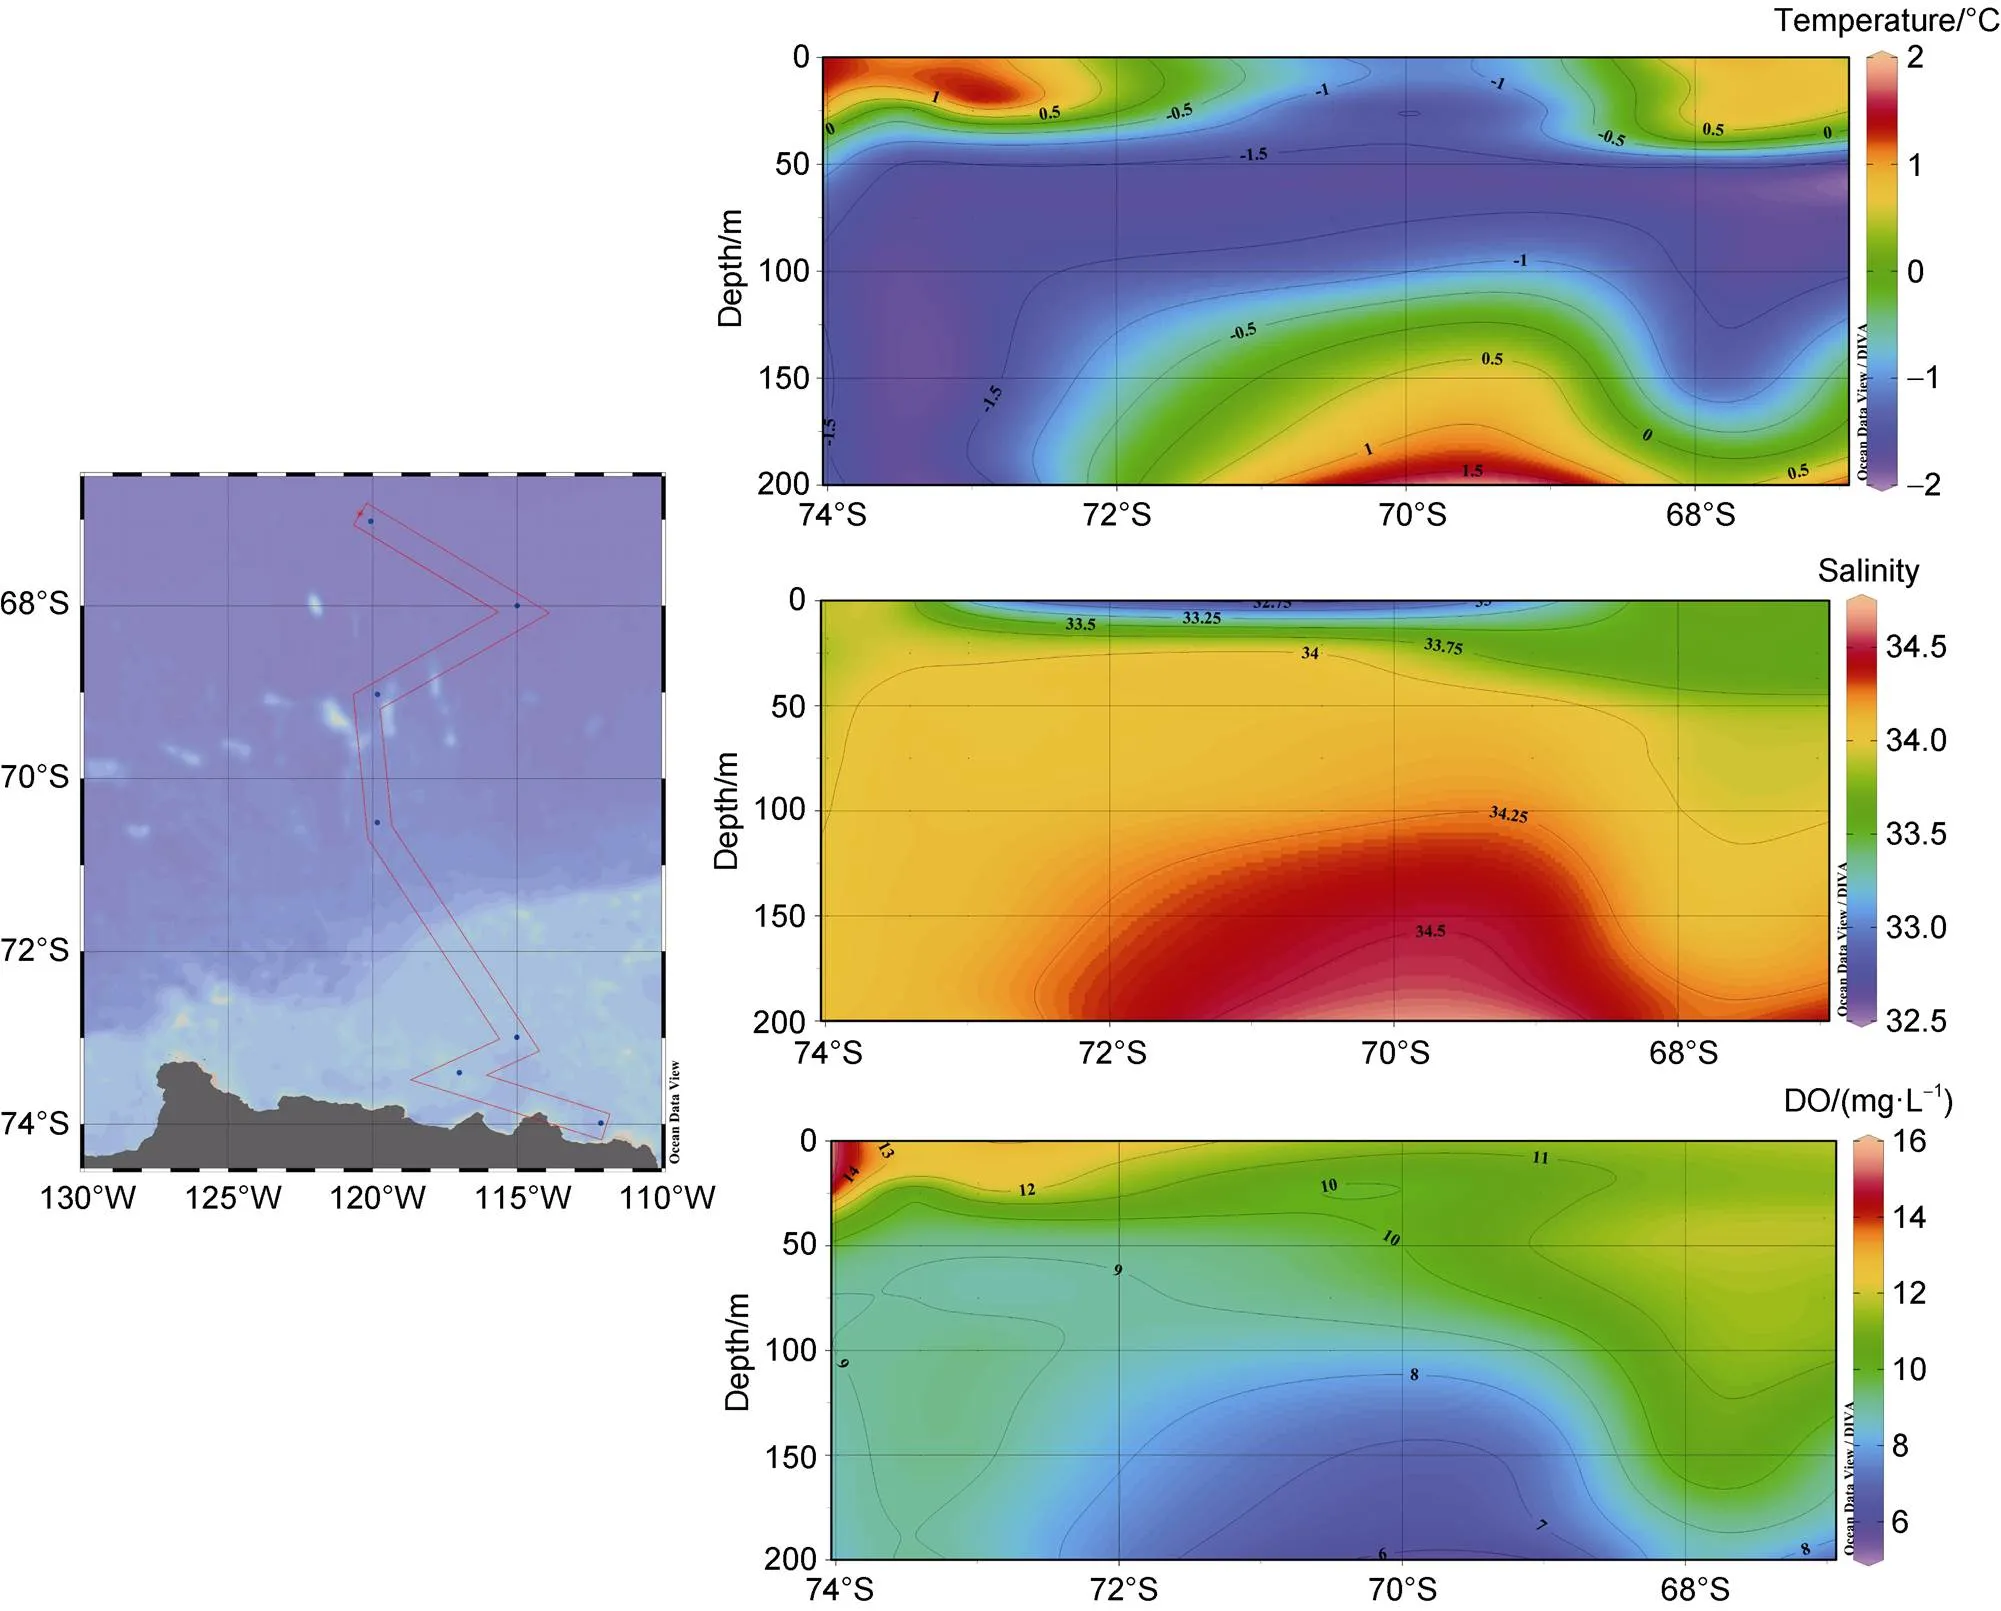
Figure 2 Section distribution of temperature, salinity, and DO in the Amundsen Sea during the 36th CHINARE cruise in 2020 austral summer.
Figure 3 Nutrient distribution in the Amundsen Sea during the 36th CHINARE cruise in 2020 austral summer.
3.3 Effect of ice-melting water
The percentage distribution of ice-melting water in the research area is shown in Table 3. It is generally believed that the %MW of the research area is less than 2.25 (Mendes et al., 2018), and the effect of melting ice is not as strong as in other areas. The results indicated that the ACC area was mostly affected by the melting water from sea ice, which reached its maximum near station A3-06. The polynya area was less affected by melting ice and was only moderately affected near the A11-02 station.
3.4 TEP distribution
The TEP content in the research area ranged from 1.08–75.48 , with an average value of 20.43±24.59 μg Xeq·L−1(=21) (Figure 4). The TEP concentration of the surface layer and the DCM layer decreased with increasing latitude in the ACC area, and that of the 200-m layer was very low. The high values were mainly found in the polynya on the shelf.
3.5 Phytoplankton pigments and community composition
Chlorophyll(Chl) content in the research area ranged from 0.00–36.58 μg·L−1, and the average value was 3.86 ± 29.21 μg·L−1(= 21) (Figure 5). Chlconcentration was relatively low in the ACC area. High Chlvalues were mainly found in the polynya, where the Chlconcentration was higher in the DCM layer than in the other layers.

Table 3 Proportion of ice-melting water in the Amundsen Sea during the 36th CHINARE cruise in 2020 austral summer

Figure 4 Distribution of TEP in the Amundsen Sea during the 36th CHINARE cruise in 2020 austral summer.
Figure 5 Chldistribution in the Amundsen Sea during the 36th CHINARE cruise in 2020 austral summer.
We also obtained information on phytoplankton biomass in the research area by analyzing pigment data (Figure 6 shows the phytoplankton community structure). In the ACC area, diatom group II was the main phytoplankton found and accounted for 49% of the phytoplankton biomass, followed by low-iron Haptophyta, Cryptophyta, Dinoflagellata, and Prochlorophyta (17%, 17%, 14% and 3%, respectively). In the polynya, the low-iron Haptophyta was the main phytoplankton phylum, accounting for 75% of the phytoplankton biomass. Generally, the dominant species in the Amundsen Sea were members of the low-iron Haptophyta, accounting for 72% of the entire phytoplankton biomass, followed by Dinoflagellata and diatom group II (10% and 9%, respectively). Cryptophyta and Prochlorophyta only accounted for 5% and 4% of the phytoplankton biomass, respectively.
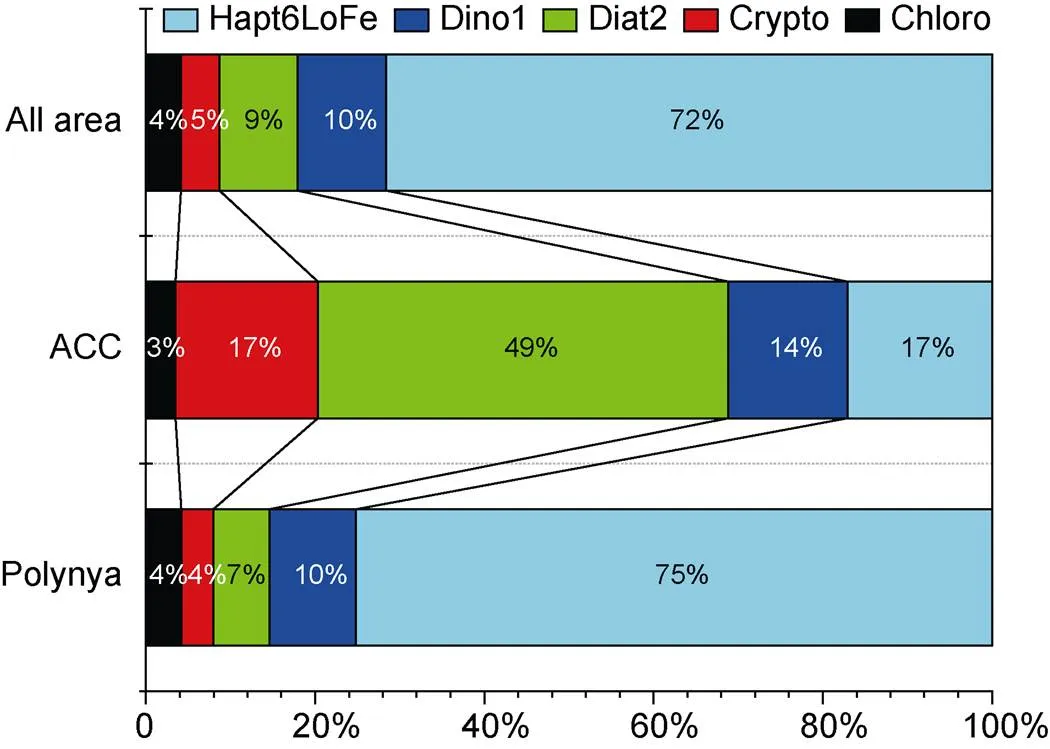
Figure 6 Phytoplankton community composition in the Amundsen Sea during the 36th CHINARE cruise in 2020 austral summer. Diat2, diatom type II; Hapt6LoFe, low-iron type Haptophyta; Dino1, Dinoflagellata; Crypto, Cryptophyta; and Chloro, Prochlorophyta; Amounts of Diat1 and Hapt6hiFe were extremely low or undetected in the results.
3.6 Correlations between TEP and other environmental factors
To discover the main driver of TEP distribution in the research area, we carried out correlation analysis and principal component analysis (PCA) of TEP and other environmental factors (Table 4 and Figure 7). The correlation results showed that TEP was positively correlated with DO, ammonium, phytoplankton species (except Diat1 and Hapt6HiFe), and Chl, but negatively correlated with phosphate, nitrate, and percentage of ice-melting water. The PCA results showed that TEP, water temperature, salinity, ammonium, silicate, DO, Chl, and various phytoplankton species had a large positive load on component 1. Phosphate, nitrite, nitrate, and %MW had a large negative loading on component 1. Wind speed had a large positive loading on component 2. The contribution of component 1 to the overall results was 65.0%, and that of component 2 was 17.2%.
4 Discussion
4.1 Phytoplankton community composition in the Amundsen Sea
Our research revealed that the Amundsen Sea had low Chlconcentrations and low productivity (Table 2 and Figure 5), which is consistent with the findings of other studies (Arrigo and van Dijken, 2003; Arrigo et al., 2008). Chlconcentration was relatively low in the ACC area compared with the rest of the Amundsen Sea, but the differences in spatial distribution were not obvious. According to the results shown in Table 3, the ACC area was greatly affected by the melting water from sea ice, which indicates that the sea ice had just begun to melt because of seasonal changes. Therefore, the phytoplankton had not started to flourish and the Chlconcentration was low.
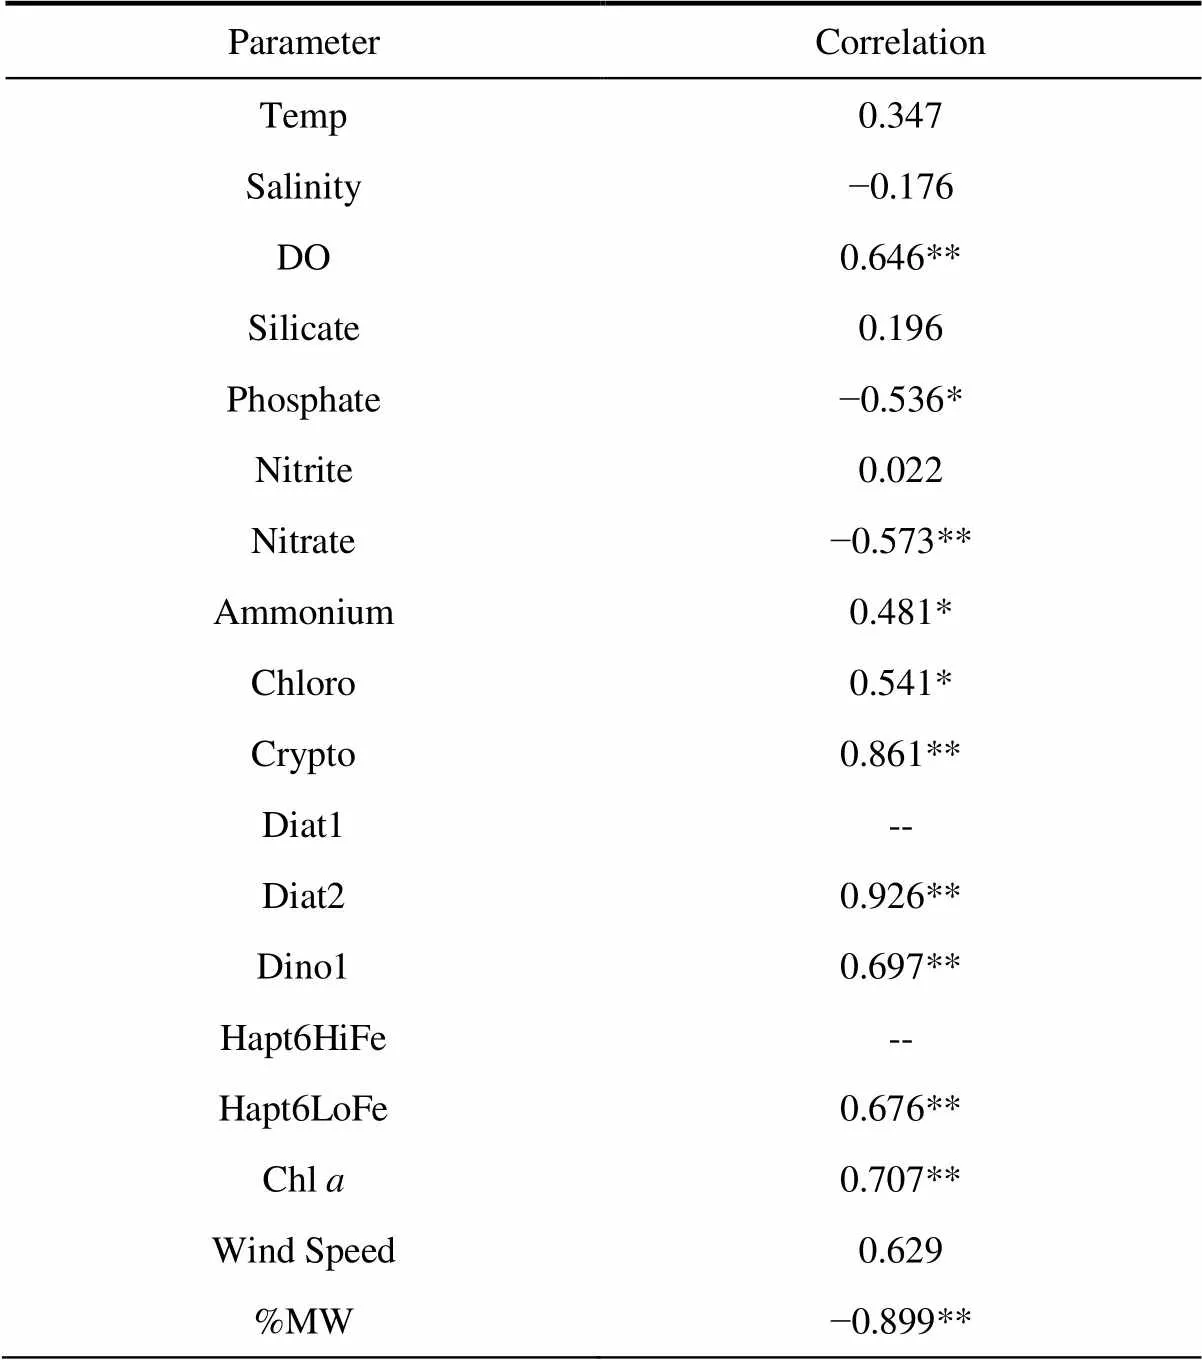
Table 4 Correlation between TEP and environmental factors
Notes: **,< 0.01; *,< 0.05; and --, no correlation
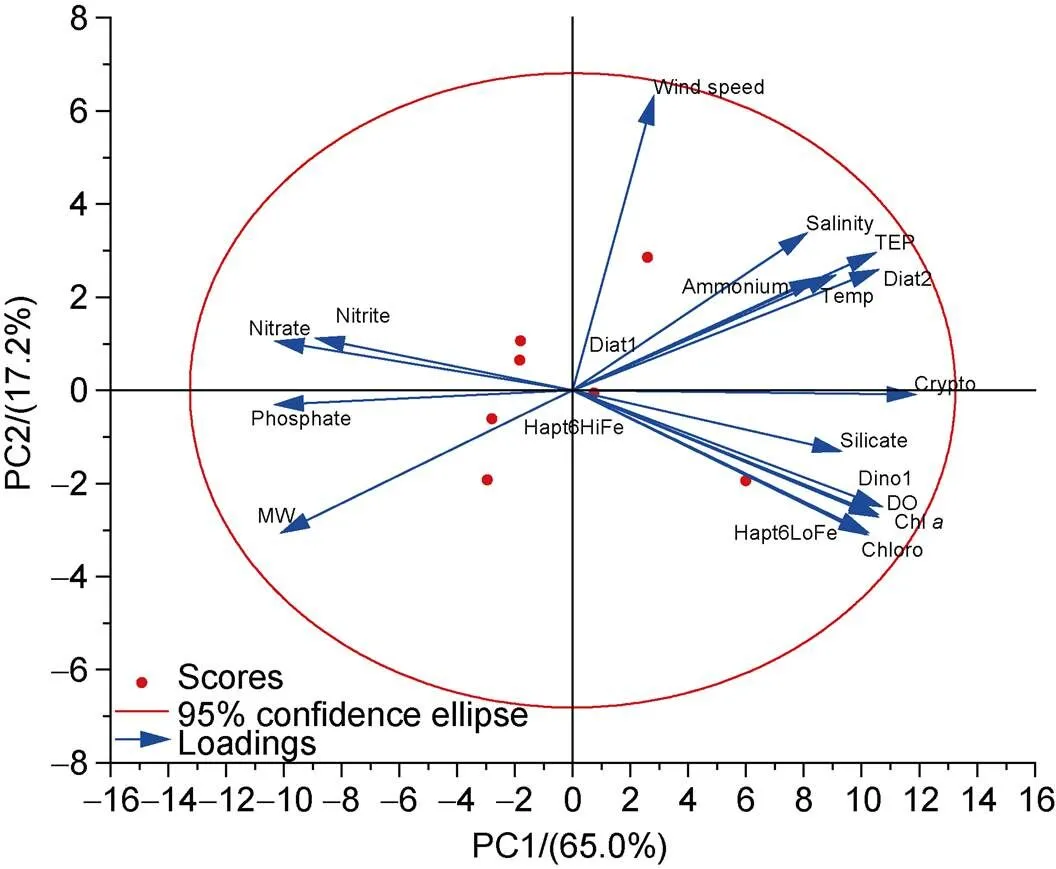
Figure 7 PCA of TEP and other environmental factors.
The nutrient distribution results (Figure 3) show that the phosphate, nitrite, and nitrate concentrations in the polynya were lower than those in the ACC area. These findings indicated that phytoplankton growth consumed a lot of nutrients in the polynya, which resulted in a higher Chlcontent in the polynya than that in the ACC area. Compared with the %MW in the ACC area, the polynya area was less affected by melting ice. The polynya might be affected by the Circumpolar Deep Water intrusion, which provided heat to the area and lead to earlier melting of sea ice in the area; this resulted in obvious flourishing of phytoplankton (Arrigo et al., 1999). Consequently, this led to a higher Chlcontent in the polynya than in adjacent areas.
Furthermore, the phytoplankton composition differed between the ACC area and polynya (Figure 6). This indicates that the phytoplankton community changed under the effect of melting sea ice (Turner and Owens, 1995; Jin et al., 2012). The dominant phytoplankton community in the ACC area was diatom type II. Studies showed that the ice algae brought by the melting of sea ice were mainly diatoms (Arrigo and Thomas, 2004; Kim et al., 2015). Therefore, diatom type II grew vigorously in the ACC area where the sea ice melted later. Diatoms consumed silicate and other nutrients during the growth process; consequently, the silicate distribution shown in Figure 3 further confirmed that diatoms represented the majority of the phytoplankton community in the ACC area.
Alternatively, the polynya was dominated by low-iron Haptophyta, and the prosperity of low-iron Haptophyta was often related to factors such as sea ice changes and iron supply (Ducklow et al., 2015). The presence of this type of algae indicates low dissolved iron content of the area (Wright et al., 2010) and therefore revealed that the polynya was a low-iron content area.
4.2 TEP response to changes in the phytoplankton community
The PCA results (Figure 7) show that the TEP, water temperature, salinity, DO, silicate, ammonium, and various phytoplankton species in the research area imposed high positive loadings on component 1. Nitrate, %MW, nitrite, and phosphate had negative loadings on component 1. Seasonal changes caused sea ice to melt in the study area and phytoplankton to grow in large quantities; the phytoplankton consumed nutrients, promoted the formation of DO, and released a large amount of TEP. Therefore, component 1 can be characterized as the effect of the phytoplankton community under the influence of melting ice. As a physical factor, sea breeze had a positive loading on component 2, which indicated that the sea area might be greatly affected by wind stress. In conjunction with the correlation results (Table 4), these results indicate significant positive correlations between TEP, phytoplankton species, and Chl, but negative correlations
with phosphate, nitrate, and %MW. It appears that the less directly affected by %MW, the more vigorous phytoplankton growth and the more TEP released.
Our results reveal that the TEP distribution in the Amundsen Sea is mainly affected by phytoplankton, which is also mostly consistent with research in other areas of the Southern Ocean (Hong et al., 1997; Ramaiah and Furuya, 2002). However, a difference was that the delayed ice-melting in the ACC area resulted in a lower phytoplankton biomass, and therefore reduced the amount of TEP released from algae. In the polynya, phytoplankton grew vigorously because of early ice-melting and therefore released a large amount of TEP.
In fact, the phytoplankton biomass was mainly concentrated in the DCM layer in the polynya (Figure 5), whereas high TEP values were concentrated in the surface layer of the polynya (Figure 4). This was not completely consistent with the phytoplankton content and TEP in polynya. We speculate that this discrepancy may be determined by the TEP characteristics. For example, TEP density is lower than that of seawater (Mari et al., 2017). Therefore, TEP will float to the surface and accumulate on the surface until the aggregate density is greater than that of seawater before sinking. This phenomenon has been similarly described in previous studies (Ryan et al., 2010; Wurl et al., 2016), but the dynamic process is still unclear and needs further study.
In addition, TEP production is a function of cell type and physiological state (Kiørboe and Hansen, 1993; Passow and Alldredge, 1994). The currently accepted empirical relationship is: TEP=α (Chl)β, where larger β values indicate more TEP released by phytoplankton (Passow, 2002). This value fluctuates greatly. In batch culture, β is often less than 1, but in the open ocean, β is close to or greater than 1; for example, β=3.63 in the Ross Sea of Antarctica (Hong et al., 1997). To produce a preliminary understanding of the contribution of the phytoplankton population to the TEP in the Amundsen Sea, we simplified the relationship and assumed β=1 so that the phytoplankton content and TEP content could be used for fitting (Figure 8) to roughly determine the contribution of different phytoplankton communities to TEP.
The results showed that diatom type II had a good linear relationship with TEP (2=0.8567), which indicated that diatoms had the highest contribution to TEP. The linear relationship between low-iron Haptophyta and TEP was low (2=0.4570). The biomass of diatoms was much smaller than that of low-iron Haptophyta (Figure 6). Therefore, it is worth noting that the TEP concentration may depend on the composition, concentration, and physiological state of phytoplankton rather than the standing stock (Passow and Alldredge, 1995). Moreover, although the contribution of low-iron Haptophyta to TEP was not as high as that of diatom type II, a large amount of low-iron Haptophyta still greatly contributed to the TEP content of the area.
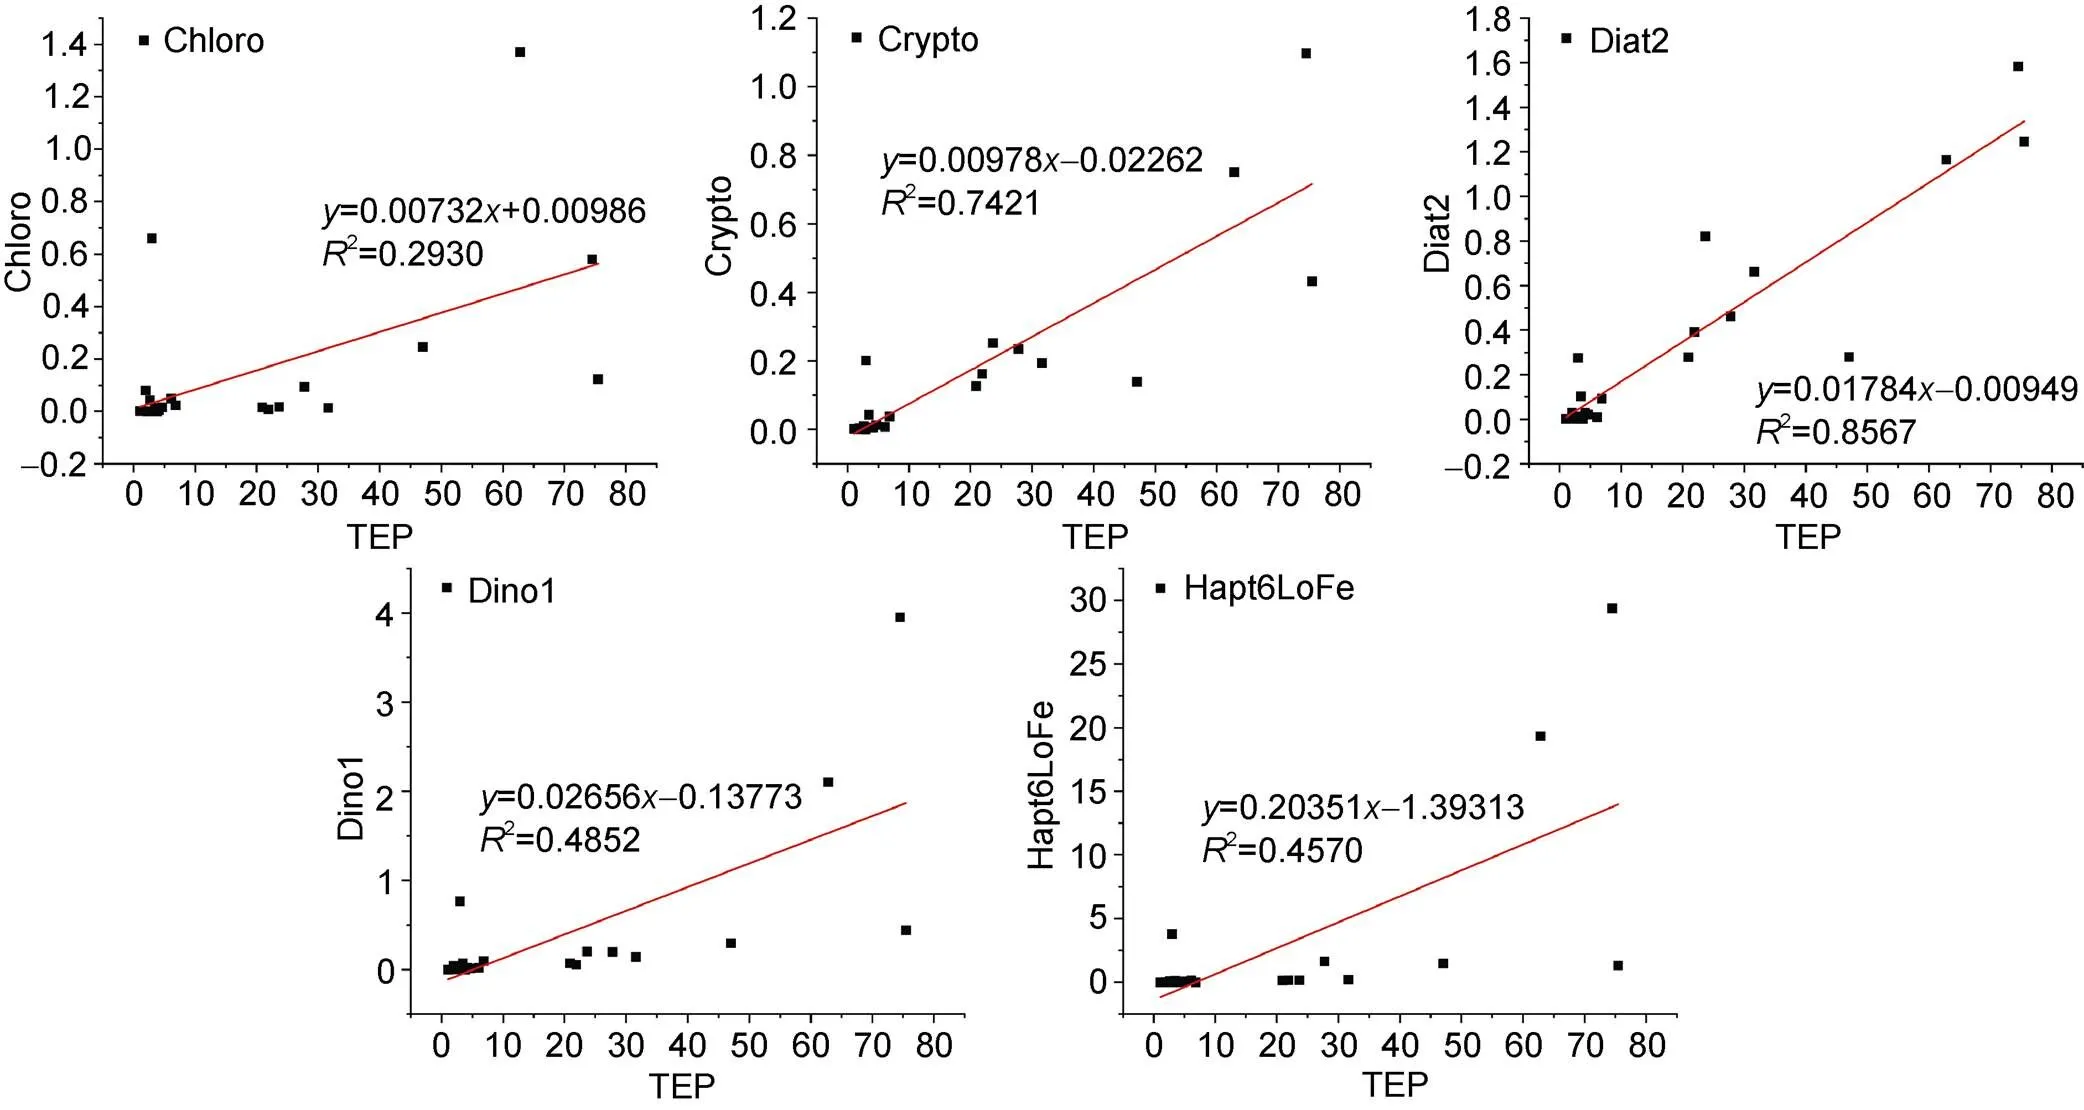
Figure 8 Linear relationships between different phytoplankton species and TEP. Because the amounts of Diat1 and Hapt6hiFe were extremely low or undetected in the results, these groups are not displayed.
5 Conclusion
The TEP distribution showed regional differences in the Amundsen Sea. Its concentration was higher in the polynya than in the ACC area, and higher in the upper layer than in the deep layer. The TEP spatial distribution was mainly affected by the phytoplankton community structure, which was strongly influenced by ice-melting water. The low-iron Haptophyta was the dominant phytoplankton phylum in the Amundsen Sea, but the contribution of diatom type II to released TEP seems to be stronger. However, from the perspective of biomass, the TEP of the study area may be mainly released from low-iron Haptophyta.
Acknowledgments The author thanks the Polar Research Institute of China and the crew of R/Vfor their assistance in sample collection and on-board analysis. This research was financially supported by National Polar Special Program “Impact and Response of Antarctic Seas to Climate Change” (Grant nos. IRASCC 02-02-01, 02-02-03, 02-02-04, and 02-02-05). We thank two anonymous reviewers, and Guest Editor Dr. Jianfeng He for their constructive comments that have further improved the manuscript.
Alderkamp A C, Mills M M, van Dijken G L, et al. 2012. Iron from melting glaciers fuels phytoplankton blooms in the Amundsen Sea (Southern Ocean): phytoplankton characteristics and productivity. Deep Sea Res Part II Top Stud Oceanogr, 71-76: 32-48, doi:10.1016/j. dsr2.2012.03.005.
Alldredge A L, Passow U, Logan B E. 1993. The abundance and significance of a class of large, transparent organic particles in the ocean. Deep Sea Res Part I Oceanogr Res Pap, 40(6): 1131-1140, doi:10.1016/0967-0637(93)90129-Q.
Arrigo K R, Robinson D H, Worthen D L, et al. 1999. Phytoplankton community structure and the drawdown of nutrients and CO2in the Southern Ocean. Science, 283(5400): 365-367, doi:10.1126/science. 283.5400.365.
Arrigo K R, Thomas D N. 2004. Large scale importance of sea ice biology in the Southern Ocean. Antart Sci, 16(4): 471-486, doi:10.1017/s 0954102004002263.
Arrigo K R, van Dijken G L. 2003. Phytoplankton dynamics within 37 Antarctic coastal polynya systems. J Geophys Res, 108(C8): 3271, doi:10.1029/2002jc001739.
Arrigo K R, van Dijken G L, Bushinsky S. 2008. Primary production in the Southern Ocean, 1997–2006. J Geophys Res, 113(C8): C08004, doi:10.1029/2007jc004551.
Bittar T B, Passow U, Hamaraty L, et al. 2018. An updated method for the calibration of transparent exopolymer particle measurements. Limnol Oceanogr Methods, 16(10): 621-628, doi:10.1002/lom3.10268.
Buesseler K O. 2001. Ocean biogeochemistry and the global carbon cycle: an introduction to the U.S. Joint Global Ocean Flux Study. Oceanography, 14(4): 5, doi:10.5670/oceanog.2001.01.
Cavalieri D J, Parkinson C L. 2008. Antarctic sea ice variability and trends, 1979–2006. J Geophys Res, 113(C7): C07004, doi:10.1029/2007jc 004564.
Claquin P, Probert I, Lefebvre S, et al. 2008. Effects of temperature on photosynthetic parameters and TEP production in eight species of marine microalgae. Aquat Microb Ecol, 51(1): 1-11, doi:10.3354/ame 01187.
Ducklow H W, Wilson S E, Post A F, et al. 2015. Particle flux on the continental shelf in the Amundsen Sea Polynya and Western Antarctic Peninsula. Elem Sci Anthropocene, 3: 000046, doi:10.12952/journal. elementa.000046.
Engel A. 2002. Direct relationship between CO2uptake and transparent exopolymer particles production in natural phytoplankton. J Plankton Res, 24(1): 49-53, doi:10.1093/plankt/24.1.49.
Engel A. 2004. Distribution of transparent exopolymer particles (TEP) in the northeast Atlantic Ocean and their potential significance for aggregation processes. Deep Sea Res Part I Oceanogr Res Pap, 51(1): 83-92, doi:10.1016/j.dsr.2003.09.001.
Engel A, Borchard C, Loginova A, et al. 2015. Effects of varied nitrate and phosphate supply on polysaccharidic and proteinaceous gel particle production during tropical phytoplankton bloom experiments. Biogeosciences, 12(19): 5647-5665, doi:10.5194/bg-12-5647-2015.
Frölicher T L, Sarmiento J L, Paynter D J, et al. 2015. Dominance of the Southern Ocean in anthropogenic carbon and heat uptake in CMIP5 models. J Clim, 28(2): 862-886, doi:10.1175/jcli-d-14-00117.1.
Harlay J, De Bodt C, Engel A, et al. 2009. Abundance and size distribution of transparent exopolymer particles (TEP) in a coccolithophorid bloom in the northern Bay of Biscay. Deep Sea Res Part I Oceanogr Res Pap, 56(8): 1251-1265, doi:10.1016/j.dsr.2009.01.014.
Hong Y, Smith Jr W O, White A M. 1997. Studies on transparent exopolymer particles (TEP) produced in the Ross Sea (Antarctica) and by(Prymnesiophyceae). J Phycol, 33(3): 368-376, doi:10.1111/j.0022-3646.1997.00368.x.
Jin S Y, Pan J M, Han Z B. 2012. Spatial and temporal variability of chlorophyllduring the austral summer in Prydz Bay, Antarctic. Chin J Polar Res, 24: 361-371, doi: 10.3724/SP.J.1084.2012.00361.
Kim M, Hwang J, Kim H J, et al. 2015. Sinking particle flux in the sea ice zone of the Amundsen Shelf, Antarctica. Deep Sea Res Part I Oceanogr Res Pap, 101: 110-117, doi:10.1016/j.dsr.2015.04.002.
Kiørboe T, Hansen J L S. 1993. Phytoplankton aggregate formation: observations of patterns and mechanisms of cell sticking and the significance of exopolymeric material. J Plankton Res, 15(9): 993-1018, doi:10.1093/plankt/15.9.993.
Konrad H, Shepherd A, Gilbert L, et al. 2018. Net retreat of Antarctic glacier grounding lines. Nat Geosci, 11(4): 258-262, doi:10.1038/s 41561-018-0082-z.
Mackey M D, Mackey D J, Higgins H W, et al. 1996. CHEMTAX – a program for estimating class abundances from chemical markers: application to HPLC measurements of phytoplankton. Mar Ecol Prog Ser, 144: 265-283, doi:10.3354/meps144265.
Mari X, Burd A. 1998. Seasonal size spectra of transparent exopolymeric particles (TEP) in a coastal sea and comparison with those predicted using coagulation theory. Mar Ecol Prog Ser, 163: 63-76, doi:10.3354/meps163063.
Mari X, Passow U, Migon C, et al. 2017. Transparent exopolymer particles: effects on carbon cycling in the ocean. Prog Oceanogr, 151: 13-37, doi:10.1016/j.pocean.2016.11.002.
Mari X, Rassoulzadegan F, Brussaard C P D, et al. 2005. Dynamics of transparent exopolymeric particles (TEP) production byunder N- or P-limitation: a controlling factor of the retention/export balance. Harmful Algae, 4(5): 895-914, doi:10.1016/j. hal.2004.12.014.
Mendes C R B, Tavano V M, Kerr R, et al. 2018. Impact of sea ice on the structure of phytoplankton communities in the northern Antarctic Peninsula. Deep Sea Res Part II Top Stud Oceanogr, 149: 111-123, doi:10.1016/j.dsr2.2017.12.003.
Murphy E J, Watkins J L, Trathan P N, et al. 2012. Spatial and temporal operation of the Scotia Sea ecosystem. John Wiley & Sons, Ltd, doi:10.1002/9781444347241.ch6.
Nicolaus B, Panico A, Lama L, et al. 1999. Chemical composition and production of exopolysaccharides from representative members of heterocystous and non-heterocystous cyanobacteria. Phytochemistry, 52(4): 639-647, doi:10.1016/S0031-9422(99)00202-2.
Nissimov J I, Vandzura R, Johns C T, et al. 2018. Dynamics of transparent exopolymer particle production and aggregation during viral infection of the coccolithophore,. Environ Microbiol, 20(8): 2880-2897, doi:10.1111/1462-2920.14261.
Ortega-Retuerta E, Passow U, Duarte C M, et al. 2009. Effects of ultravioletradiation on (not so) transparent exopolymer particles. Biogeosciences, 6(12): 3071-3080, doi:10.5194/bg-6-3071-2009.
Passow U. 2002. Transparent exopolymer particles (TEP) in aquatic environments. Prog Oceanogr, 55(3-4): 287-333, doi:10.1016/S0079- 6611(02)00138-6.
Passow U, Alldredge A L. 1994. Distribution, size and bacterial colonization of transparent exopolymer particles (TEP) in the ocean. Mar Ecol Prog Ser, 113: 185-198, doi:10.3354/meps113185.
Passow U, Alldredge A L. 1995. Aggregation of a diatom bloom in a mesocosm: the role of transparent exopolymer particles (TEP). Deep Sea Res Part II Top Stud Oceanogr, 42(1): 99-109, doi:10.1016/0967- 0645(95)00006-C.
Ramaiah N, Furuya K. 2002. Seasonal variations in phytoplankton composition and transparent exopolymer particles in a eutrophicated coastal environment. Aquat Microb Ecol, 30: 69-82, doi:10.3354/ ame030069.
Ryan J P, Fischer A M, Kudela R M, et al. 2010. Recurrent frontal slicks of a coastal ocean upwelling shadow. J Geophys Res, 115(C12): C12070, doi:10.1029/2010jc006398.
Takahashi T, Sutherland S C, Sweeney C, et al. 2002. Global sea-air CO2flux based on climatological surface oceanCO2, and seasonal biological and temperature effects. Deep Sea Res Part II Top Stud Oceanogr, 49(9-10): 1601-1622, doi:10.1016/S0967-0645(02)00003-6.
Tortell P D, Long M C, Payne C D, et al. 2012. Spatial distribution ofCO2, ΔO2/Ar and dimethylsulfide (DMS) in polynya waters and the sea ice zone of the Amundsen Sea, Antarctica. Deep Sea Res Part II Top Stud Oceanogr, 71-76: 77-93, doi:10.1016/j.dsr2.2012.03.010.
Turner D R, Owens N J P. 1995. A biogeochemical study in the Bellingshausen Sea: overview of the STERNA 1992 expedition. Deep Sea Res Part II Top Stud Oceanogr, 42(4-5): 907-932, doi:10.1016/0967-0645(95)00056-V.
van Oostende N, Harlay J, Vanelslander B, et al. 2012. Phytoplankton community dynamics during late spring coccolithophore blooms at the continental margin of the Celtic Sea (North East Atlantic, 2006–2008). Prog Oceanogr, 104: 1-16, doi:10.1016/j.pocean.2012.04.016.
Wentz F J, Scott J, Hoffman R, et al. 2015. Remote Sensing Systems Cross-Calibrated Multi-Platform (CCMP) 6-hourly ocean vector wind analysis product on 0.25 deg grid, Version 2.0. Remote Sensing Systems, Santa Rosa, CA. Available online at www.remss.com/ measurements/ccmp.
Wright S W, van den Enden R L, Pearce I, et al. 2010. Phytoplankton community structure and stocks in the Southern Ocean (30–80°E) determined by CHEMTAX analysis of HPLC pigment signatures. Deep Sea Res Part II Top Stud Oceanogr, 57(9-10): 758-778, doi:10.1016/j.dsr2.2009.06.015.
Wurl O, Miller L, Vagle S. 2011. Production and fate of transparent exopolymer particles in the ocean. J Geophys Res, 116(C7): 2011JC007342, doi:10.1029/2011jc007342.
Wurl O, Stolle C, van Thuoc C, et al. 2016. Biofilm-like properties of the sea surface and predicted effects on air-sea CO2exchange. Prog Oceanogr, 144: 15-24, doi:10.1016/j.pocean.2016.03.002.
Yao P. 2005. Pigment analysis of planktonic algae in Jiaozhou Bay and study of pigment-based classification methods. Doctoral dissertation, Ocean University of China (in Chinese).
Zamanillo M, Ortega-Retuerta E, Nunes S, et al. 2019. Distribution of transparent exopolymer particles (TEP) in distinct regions of the Southern Ocean. Sci Total Environ, 691: 736-748, doi:10.1016/j. scitotenv.2019.06.524.
31 July 2021;
26 October 2021;
30 March 2022
10.13679/j.advps.2021.0034
: Xue S Y, Hu J, Feng Y B, et al. Distribution of transparent exopolymer particles and their response to phytoplankton community structure changes in the Amundsen Sea, Antarctica. Adv Polar Sci, 2022, 33(1): 44-54,doi:10.13679/j. advps.2021.0034
, ORCID: 0000-0001-5879-0197, E-mail: huj@sio.org.cn
杂志排行
Advances in Polar Science的其它文章
- Foreword
- “Opinion Editorial” category attracts more attention
- One special issue will be published in late 2022
- Potential suitable sites for the calibration of Scientific Echo Sounder in the marginal seas around Antarctica
- Research on submesoscale eddy and front near the South Shetland Islands (Antarctic Peninsula) using seismic oceanography data
- Variability of size-fractionated phytoplankton standing stock in the Amundsen Sea during summer
