Horizontal distribution of tintinnids (Ciliophora) in surface waters of the Ross Sea and polynya in the Amundsen Sea (Antarctica) during summer 2019/2020
2022-07-20WANGChaofengXUZhiqiangLIHaiboWANGYongqiangZHANGWuchang
WANG Chaofeng, XU Zhiqiang, LI Haibo, WANG Yongqiang & ZHANG Wuchang*
Horizontal distribution of tintinnids (Ciliophora) in surface waters of the Ross Sea and polynya in the Amundsen Sea (Antarctica) during summer 2019/2020
WANG Chaofeng1,2,3, XU Zhiqiang2,4, LI Haibo1,2,3, WANG Yongqiang3,5& ZHANG Wuchang1,2,3*
1CAS Key Laboratory of Marine Ecology and Environmental Sciences, Institute of Oceanology, Chinese Academy of Sciences, Qingdao 266071, China;2Laboratory for Marine Ecology and Environmental Science, Qingdao National Laboratory for Marine Science and Technology, Qingdao 266237, China;3Center for Ocean Mega-Science, Chinese Academy of Sciences, Qingdao 266071, China;4Jiaozhou Bay Marine Ecosystem Research Station, Institute of Oceanology, Chinese Academy of Sciences, Qingdao 266071, China;5Marine Biological Museum, Institute of Oceanology, Chinese Academy of Sciences, Qingdao 266071, China
Information on tintinnid horizontal distribution in the Antarctic Continental Zone is scarce. During the summer of 2019/2020, tintinnid diversity and horizontal distribution in surface waters were investigated in the Ross Sea and Amundsen Sea polynya. Eight tintinnid species were found and the dominant species showed obvious horizontal distribution characteristics. In the Ross Sea, three tintinnid community groups were identified.and(group I) were dominant species and were mainly distributed in stations closer to the coast than were species in the other two groups(group II) and(group III) were mainly distributed in nearshore and offshore stations, respectively. In the Amundsen Sea polynya, the dominant species,and(group I) were mainly distributed in stations closer to the coast than were species in the other two groups(group III) was mainly distributed in offshore stations. The distribution area whereandwere found in high abundance and abundance proportion of loricae with protoplasts was divided by the approximate boundary of the Antarctic Slope Front Current and Coastal Current in the Ross Sea. The highest abundance proportion in the Ross Sea was the 32–36 μm lorica oral diameter (LOD) size class (75.7%), and the 36–40 μm LOD size class (56.0%) was found in the Amundsen Sea polynya. Temperature– salinity–plankton diagrams of the two seas revealed that temperature may be the main reason for species distribution. Our results contribute to a better understanding of horizontal distribution of the microbial food web, and serve as a baseline for future studies of pelagic community change in the Antarctic Continental Zone.
Antarctic Continental Zone, tintinnid, community structure, Ross Sea, Amundsen Sea polynya
1 Introduction
The Southern Ocean (locations below 40°S) is made up of a complex of currents (Caccavo et al., 2018; Thompson et al., 2018). According to the positions of three fronts (the Subantarctic Front, Polar Front, and Continental Water Boundary), the Southern Ocean is divided into four distinct circular zones (Subantarctic, Polar Frontal, Antarctic and Continental Zone from north to south) around the Antarctic continent (Tomczak and Godfrey, 1994; Patmore et al., 2019). Previous studies have shown that the Subantarctic and Antarctic Zones have different zooplankton (including tintinnids) and phytoplankton compositions, divided by the Polar Front (David, 1955; Kane, 1966; Deacon, 1982; Dolan et al., 2012; Liang et al., 2020). There have, however, been few studies of tintinnid horizontal distribution in surface waters of the Continental Zone.
Tintinnids are single-cell protozoan plankton with loricae around their bodies and can live in marine and freshwater habitats. They belong to the subclass Choreotrichia, class Spirotrichea and phylum Ciliophora (Lynn, 2008). Tintinnids are primary consumers of pico-sized (0.2–2 µm) and nano-sized (2–20 µm) plankton, as well as important food sources of metazoans and fish larvae (Stoecker et al., 1987; Dolan et al., 1999; Gómez, 2007). They play an important role in material circulation and energy flow from the microbial food web into the traditional food chain (Azam et al., 1983; Pierce and Turner, 1992; Calbet and Saiz, 2005).
Surface dynamics in the Continental Zone are heavily influenced by the local atmosphere and ocean interactions as well as by sea ice freezing and melting processes (Fonda Umani et al., 2005). The Ross Sea ecosystem, an important component of the Continental Zone marine ecosystem, is also influenced by many currents such as the Antarctic Slope Current (ASC), Coastal Current (CC) and the Ross Sea Gyre (Williams et al., 2015). Previous studies have found several tintinnid species distributed in small areas in the western (Monti and Fonda Umani, 1995, 2000; Fonda Umani et al., 1998, 2002; Safi et al., 2012; Monti et al., 2017) and southern parts of the Ross Sea (Stoecker et al., 1995; Fonda Umani et al., 2005). The tintinnid community structure in the eastern part of the Ross Sea had not, however, been studied.
Polynyas – recurring areas of seasonally open water surrounded by sea ice – are common features in the Antarctic (Smith and Barber, 2007). The Amundsen Sea is a region characterized by a relatively narrow continental shelf, a large amount of perennial sea ice and a number of coastal polynyas adjacent to large ice shelves (Arrigo and van Dijken, 2003). Because relatively warm, salty and nutrient-rich Circumpolar Deep Water (CDW) intrudes close to the coast, the melt rate of the floating ice shelves increases, resulting in the formation of polynyas in the Amundsen Sea (Payne et al., 2007; Walker et al., 2007; Wahlin et al., 2010; Jacobs et al., 2011; Thompson et al., 2018) and subsequent phytoplankton blooms (Arrigo et al., 2003, 2012; Yang et al., 2019). There did not, however, appear to be an obvious increase in polynya tintinnid species composition and abundance around Pine Island Bay, Amundsen Sea (Dolan et al., 2013; Jiang et al., 2014, 2016a, 2016b). It was not known whether tintinnids had different horizontal distribution characteristics in the Amundsen Sea polynya.
Our study aimed to uncover: (1) the horizontal distribution of tintinnids in the Continental Zone; (2) the different tintinnid communities in the Ross Sea and the Amundsen Sea polynya; and (3) the relationship between tintinnids and environmental factors in the investigated area. These data also serve as a baseline for monitoring the planktonic zooplankton response to environmental change in the Antarctic Continental Zone.
2 Materials and methods
2.1 Study area and sample collection
Tintinnids were sampled at 43 stations from 4 to 30 January 2020, during the 36th Chinese National Antarctic Research Expedition aboard R/Vin two sea areas (Figure 1). In the Ross Sea, 25 stations (stations R1–R25) were sampled from 4 to 10 January 2020. In the Amundsen Sea polynya, 18 stations (stations A1–A18) were sampled from 25 to 30 January 2020 (Table 1). The sampling time only occupied 1 min from a moving ship in all stations except stations R1 and R2 (5 min). The speed of the moving ship was 10 knots·h−1(equal to 5 m·s−1). Therefore, our sampling location distance was about 300 m. This distance occupied 0.30% of the distance between two stations, which was about 100 km. Ice cover data were sourced from Sea Ice Remote Sensing at the University of Bremen (https://seaice. uni-bremen.de/sea-ice-concentration/).
Tintinnid samples were collected with an onboard continuous underway sampling system at a depth of 5 m (surface water) while the ship was cruising. Between 10 L and 60 L of seawater was gently filtered through a 10-μm mesh net. The samples (~150 mL) in the cod end of the net were transferred into sample bottles and immediately fixed with Lugol’s solution (1% final concentration). Samples were kept in a cool, dark environment for preservation.
Surface water temperature (°C) and salinity were determined using a WTW Cond 3210 SET 1 portable water quality analyzer (Xylem, Munich, Germany). Chlorophyll(Chl) concentration was determined by filtering 500 mL of seawater through a Whatman GF/F glass fiber filter. Plankton retained on the filter was extracted in 90% (v·v−1) acetone. Fluorescence was measured according to the JGOFS protocol (Knap et al., 1996) using a Turner Trilogy fluorometer Model 10 (Turner Designs, San Jose, US).

Figure 1 Survey stations in the Ross Sea and Amundsen Sea polynya of the Antarctic. White dotted line delimits the ice edge covered by sea ice during sampling time. Arrows showed currents following Williams et al. (2015) and Thompson et al. (2018). RSG, Ross Sea Gyre; ASFC, Antarctic Slope Front Current; CC, Coastal Current. Blue triangle, group I; Red circles, group II; Cyan inverted triangle, group III. No tintinnid was found in station R23.
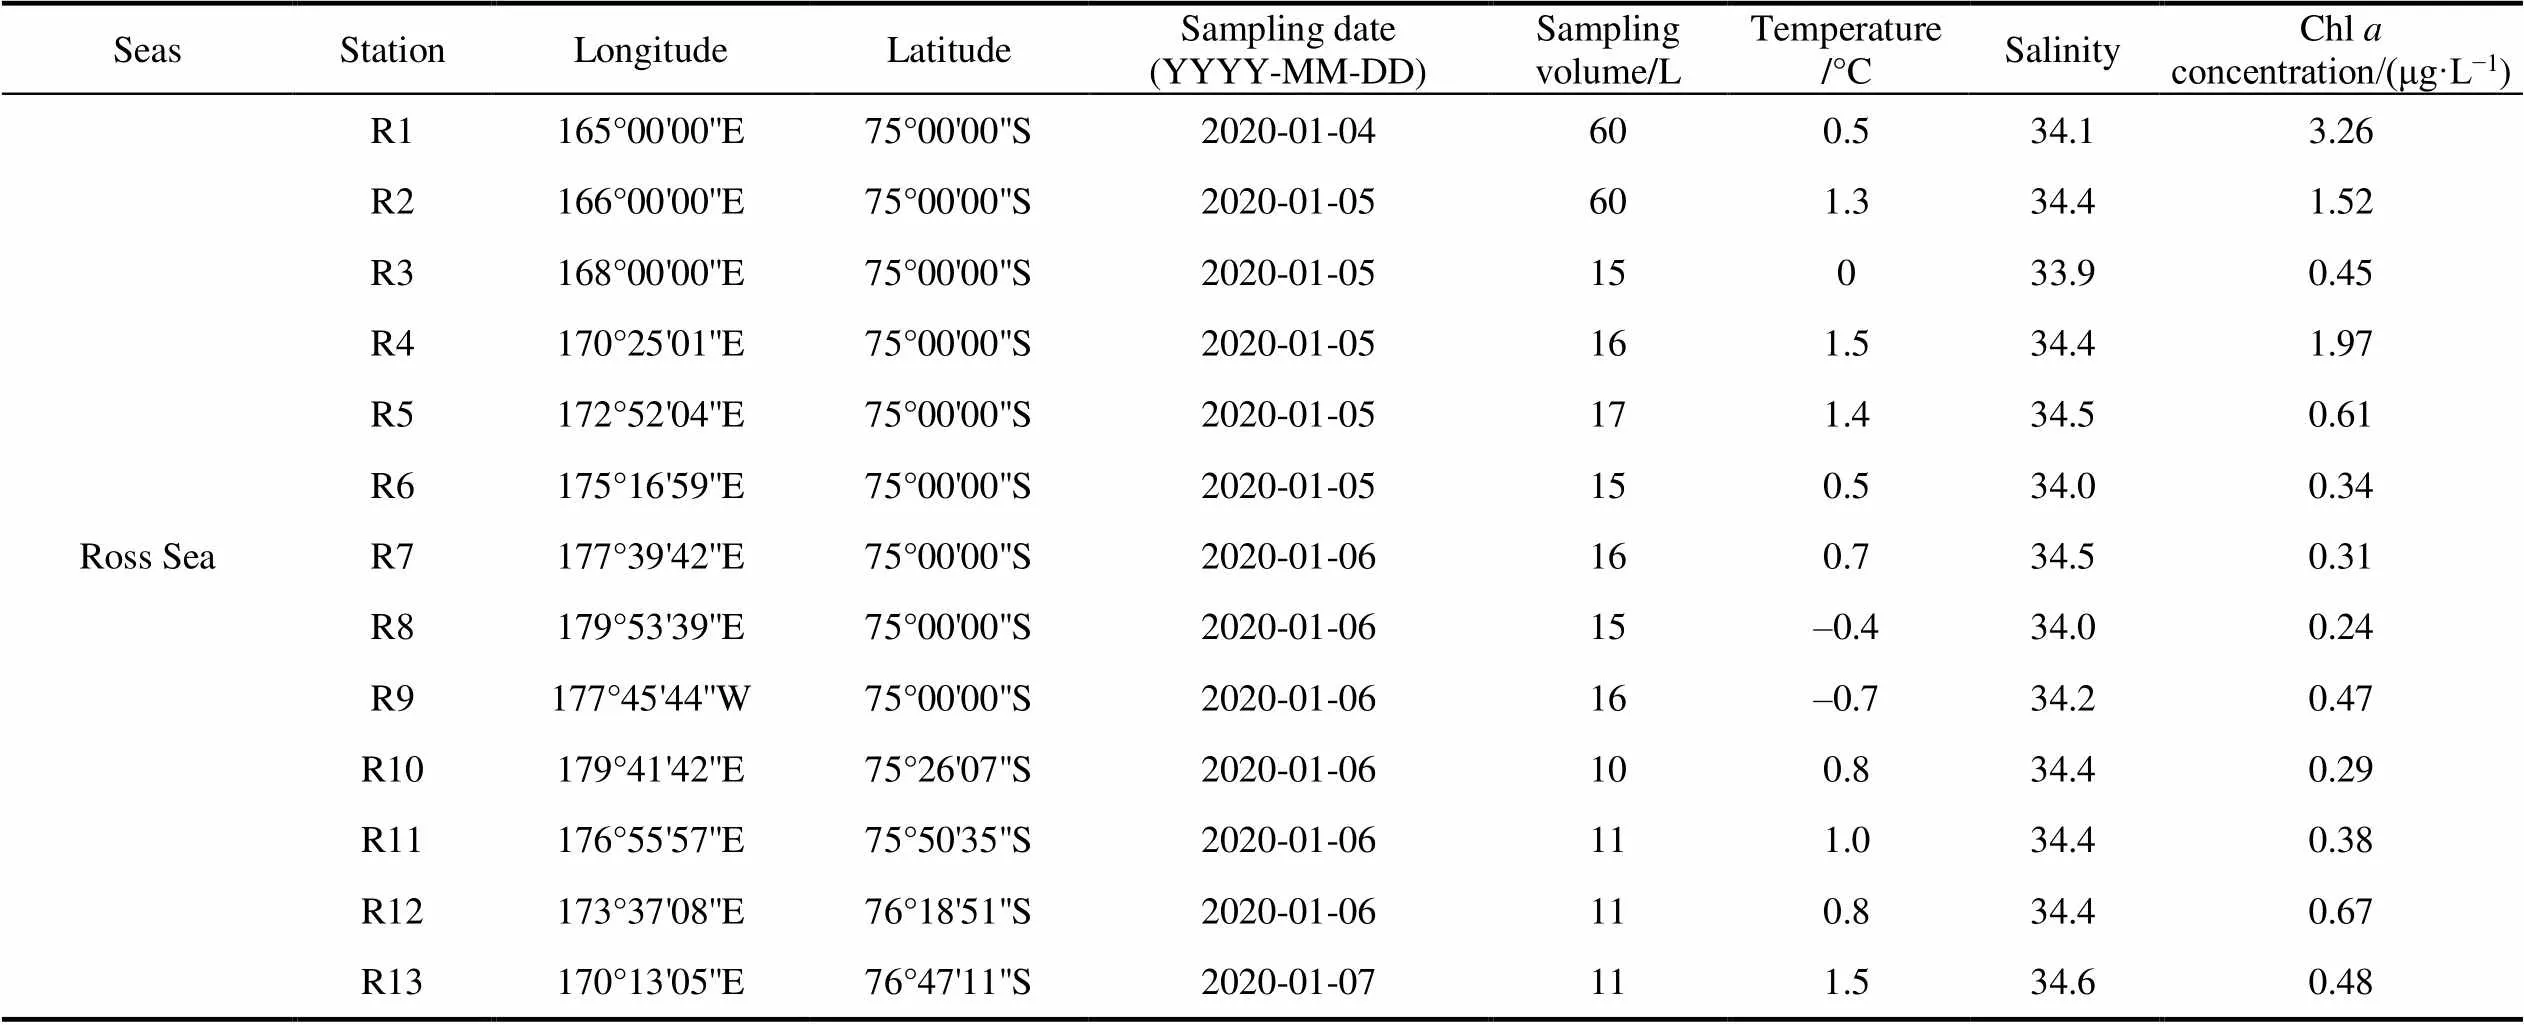
Table 1 List of stations with sampling date, sampling volume and environmental factors (temperature, salinity and Chl a concentration) in surface layers
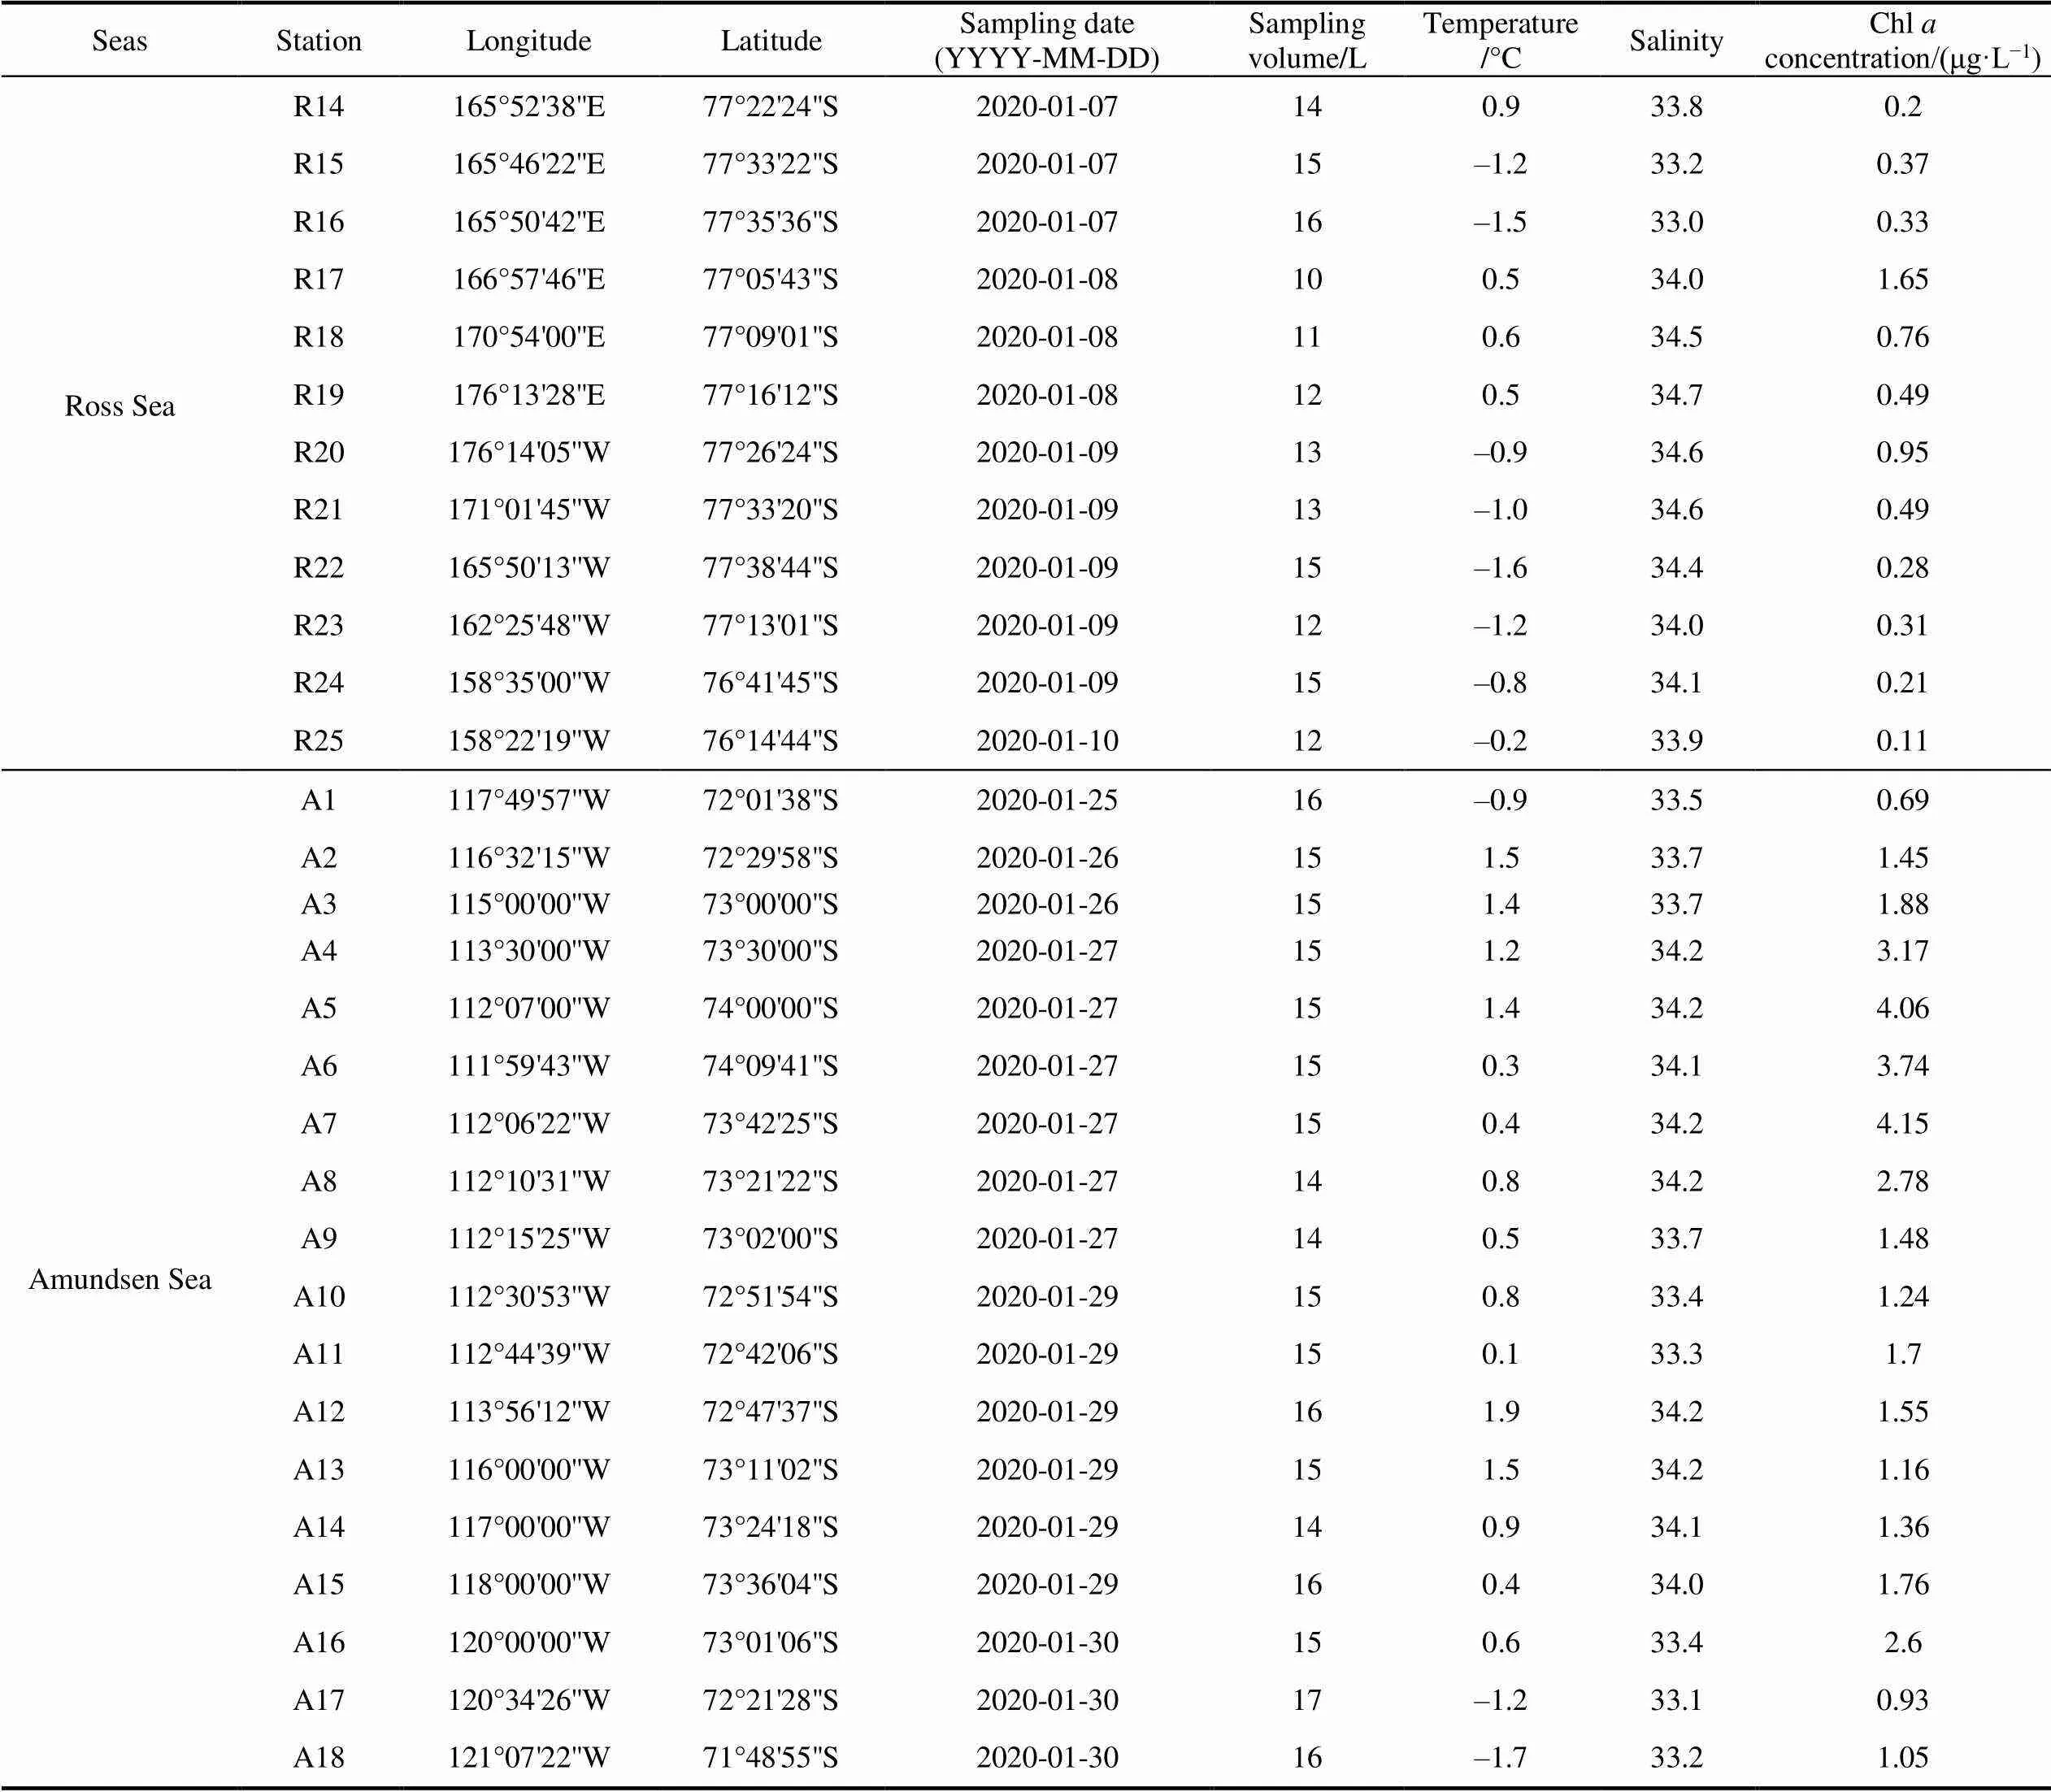
Continued
2.2 Sample analysis and species identification
In the laboratory, a 25-mL subsample (or a larger volume if tintinnids were scarce) from each original sample was settled in a Utermöhl counting chamber (Utermöhl, 1958) for at least 24 h and examined using an Olympus IX 71 inverted microscope (Olympus, Tokyo, Japan) at a magnification of ×100 or ×400. At least 20 individuals (if possible) of each species were photographed and measured. Tintinnids have morphological plasticity and intermediate form morphologies, especially in polymorphic genera such asand(Dolan et al., 2013; Liang et al., 2018, 2020). To reduce deviation, tintinnid species with morphological plasticity and intermediate form morphologies were assigned to the closest species based on lorica morphology and size, according to the literature (Laackmann, 1910; Boltovskoy et al., 1990; Zhang et al., 2012; Dolan et al., 2013; Liang et al., 2018, 2020). Because mechanical and chemical disturbance during collection and fixation can detach the tintinnid protoplasts from the loricae (Paranjape and Gold, 1982; Alder, 1999), we included empty tintinnid loricae in cell counts. Empty loricae and loricae with protoplasts for each species were counted separately. We hypothesized that the abundance proportion of loricae with protoplasts higher than 50% can reflect a suitable environment for this species.
2.3 Data processing
Tintinnid species richness in each station indicated the number of tintinnid species that appeared in that station. Abundance of each tintinnid species (A, ind·L−1) in each station was calculated using Eq (1):
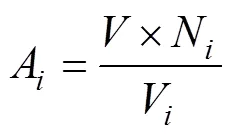
where(L) is the volume of the sample,Nis the individual number of speciesin the subsample andVis the volume of the subsample (L). Total tintinnid abundance in each station was the sum of each tintinnid abundance appearing in this station. Occurrence frequency (OF, %) of each tintinnid species was calculated as the percentage of samples in which the species appeared. The number of stations where each species appeared in the Ross Sea and Amundsen Sea polynya were 25 and 18, respectively.
The dominance index () of tintinnid species in one assemblage was calculated using Eq (2) (Xu and Chen, 1989):
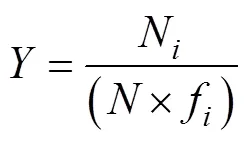
whereNis the number of individuals of speciesin all samples,fis the occurrence frequency of speciesin all samples andis the total number of all species. Species with> 0.02 represented the dominant species in an assemblage.
Distributional data were presented by ODV (Ocean Data View, Version 4.7, Reiner Schlitzer, Alfred Wegener Institute, Bremerhaven, Germany), Surfer (Version 13.0, Golden Software Inc., Golden, CO, USA) and Grapher (Version 12.0, Golden Software Inc., Golden, CO, USA). Cluster analysis was performed using PRIMER (Version 5.0, PRIMER-e, Plymouth, UK) based on the abundances of different tintinnid species at each station. Group-average linkage based on the Bray–Curtis similarity matrix of the fourth root transformed from the original data was used. Correlation analysis between environmental and biological variables was performed using SPSS (Version 16, SPSS Inc., IBM Corp., Armonk, NY, USA). The significance for spatial pattern was tested by PERMANOVA analysis in PERMANOVA+ for PRIMER 6 (Anderson et al., 2008; Jiang et al., 2016c).
3 Results
3.1 Hydrographic features and tintinnid abundance
The surface water temperature ranged from −1.7°C (St. A18) to 1.9°C (St. A12) in the study areas (Figure 2; Table 1). High temperature areas were located in the western and southern sides of the Ross Sea and Amundsen Sea polynya, respectively (Figure 2). Surface salinity was high (> 34.0) in the central Ross Sea. In the Amundsen Sea polynya, salinity increased from north to south (Figure 2). In the Ross Sea, high Chlconcentrations (> 1.0 μg·L−1) occurred on the western side near the shelf area. In the Amundsen Sea polynya, high Chlconcentrations occurred in stations located on the southern side of 72.5°S (Figure 2).
Total tintinnid abundance ranged from 0.0 to 816.0 ind.·L−1and 4.6 to 343.9 ind.·L−1in the Ross Sea and Amundsen Sea polynya, respectively. High abundance of total tintinnids (> 100 ind.·L−1) was found on the western and southern sides near the shelf area in the Ross Sea (Figure 2). In the Amundsen Sea polynya, high abundance of total tintinnids was found on the southern side of 72.5°S (Figure 2). The distribution of a high abundance proportion of loricae with protoplasts (> 50%) was similar to the high total abundance in the Ross Sea. In the Amundsen Sea polynya, all stations had a high abundance proportion of loricae with protoplasts (Figure 2).
3.2 Tintinnid species composition
We identified eight species from four genera (Figure 3; Table 2) from all samples. Seven species and five species were found in the Ross Sea and Amundsen Sea polynya, respectively (Table 2).(= 0.48) and(= 0.12) were the dominant species in the Ross Sea. In the Amundsen Sea polynya,(= 0.47),(= 0.27) and(= 0.08) were dominant species (Table 2).had the highest occurrence frequency in both the Ross Sea (68.0%) and Amundsen Sea polynya (88.9%). In the Ross Sea,had the highest average abundance (60.7 ± 162.5 ind.·L−1). In the Amundsen Sea polynya,had the highest average abundance (54.0 ± 72.2 ind.·L−1) (Table 2). Occurrence frequency of all other species was less than 36% (Table 2). All species (except, which only occurred in one station) abundance proportion of loricae with protoplast were higher than 52.2% (Table 2).
3.3 Tintinnid community classification
We identified three and two distinctive tintinnid community groups in surface waters of the Ross Sea and Amundsen Sea polynya, respectively, based on cluster analysis using tintinnid species data. Among them, Group II only occurred in the Ross Sea (Figures 4 and 5). PERMANOVA tests showed significant differences between the two groups irrespective of the environment (pseudo-= 11.686,= 0.001) or abundance (pseudo-= 8.9262,= 0.001) data, which showed that the grouping was reasonable (Tables 3 and 4).
In the Ross Sea, Group I was dominated byand(abundance proportion > 50%). Group II was dominated byexcept in Sts R15–R17. Group III was dominant by(Figure 4). Among them, Group II had both the maximum abundance (816.0 ind.·L−1, St. R19) and average abundance (114.4 ± 199.8 ind.·L−1). This was followed by Groups I (34.3 ± 54.1 ind.·L−1) and III (1.3 ± 0.3 ind.·L−1). The abundance proportion of other species at most stations was less than 13.1% (except in St. R3, where the abundance proportion was 50%) (Figure 4).
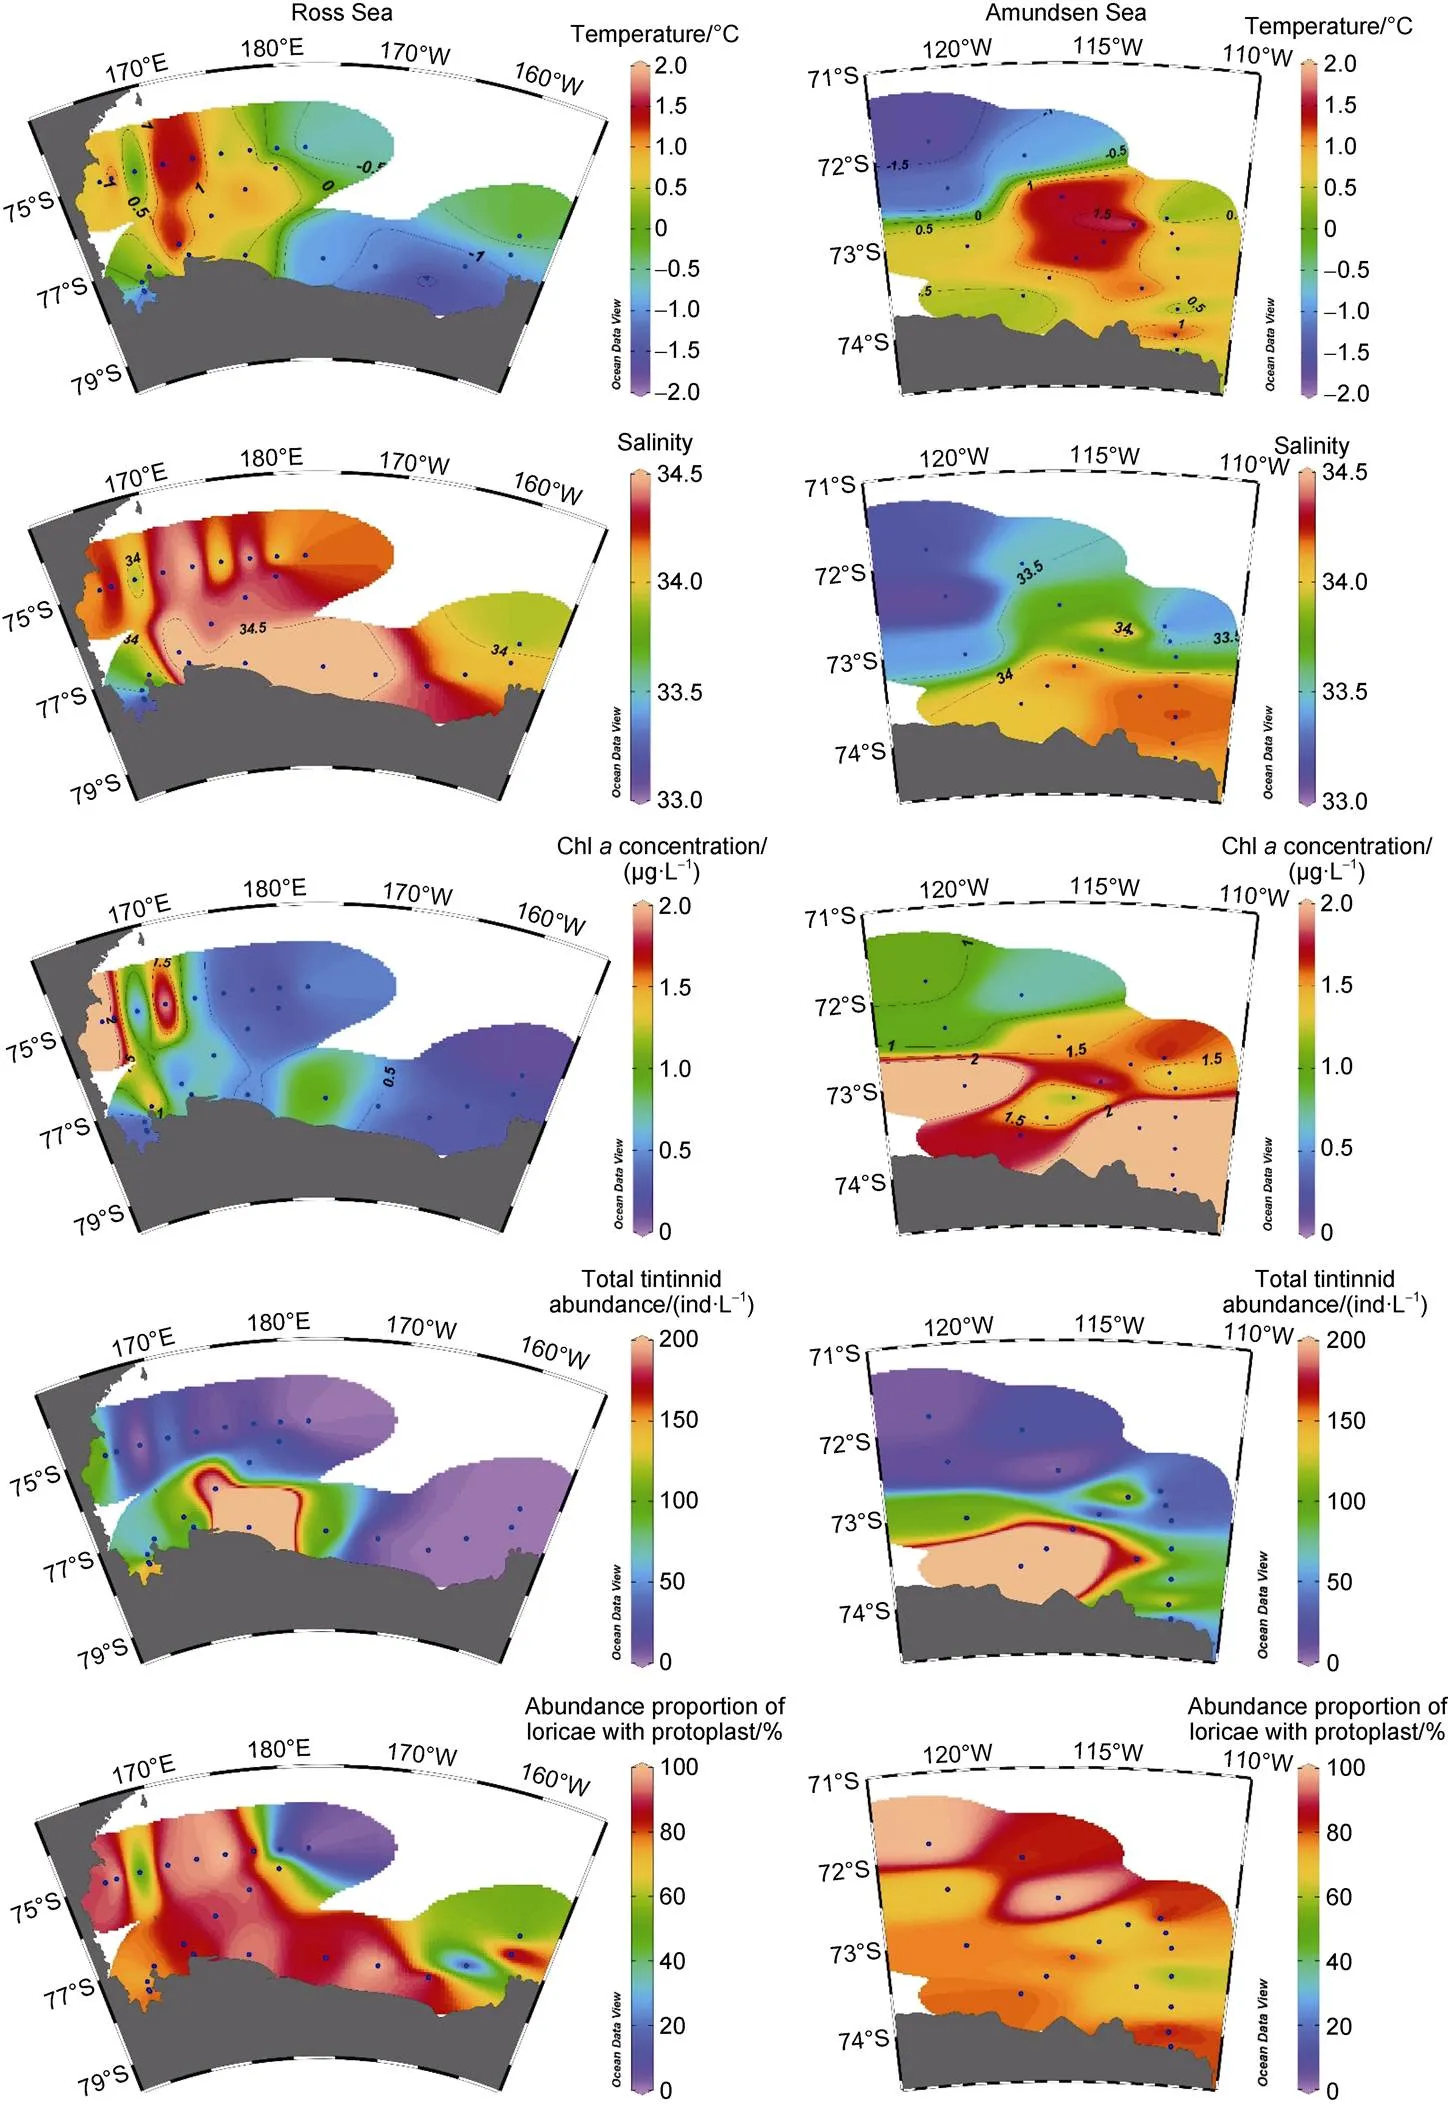
Figure 2 Horizontal distribution of temperature, salinity, Chlconcentration, total tintinnid abundance and abundance proportion of loricae with protoplast in the Ross Sea and Amundsen Sea polynya.
Figure 3 Photomicrographs of tintinnid species in survey stations. a,; b,.; c,; d,; e,; f,; g,; h,.

Table 2 Tintinnid species dimensions (LL: lorica length; LOD: lorica oral diameter), maximum abundance (Amax), average abundance (AA), abundance proportion of loricae with protoplasts (AP), dominance index (Y), occurrence frequency (OF), and station with maximum abundance (St.) in the Ross Sea and Amundsen Sea polynya

Table 3 Results of PERMANOVA based on Euclidean distance matrices derived from log-transformed environmental data between two groups
In the Amundsen Sea polynya, Group I was dominated by,and. Group III was dominated by(Figure 5). The averageabundance of Group I (106.6 ± 105.7 ind.·L−1) was higher than that of Group III (14.7 ± 12.5 ind.·L−1). No other species occurred in the Amundsen Sea polynya (Figure 5).

Table 4 Results of PERMANOVA based on Bray Curtis similarity matrices derived from Square root- transformed abundance data between two groups

Figure 4 Three tintinnid community groups were classified by cluster analysis and its tintinnid abundance and abundance proportion at each station in the Ross Sea. Group I (red dotted box) was dominated byand; Group II (black dotted box) were dominated by; Group III (blue dotted box) was dominated by
3.4 Horizontal distribution of dominant species and Cymatocylis convallaria
The horizontal distribution of dominant species andin different seas showed distinctive characteristics (Figures 6 and 7). In the Ross Sea, high abundance ofandwas mainly distributed in the southern and central sea areas, respectively. The high abundance proportion of loricae with protoplasts (> 60%) of these two species was mainly distributed in the central Ross Sea (Figure 6). Both high abundance and abundance proportion of loricae with protoplasts ofwere mainly distributed in the western Ross Sea near shelf areas (Figure 6). In the Amundsen Sea polynya, both high abundance and abundance proportion of loricae with protoplasts of,andwere mainly distributed on the southern side of 72.5°S, whilewas mainly distributed in opposite areas (Figure 7).
With respect to the distribution patterns of each species in surface waters of the two seas,,,andshowed a similar characteristic (Figure 8). The distribution pattern ofand, however, was inverse (Figure 8), especially in the Ross Sea (Figure 6).
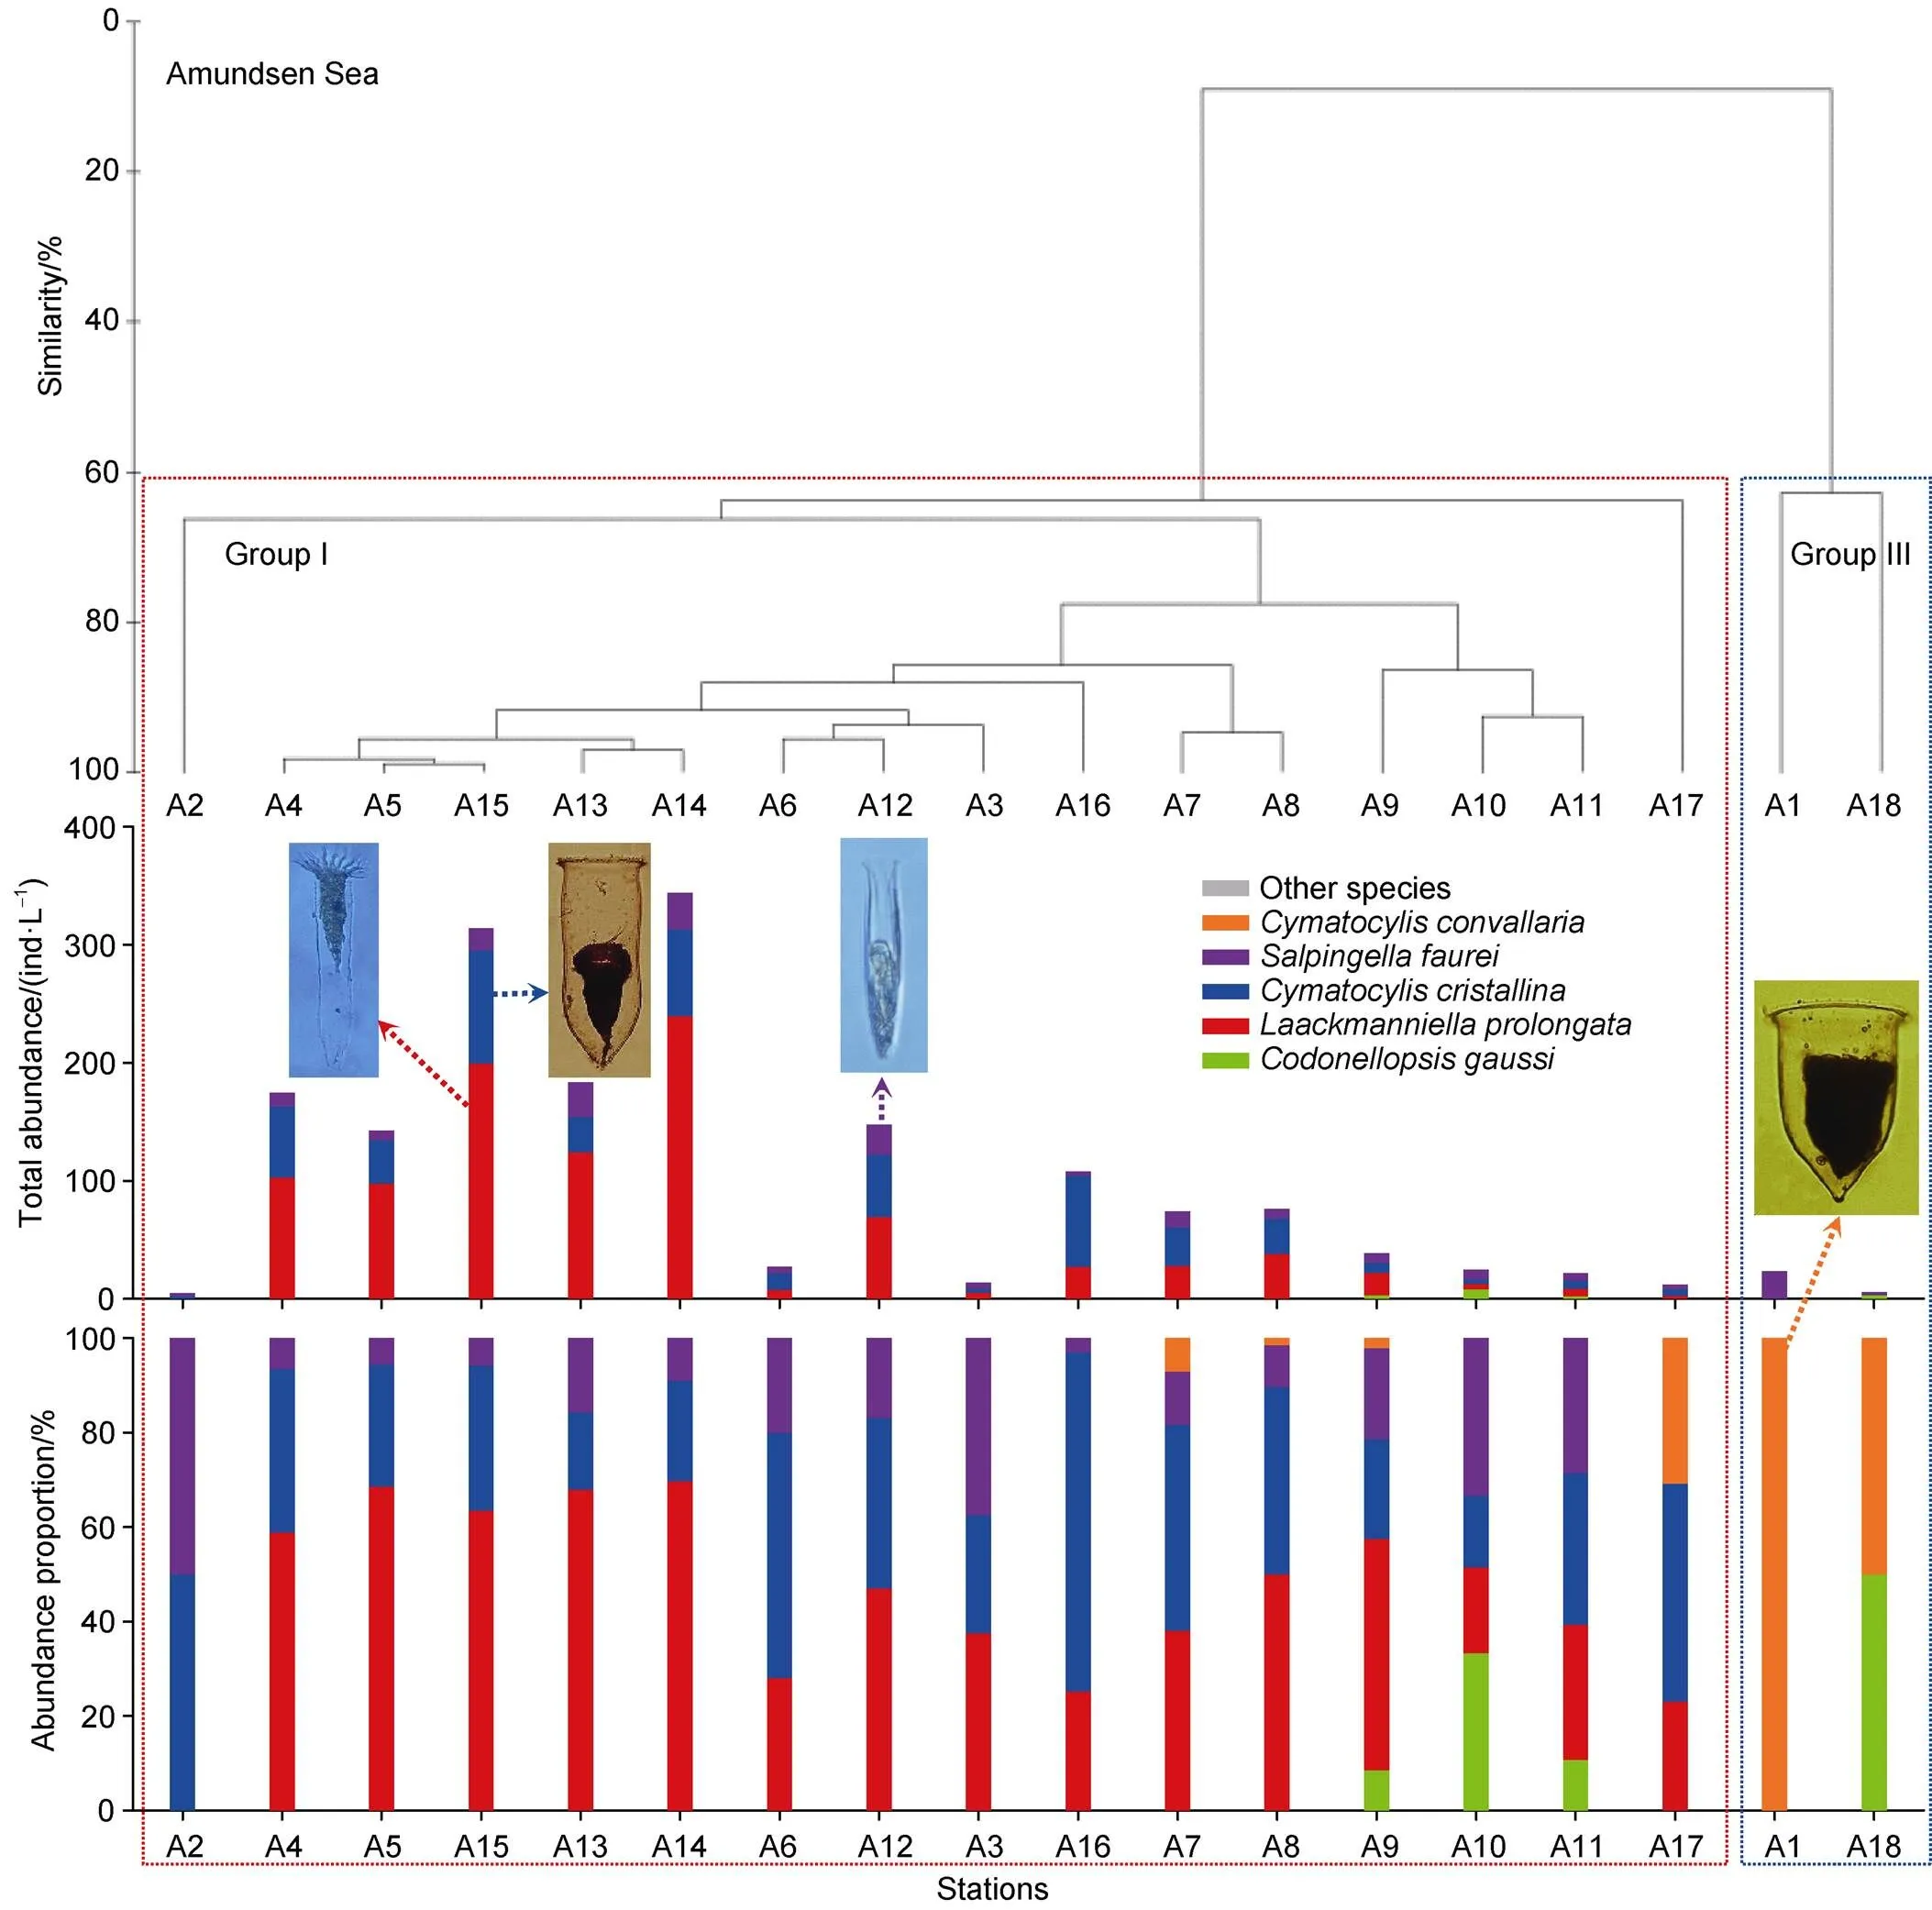
Figure 5 Two tintinnid community groups were classified by cluster analysis and its tintinnid abundance and abundance proportion at each station in the Amundsen Sea polynya. Group I (red dotted box) was dominated by,and; Group III (blue dotted box) was dominated by
3.5 Species richness and abundance proportion in tintinnid lorica oral diameter size class
The numbers of species richness and high abundance proportion in tintinnid lorica oral diameter (LOD) size classes were not consistent in the Ross Sea and Amundsen Sea polynya (Figure 9). Although the number of species richness in > 76 μm LOD size-classes was highest in both the Ross Sea (4) and Amundsen Sea polynya (2), the highest abundance proportions were 32–36 μm (75.7%) and 36–40 μm (56.0%) LOD size class, respectively (Figure 8).andwere the main contributors to these two LOD size classes, respectively. The 12–16 μm LOD size class only occurred in the Amundsen Sea polynya, andwas the sole species found (Figure 9).
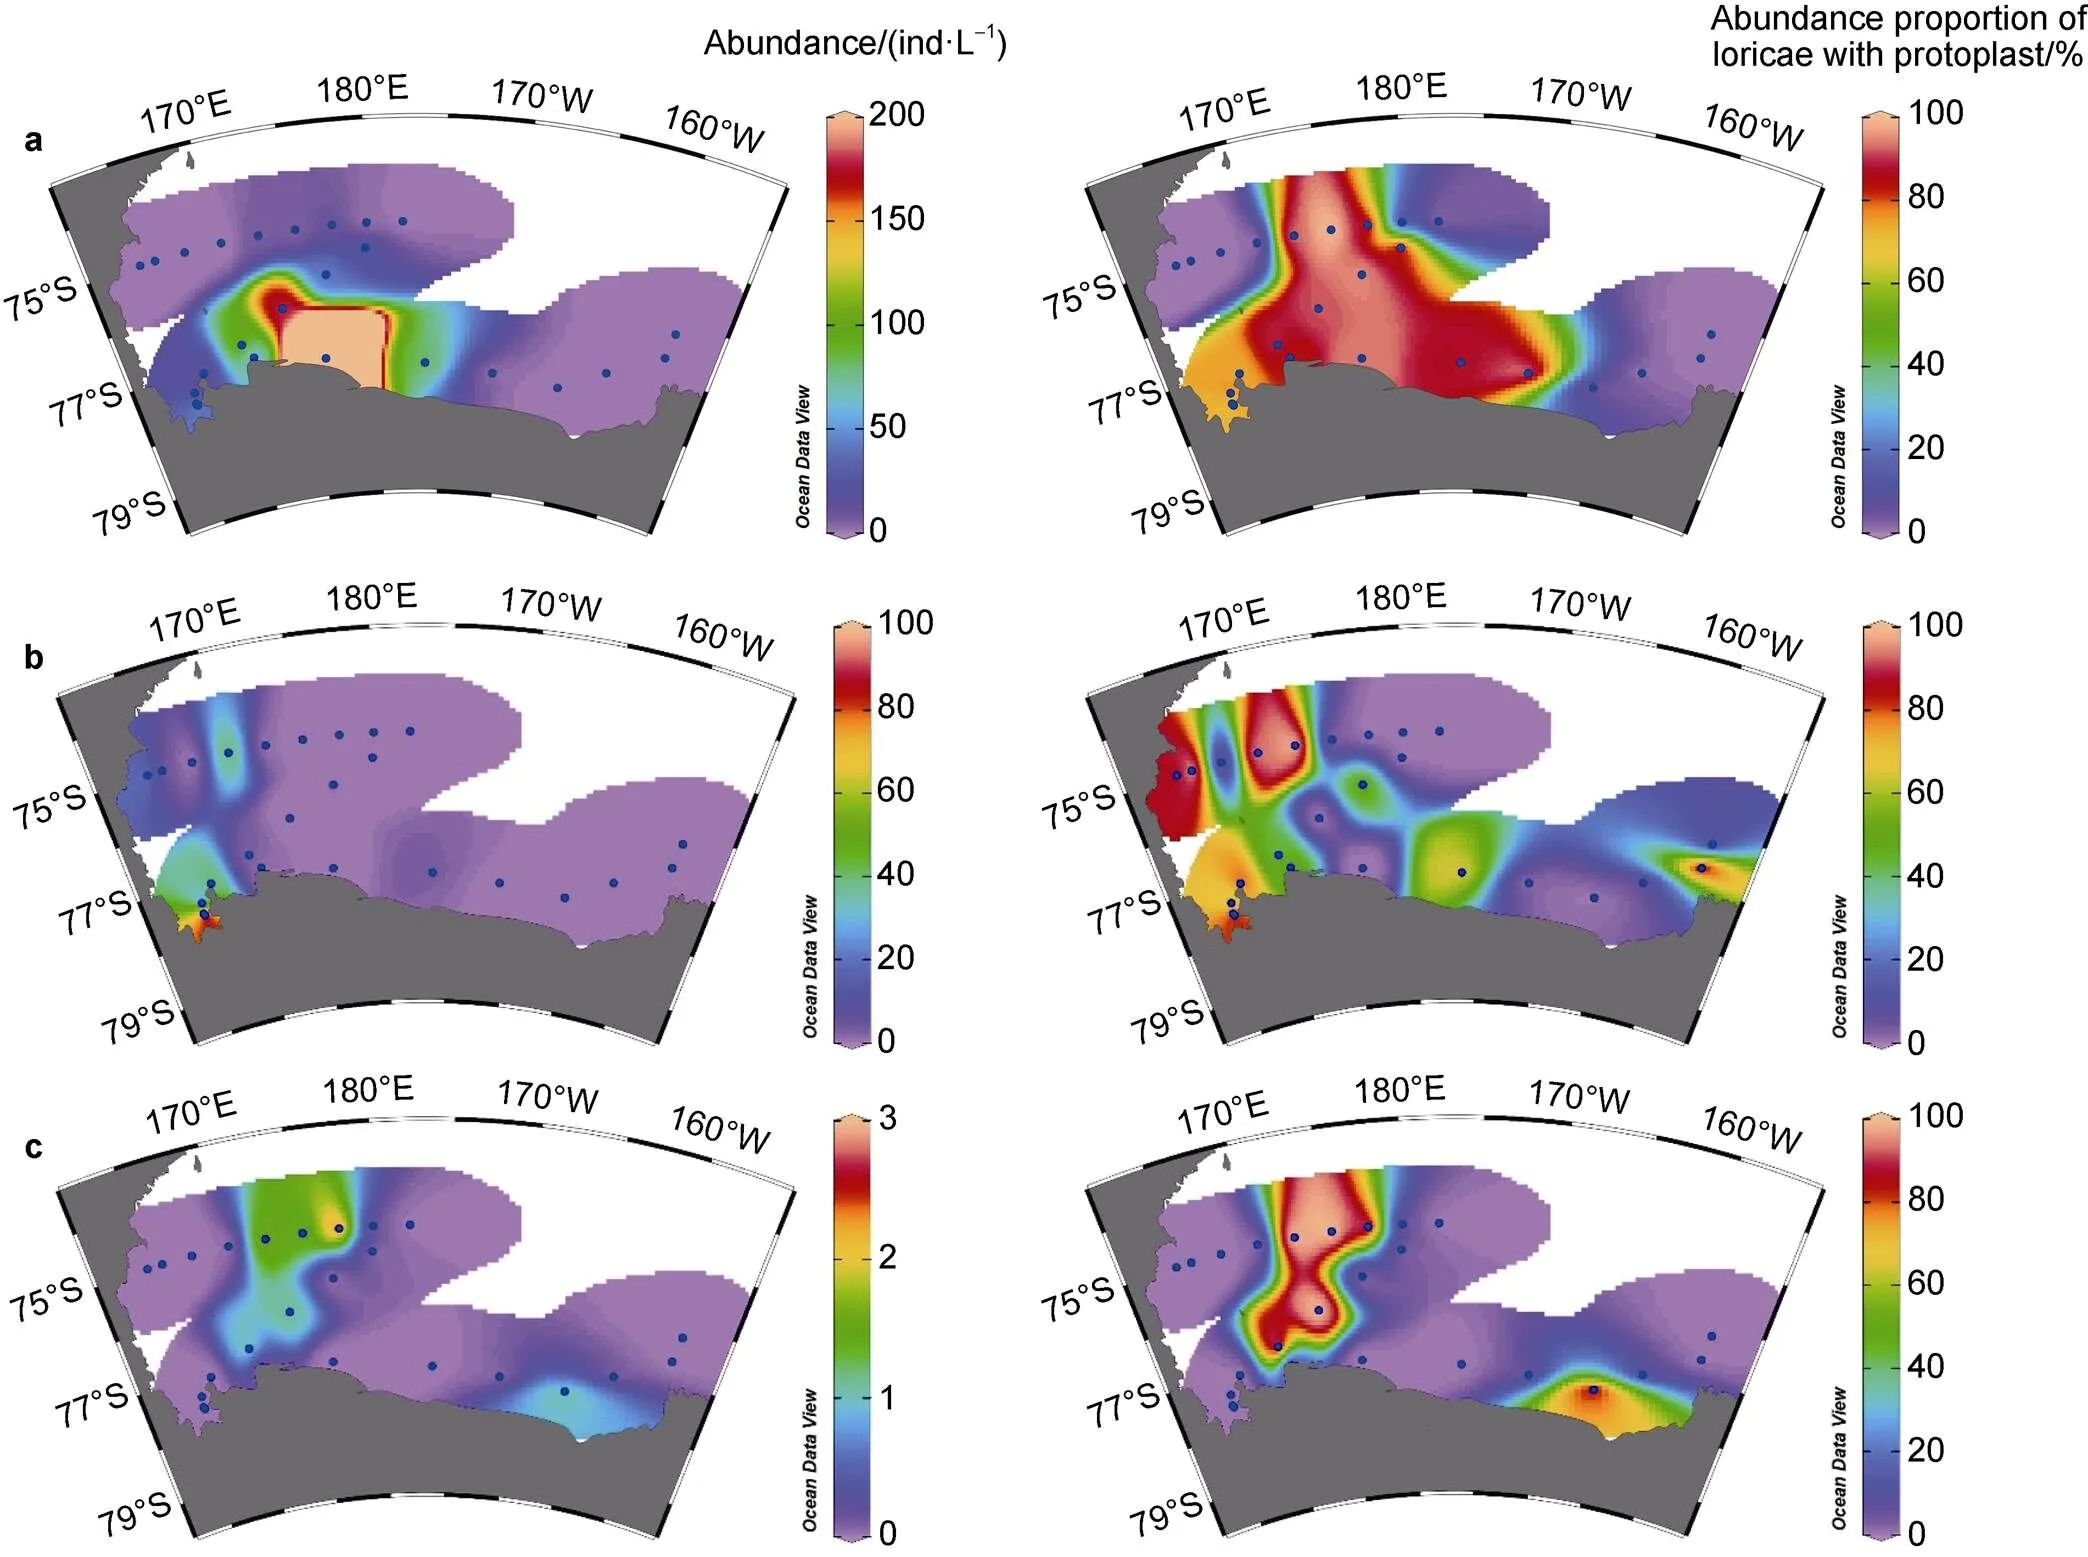
Figure 6 Abundance and abundance proportion of loricae with protoplast of(a),(b) and(c) in the Ross Sea.
3.6 Relationship between five tintinnids and environmental factors
Temperature–salinity–plankton diagrams showed that the high abundance of four abundant species andin the Ross Sea and Amundsen Sea polynya had different temperature and salinity ranges. The salinity range of tintinnid species in the Ross Sea (32.9–34.7) was relatively wider than in the Amundsen Sea polynya (33.1–34.3) (Figure 10). In the Ross Sea,andhad a wider temperature range (−1.7°C to 1.5°C) than(−1.2°C to 1.2°C). In the Amundsen Sea polynya,,andwere found in high abundance and at temperatures > 0°C, whereaswas found at temperatures < 1°C (Figure 10).
The abundance of each tintinnid species had a different correlation with environmental factors (depth, temperature, salinity and Chl) (Table 5).andhad negative and positive correlations with temperature in the Amundsen Sea polynya, respectively.had a negative correlation with salinity in the Amundsen Sea polynya.had a positive correlation with Chlin both the Ross Sea and Amundsen Sea polynya (Table 5). There was less correlation between environmental factors andand
4 Discussion
Dolan et al. (2012) examined 56 publications and found that 192 tintinnid species could be divided into endemic Southern Ocean species and widespread species. The assemblage of Southern Ocean endemics is found mostly within the Antarctic Zone, and delimited by the average location of the Polar Front (Dolan et al., 2012). The south side of the Polar Front, however, contains a huge sea area. There were few studies of tintinnid horizontal distribution in areas located on the southern side of the Polar Front. Our study found eight tintinnids in the Ross Sea and Amundsen Sea polynya, and several dominant species showed horizontal distribution characteristics according to their high abundance and abundance proportion of loricae with protoplasts.
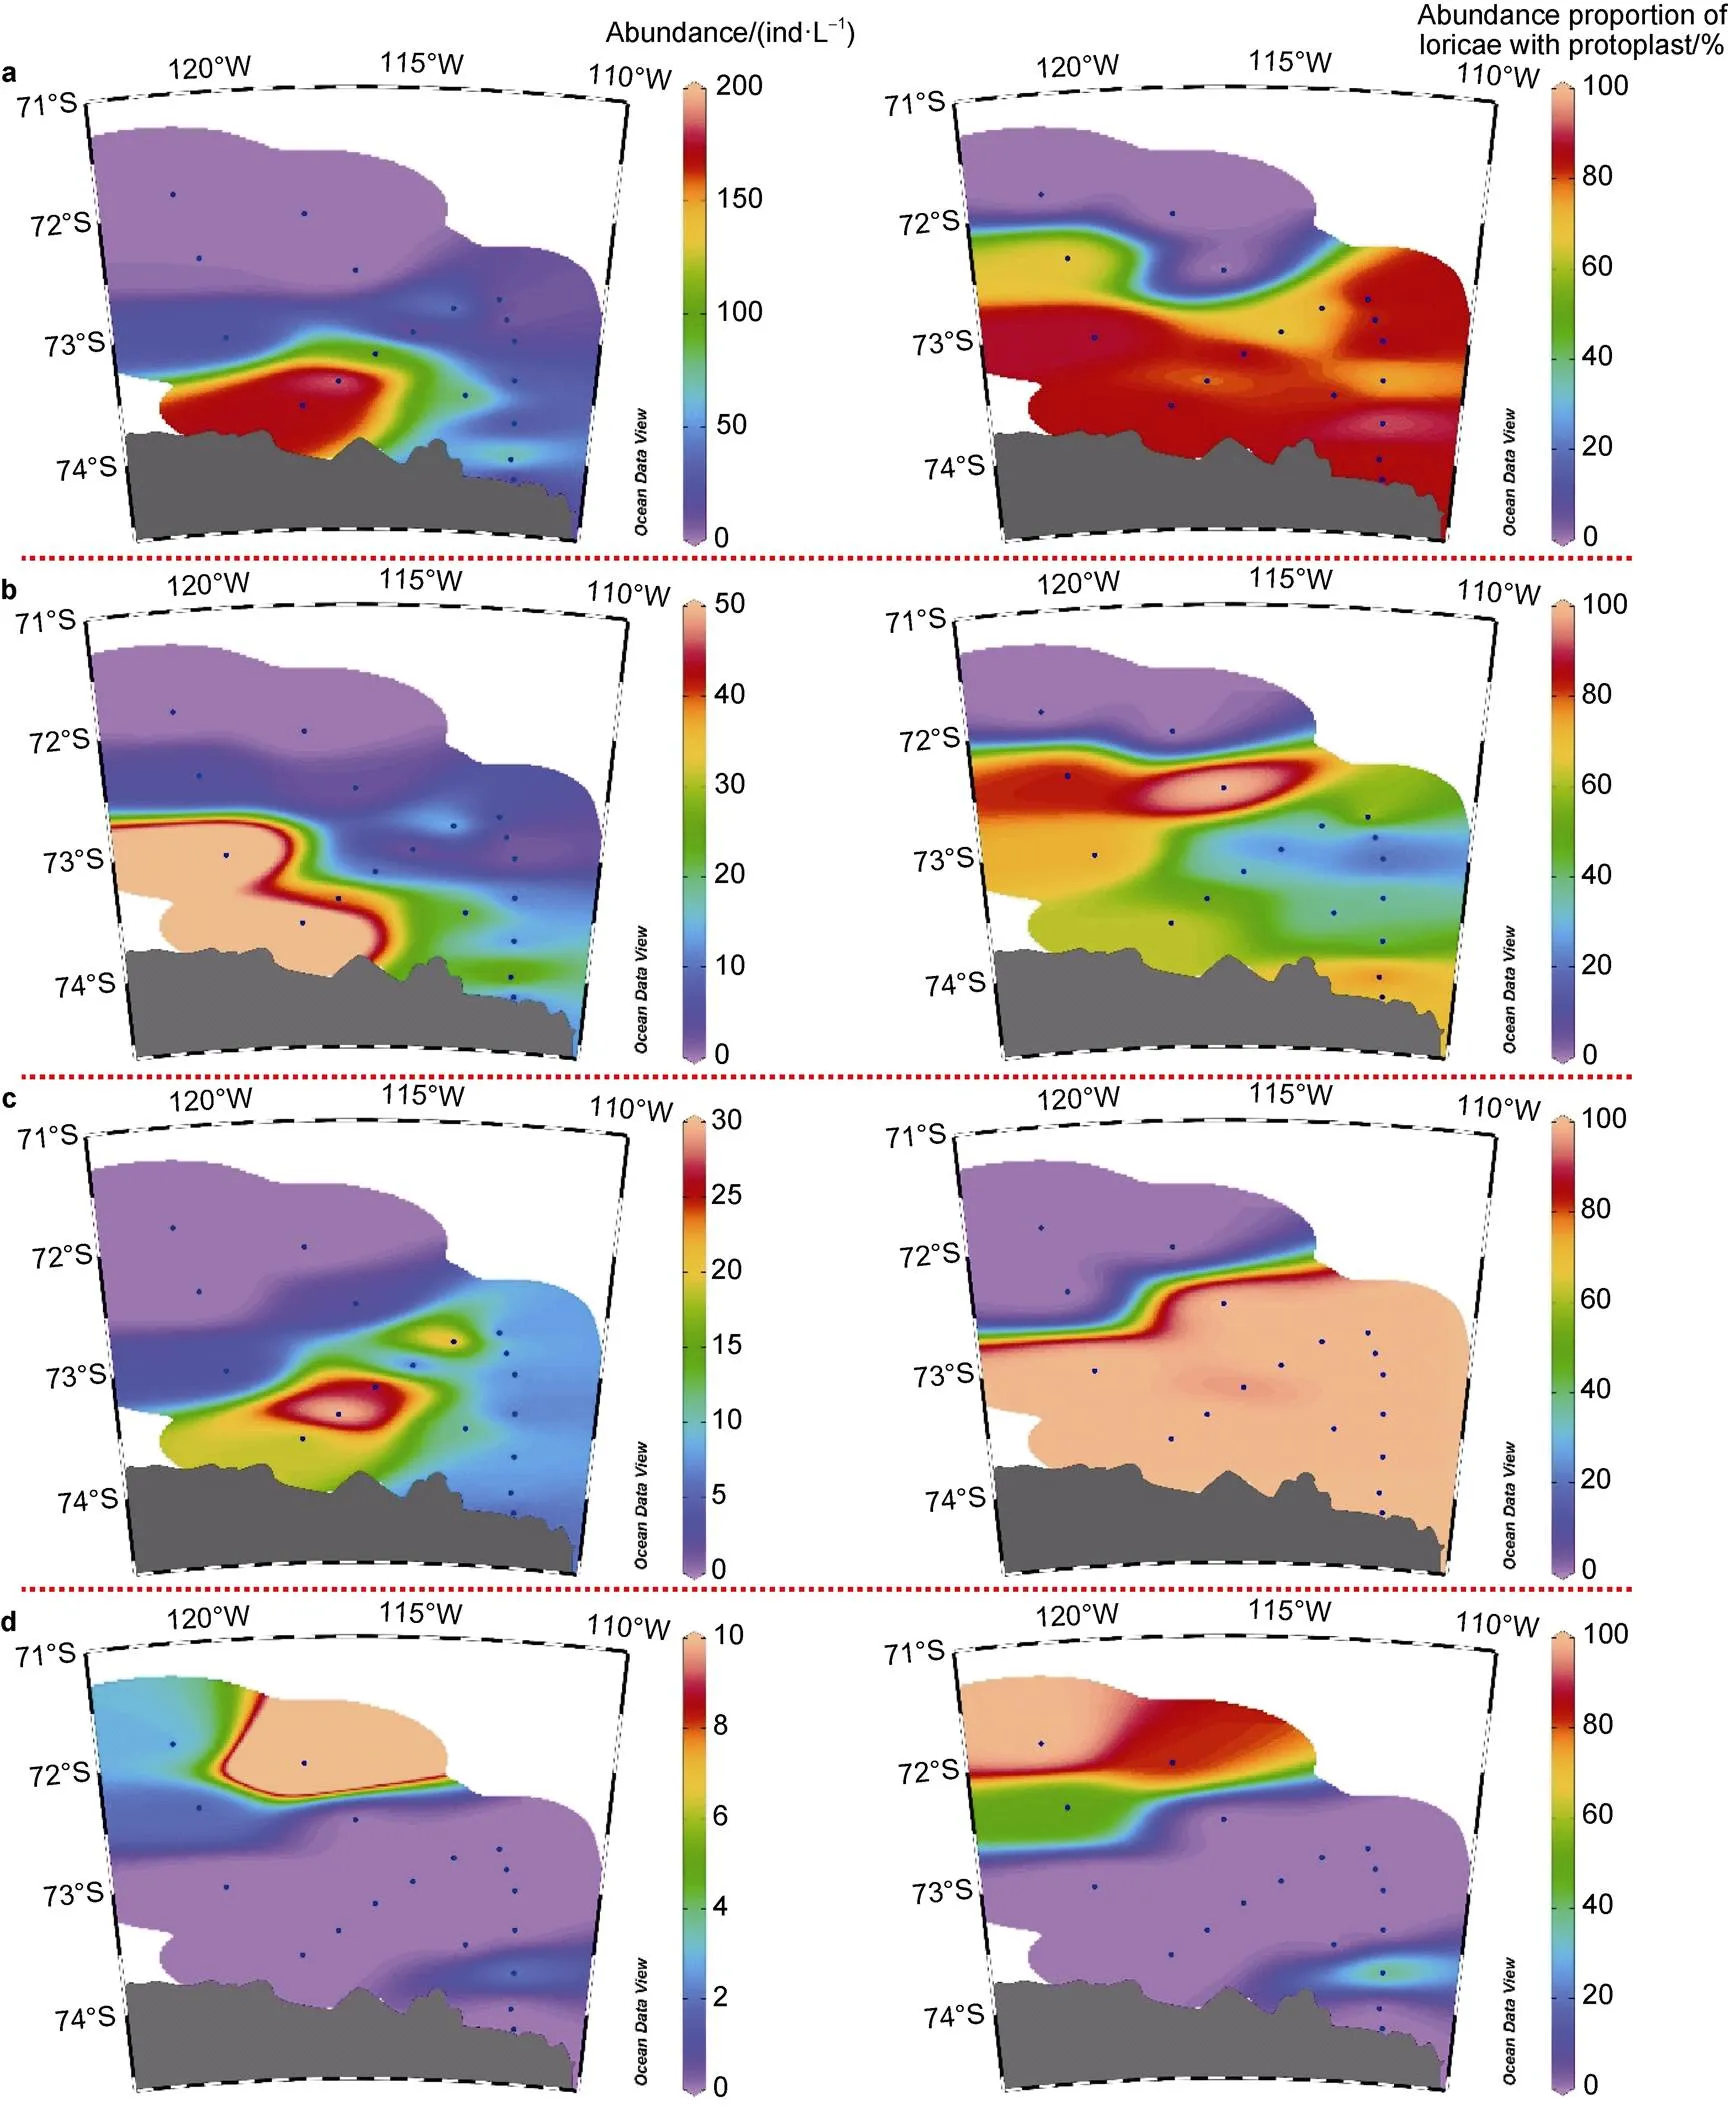
Figure 7 Abundance and abundance proportion of loricae with protoplast of(a),(b),(c) and(d) in the Amundsen Sea polynya.
4.1 Tintinnid distribution characteristics in the Antarctic
Spatial distribution information is the key to understanding tintinnid function in the marine ecosystem of the Antarctic.Horizontally,is mainly distributed in the Polar Front Zone.andare mainly distributed in the Polar Front and Antarctic Zones, while(a synonym of),,,andare mainly distributed in the Antarctic Zone (close to the coast) (Liang et al., 2020). Our results in the Ross Sea and Amundsen Sea polynya were similar to those of Liang et al. (2020).
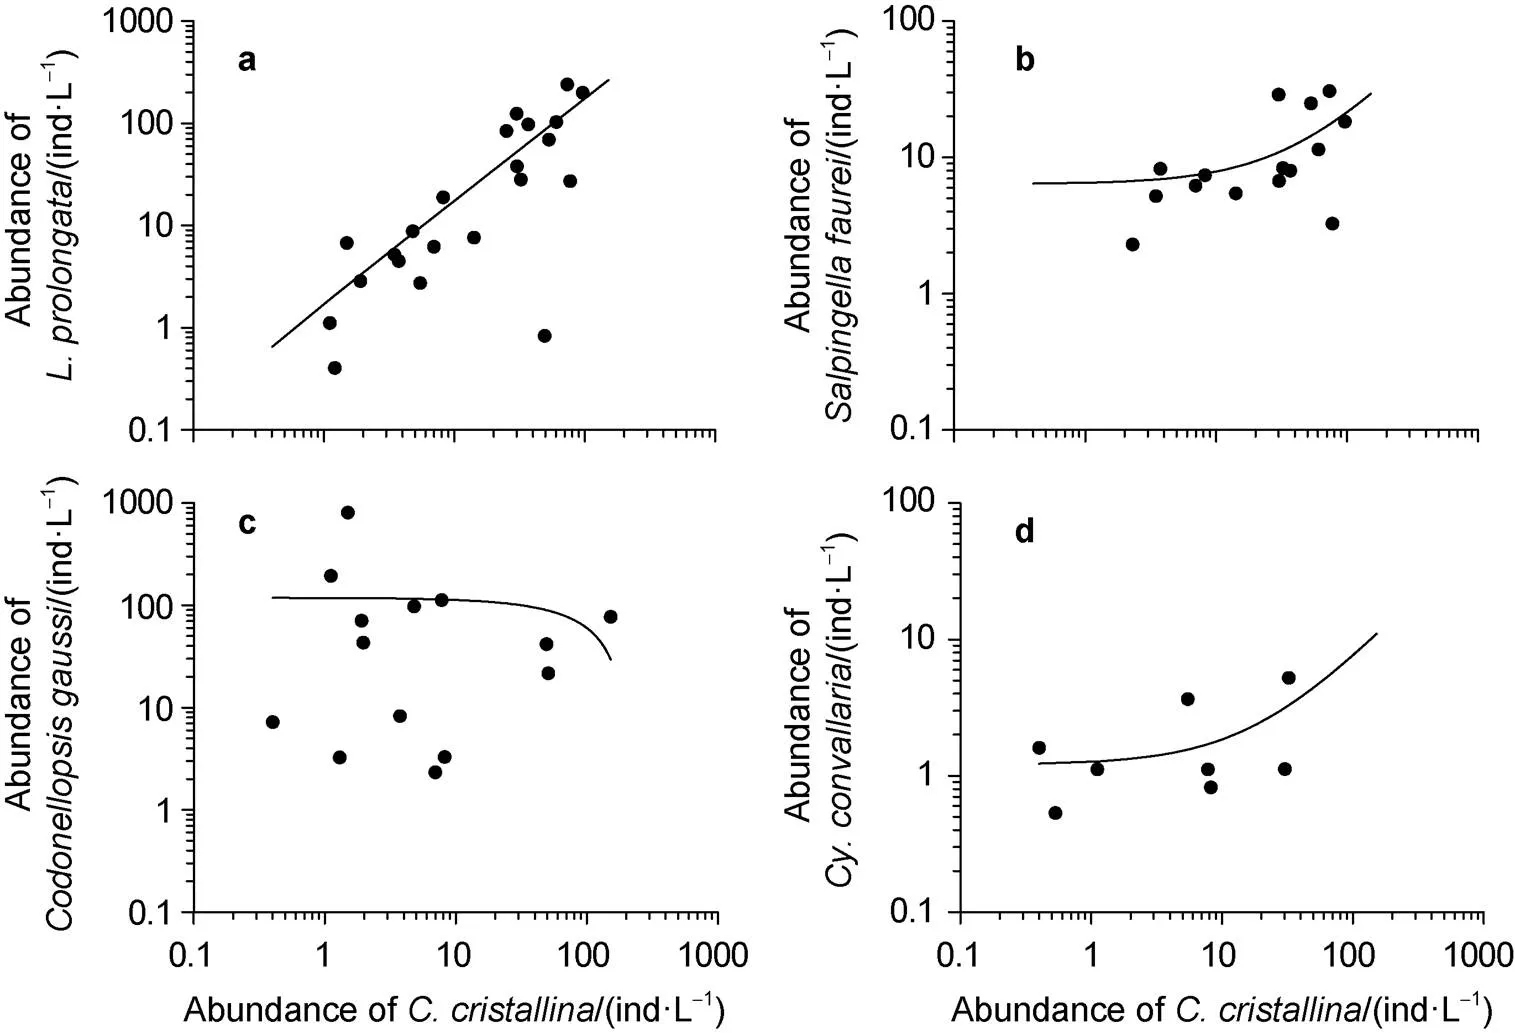
Figure 8 Relationship between abundance ofand(a),(b),(c) and(d).
Figure 9 Species richness and abundance proportion of tintinnid LOD size-classes in the Ross Sea and Amundsen Sea polynya.
Vertically,andwere mainly distributed in summer surface water ranging from the surface to a depth of 100 m.,,,andwere mainly distributed in winter water. A high abundance ofandoccurred in the upper 300 m depth.,andwere mainly distributed at depths deeper than 50 m (Liang et al., 2018). These findings may be the reason why,andwere found in low abundance in surface waters of the Ross Sea and Amundsen Sea polynya in our results. Further studies into vertical distribution of these species are needed.
4.2 Horizontal distribution of tintinnids in the Ross Sea and Amundsen Sea polynya
Previous studies have shown that,andwere dominant species in western and southern coastal areas of the Ross Sea (Monti and Fonda Umani, 1995; Fonda Umani et al., 2002, 2005). Our study areas covered the central, eastern, western and southern Ross Sea, and can provide a comprehensive understanding of tintinnid community structure in surface waters. During the summer of 1987/1988 and 1989/1990, Monti and Fonda Umani (1995) found that the genuswas abundant in the offshore stations, while the speciesand(equal to) were abundant in stations closer to the coast. Our results also showed thatwas abundant in stations closer to the coast. Other species, however, showed a different distribution tendency in our results, whereandwere abundant in offshore stations, andwas abundant in the stations closer to the coast. We speculate that the limited co-occurrence of these species in previous studies might have been due to the small sampling scales employed in previous studies.
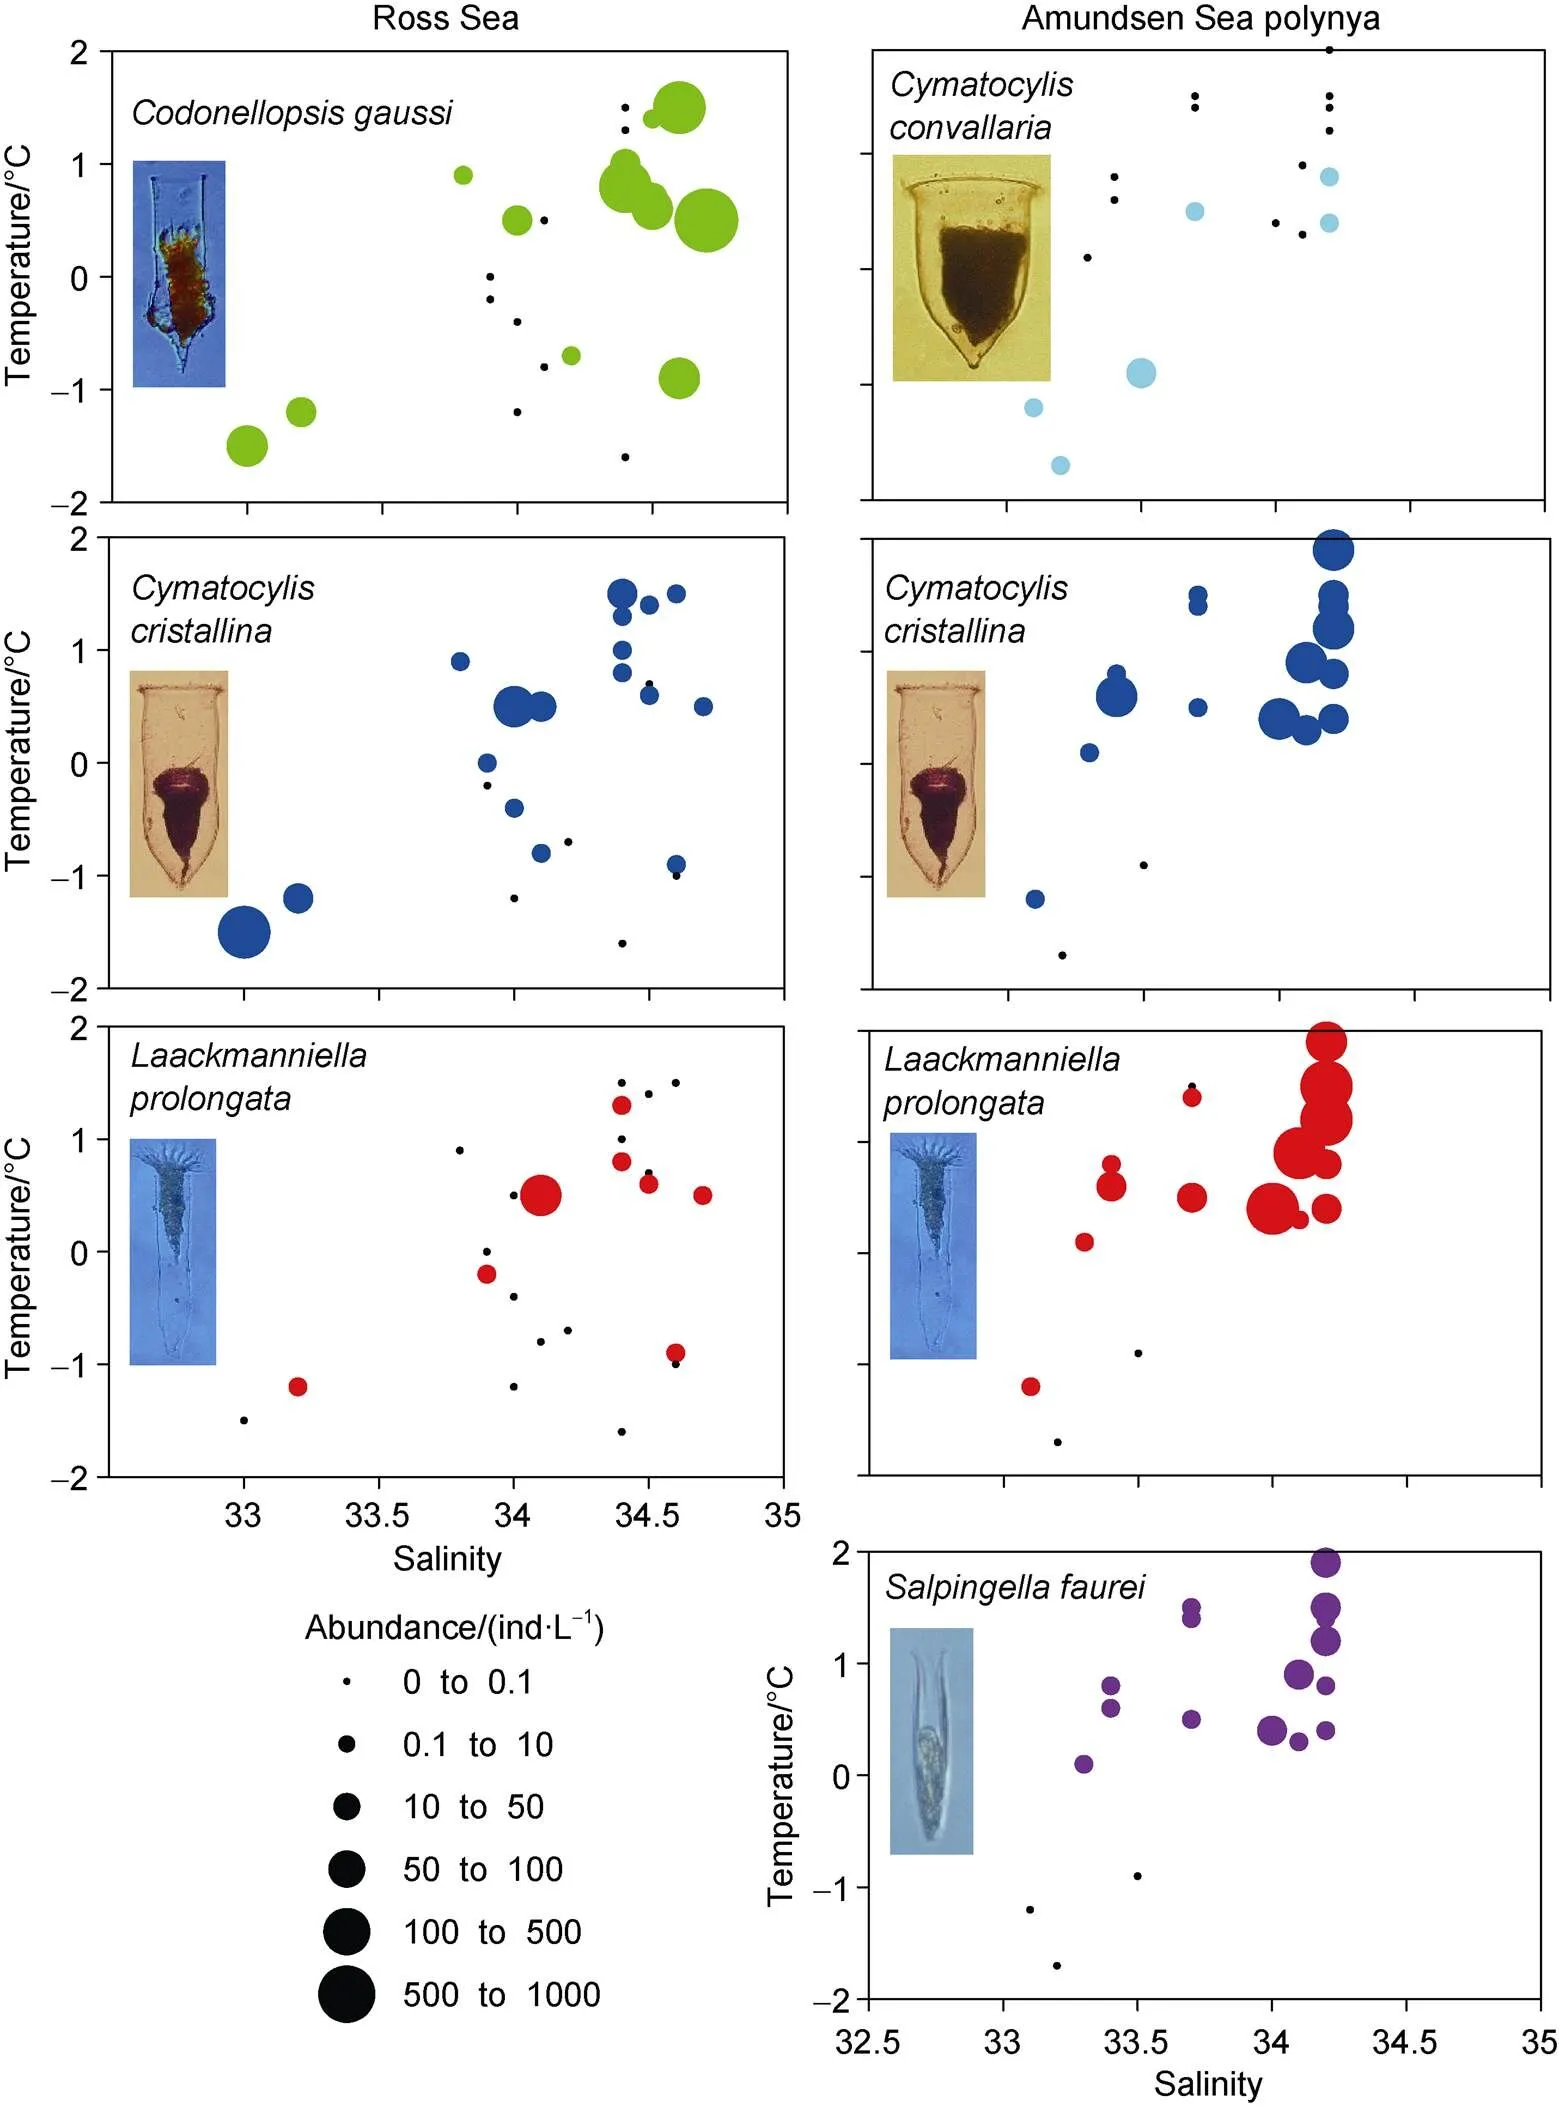
Figure 10 Temperature-salinity-plankton diagrams for dominant tintinnid andin the Ross Sea and Amundsen Sea polynya. Black dots represent sampling points where no species occurred.

Table 5 Spearman’s rank correlation between abundant tintinnid abundance and temperature, salinity and Chl a concentration
The Amundsen Sea is one of the most productive areas in the Southern Ocean (Smith et al., 2011; Arrigo and Alderkamp, 2012; Fragoso and Smith, 2012) and many coastal polynyas are found there. Our study area of Amundsen Sea polynya was similar to that of Dolan et al. (2013) and Jiang et al. (2014, 2016a, 2016b), who also studied a region of high productivity. A total of seven species was found during summer 2010/2011 and 2011/2012 (Dolan et al., 2013; Jiang et al., 2014, 2016a, 2016b). Of these studies, Dolan et al. (2013) definedandas polymorphic species and co-occurrence was found. Our study, however, founddistributed in offshore stations, and this species had no co-occurring relationship within the Amundsen Sea polynya. We also found that the co-occurrence ofandappeared to be similar to that reported by Liang et al. (2018, 2020). This phenomenon was similar to the “species group” proposed by Fager and McGowan (1963). Their positive correlation might have been because they had similar reactions to environmental properties.
4.3 Tintinnid assemblage variation
The prey size of tintinnids is related to their LOD and their preferred food particle size is approximately 25% of their LOD (Dolan et al., 2002; Dolan, 2010). The LOD is both a key ecological and taxonomic characteristic for tintinnids (Dolan and Pierce, 2012). No previous reports, however, have discussed tintinnid LOD distribution on a large scale in surface waters of the Ross Sea. In the present study, the dominant LOD size class in the Ross Sea was found to be 32–36 μm, which clearly differed from LOD composition in Amundsen Sea polynya (36–40 μm).
Previous studies have shown that Antarctic endemic species with larger LOD (> 100 μm) size classes had a higher abundance proportion on the southern side of the Polar Front (Dolan et al., 2012; Liang et al., 2020). Our results showed a similar phenomenon. Lee et al. (2012) reported that large-celled phytoplankton (> 20 μm, 64.1%) were dominant in the polynya near the Antarctic continent, and small-celled phytoplankton were mainly distributed northwards to the non-polynya area in the Amundsen Sea. Therefore, the higher abundance proportion of the large tintinnid LOD size class in the Amundsen Sea polynya may relate to the greater amount of large phytoplankton in this area.
Because of their widespread distribution, identifiable morphology and outer lorica protection, the use of tintinnid species as a valuable bioindicator of various oceanographic conditions has been suggested, such as a bioindicator for different water masses (Balech, 1972; Taniguchi, 1983; Kato and Taniguchi, 1993; Rakshit et al., 2017; Wang et al., 2021). Previous studies showed that three main currents occurred in surface waters of the Ross Sea (Williams et al., 2015; Thompson et al., 2018). Our results of high abundance and abundance proportion of loricae with protoplast between,andmight also indicate the boundary between the Antarctic Slope Front Current and Coastal Current in surface waters.
5 Conclusions
We report tintinnid species richness, horizontal distribution and relationship with environmental factors in the Ross Sea and Amundsen Sea polynya, Antarctic, during summer 2019/2020. Three distinctive tintinnid groups were classified according to cluster analysis. Among them, dominant species showed distinctive horizontal distribution characteristics. High abundance and abundance proportion of loricae with protoplast distribution area ofandmight can reveal approximate boundary of the Antarctic Slope Front Current and Coastal Current. Temperature – one element in the relationship between tintinnids and environmental factors – may be the main reason for tintinnid species distribution in surface waters. Our findings provide basic data and an approach that helps to explain increasing climate changes in Antarctic ecosystems.
Acknowledgements This research was financially supported by National Polar Special Program “Impact and Response of Antarctic Seas to Climate Change” (Grant no. IRASCC 01-02-01D), was funded by the China Postdoctoral Science Foundation (Grant no., 2020M672149) and the Applied Research Project for Postdoctoral in Qingdao. Special thanks to the captain, Bing Zhu and crew of R/Vfor their great help in sampling during the 36th Chinese National Antarctic Research Expedition. Special thanks to Dr. Mengyao Yang (Ocean University of China) for assisting data analysis. We greatly appreciate the constructive comments by three anonymous reviewers, and Guest Editor Dr. Jianfeng He, which dramatically improved the quality of the manuscript.
Alder V A. 1999. Tintinnoinea//Boltovskoy D (ed). South Atlantic zooplankton. Backhuys, Leiden, 321-384.
Anderson M J, Gorley R N, Clarke K R. 2008. PERMANOVA+ for PRIMER: Guide to Software and Statistical Methods. PRIMER-E, Plymouth, MA.
Arrigo K R, Alderkamp A C. 2012. Shedding dynamic light on Fe limitation (DynaLiFe). Deep Sea Res Part II Top Stud Oceanogr, 71-76: 1-4, doi:10.1016/j.dsr2.2012.03.004.
Arrigo K R, Lowry K E, van Dijken G L. 2012. Annual changes in sea ice and phytoplankton in polynyas of the Amundsen Sea, Antarctica. Deep Sea Res Part II Top Stud Oceanogr, 71-76: 5-15, doi:10.1016/j. dsr2.2012.03.006.
Arrigo K R, van Dijken G L. 2003. Phytoplankton dynamics within 37 Antarctic coastal polynya systems. J Geophys Res, 108(C8): 3271, doi:10.1029/2002jc001739.
Azam F, Fenchel T, Field J G, et al. 1983. The ecological role of water-column microbes in the sea. Mar Ecol Prog Ser, 10: 257-263, doi:10.3354/meps010257.
Balech E. 1972. Los tintinnidos indicadores de afloramientos de aguas (Ciliata). Physis, 31: 519-528.
Boltovskoy D, Dinofrio E O, Alder V A. 1990. Intraspecific variability in Antarctic tintinnids: the/species group. J Plankton Res, 12(2): 403-413, doi:10.1093/plankt/12.2.403.
Caccavo J A, Papetti C, Wetjen M, et al. 2018. Along-shelf connectivity and circumpolar gene flow in Antarctic silverfish (). Sci Rep, 8: 17856, doi:10.1038/s41598-018-36030-x.
Calbet A, Saiz E. 2005. The ciliate-copepod link in marine ecosystems. Aquat Microb Ecol, 38: 157-167, doi:10.3354/ame038157.
David P M. 1955. The distribution of, Ritter-Zahoney. Discov Rep, 27: 235-278.
Deacon G E R. 1982. Physical and biological zonation in the Southern Ocean. Deep Sea Res A Oceanogr Res Pap, 29(1): 1-15, doi:10.1016/0198-0149(82)90058-9.
Dolan J R. 2010. Morphology and ecology in tintinnid ciliates of the marine plankton: correlates of lorica dimensions. Acta Protozool, 49(3): 235-244.
Dolan J R, Claustre H, Carlotti F, et al. 2002. Microzooplankton diversity: relationships of tintinnid ciliates with resources, competitors and predators from the Atlantic Coast of Morocco to the Eastern Mediterranean. Deep Sea Res Part I Oceanogr Res Pap, 49(7): 1217-1232, doi:10.1016/S0967-0637(02)00021-3.
Dolan J R, Pierce R W. 2012. Diversity and distributions of tintinnid ciliates// Montagnes D J S, Agatha S, et al (Eds). The biology and ecology of tintinnid ciliates: models for marine plankton. Wiley-Blackwell, Oxford, 214-243. doi: 10.1002/9781118358092. ch10.
Dolan J R, Pierce R W, Yang E J, et al. 2012. Southern Ocean biogeography of tintinnid ciliates of the marine plankton. J Eukaryot Microbiol, 59(6): 511-519, doi:10.1111/j.1550-7408.2012.00646.x.
Dolan J R, Vidussi F, Claustre H. 1999. Planktonic ciliates in the Mediterranean Sea: longitudinal trends. Deep Sea Res Part I Oceanogr Res Pap, 46(12): 2025-2039, doi:10.1016/S0967-0637(99)00043-6.
Dolan J R, Yang E J, Lee S H, et al. 2013. Tintinnid ciliates of Amundsen Sea (Antarctica) plankton communities. Polar Res, 32(1): 19784, doi:10.3402/polar.v32i0.19784.
Fager E W, McGowan J A. 1963. Zooplankton species groups in the North Pacific. Science, 140(3566): 453-460, doi:10.1126/science.140.3566. 453.
Fonda Umani S, Accornero A, Budillon G, et al. 2002. Particulate matter and plankton dynamics in the Ross Sea Polynya of Terra Nova Bay during the Austral Summer 1997/98. J Mar Syst, 36(1-2): 29-49, doi:10.1016/S0924-7963(02)00133-1.
Fonda Umani S, Monti M, Bergamasco A, et al. 2005. Plankton community structure and dynamics versus physical structure from Terra Nova Bay to Ross Ice Shelf (Antarctica). J Mar Syst, 55(1-2): 31-46, doi:10.1016/j.jmarsys.2004.05.030.
Fonda Umani S, Monti M, Nuccio C. 1998. Microzooplankton biomass distribution in Terra Nova Bay, Ross Sea (Antarctica). J Mar Syst, 17(1-4): 289-303, doi:10.1016/S0924-7963(98)00044-X.
Fragoso G M, Smith Jr. W O. 2012. Influence of hydrography on phytoplankton distribution in the Amundsen and Ross Seas, Antarctica. J Mar Syst, 89(1): 19-29, doi:10.1016/j.jmarsys.2011.07.008.
Gómez F. 2007. Trends on the distribution of ciliates in the open Pacific Ocean. Acta Oecologica, 32(2): 188-202, doi:10.1016/j.actao.2007.04. 002.
Jacobs S S, Jenkins A, Giulivi C F, et al. 2011. Stronger circulation and increased melting under Pine Island Glacier ice shelf. Nat Geosci, 4(8): 519-523, doi:10.1038/ngeo1188.
Jiang Y, Liu Q, Yang E J, et al. 2016a. An approach to bioassess pelagic ciliate biodiversity at different taxonomic resolutions in response to various habitats in the Amundsen Sea (Antarctica). Polar Biol, 39(3): 485-495, doi:10.1007/s00300-015-1801-1.
Jiang Y, Liu Q, Yang E J, et al. 2016b. Pelagic ciliate communities within the Amundsen Sea polynya and adjacent sea ice zone, Antarctica. Deep Sea Res Part II Top Stud Oceanogr, 123: 69-77, doi:10.1016/j. dsr2.2015.04.015.
Jiang Y, Xu G, Xu H. 2016c. Use of multivariate dispersion to assess water quality based on species composition data. Environ Sci Pollut Res, 23(4): 3267-3272, doi: 10.1007/s11356-015-5583-3.
Jiang Y, Yang E J, Kim S Y, et al. 2014. Spatial patterns in pelagic ciliate community responses to various habitats in the Amundsen Sea (Antarctica). Prog Oceanogr, 128: 49-59, doi:10.1016/j.pocean. 2014. 08.006.
Kane J E. 1966. The distribution of(Guér) with observations on its life history in the 0° to 20°E sector of the Southern Ocean. Discov Rep, 34: 163-198.
Kato S, Taniguchi A. 1993. Tintinnid ciliates as indicator species of different water masses in the western North Pacific Polar Front. Fish Oceanogr, 2(3-4): 166-174, doi:10.1111/j.1365-2419.1993.tb00132.x.
Knap A H, Michaels A, Close A R, et al. 1996. Protocols for the Joint Global Ocean Flux Study (JGOFS) core measurements. JGOFS Rep, 19: 155-162.
Laackmann H. 1910. Die Tintinnodeen der deutschen Südpolar-Expedition 1901–1903. Dtsch Stüdpol Exped, 2: 341-496.
Lee S H, Kim B K, Yun M S, et al. 2012. Spatial distribution of phytoplankton productivity in the Amundsen Sea, Antarctica. Polar Biol, 35(11): 1721-1733, doi:10.1007/s00300-012-1220-5.
Liang C, Li H B, Dong Y, et al. 2018. Planktonic ciliates in different water masses in open waters near Prydz Bay (East Antarctica) during austral summer, with an emphasis on tintinnid assemblages. Polar Biol, 41(11): 2355-2371, doi: 10.1007/s00300-018-2375-5.
Liang C, Li H B, Zhang W C, et al. 2020. Changes in tintinnid assemblages from subantarctic zone to Antarctic zone along transect in Amundsen Sea (West Antarctica) in early austral autumn. J Ocean Univ China, 19(2): 339-350, doi:10.1007/s11802-020-4129-6.
Lynn D H. 2008. Ciliated protozoa: characterization, classification, and guide to the literature, third edition. Springer, Berlin, 1-455.
Monti M, Fonda Umani S. 1995. Tintinnids in Terra Nova Bay–Ross Sea during two austral summers (1987/88 and 1989/90). Acta Protozool, 34: 193-201.
Monti M, Fonda Umani S. 2000. Distribution of the main microzooplankton taxa in the Ross Sea (Antarctica): austral summer 1994//Faranda F M, Guglielmo L, Ianora A (eds). Ross Sea ecology. Springer, Berlin, Heidelberg, 275-289, doi:10.1007/978-3-642-59607- 0_22.
Monti M, Zoccarato L, Fonda Umani S. 2017. Microzooplankton composition under the sea ice and in the open waters in Terra Nova Bay (Antarctic). Polar Biol, 40(4): 891-901, doi:10.1007/s00300-016- 2016-9.
Paranjape M A, Gold K. 1982. Cultivation of marine pelagic protozoa. Ann Inst Oceanogr Paris, 58: 143-150.
Patmore R D, Holland P R, Munday D R, et al. 2019. Topographic control of Southern Ocean gyres and the Antarctic circumpolar current: a barotropic perspective. J Phys Oceanogr, 49(12): 3221-3244, doi:10. 1175/jpo-d-19-0083.1.
Payne A J, Holland P R, Shepherd A P, et al. 2007. Numerical modeling of ocean-ice interactions under Pine Island Bay’s ice shelf. J Geophys Res, 112(C10): C10019, doi:10.1029/2006JC003733.
Pierce R W, Turner J T. 1992. Ecology of planktonic ciliates in marine food webs. Rev Aquat Sci, 6: 139-181.
Rakshit D, Sahu G, Mohanty A K, et al. 2017. Bioindicator role of tintinnid (Protozoa: Ciliophora) for water quality monitoring in Kalpakkam, Tamil Nadu, south east coast of India. Mar Pollut Bull, 114(1): 134-143, doi:10.1016/j.marpolbul.2016.08.058.
Safi K A, Robinson K V, Hall J A, et al. 2012. Ross Sea deep-ocean and epipelagic microzooplankton during the summer-autumn transition period. Aquat Microb Ecol, 67(2): 123-137, doi:10.3354/ame01588.
Smith Jr. W O, Barber D G. 2007. Chapter 13 Polynyas and climate change: a view to the future. Elsevier Oceanogr Ser, 74: 411-419, doi:10.1016/S0422-9894(06)74013-2.
Smith J A, Hillenbrand C D, Kuhn G, et al. 2011. Deglacial history of the West Antarctic Ice Sheet in the western Amundsen Sea Embayment. Quat Sci Rev, 30(5-6): 488-505, doi:10.1016/j.quascirev.2010.11.020.
Stoecker D K, Michaels A E, Davis L H. 1987. Grazing by the jellyfish,, on microzooplankton. J Plankton Res, 9(5): 901-915, doi:10.1093/plankt/9.5.901.
Stoecker D K, Putt M, Moisan T. 1995. Nano- and microplankton dynamics during the springsp. bloom in McMurdo Sound, Antarctic. J Mar Biol Assoc UK, 75(4): 815-832, doi:10.1017/S002 5315400038170.
Taniguchi A. 1983. Microzooplankton distribution along a transverse section crossing a marked oceanic front. La Mer Bull Soc fianco-japon oceanogr, 21: 95-101.
Thompson A F, Stewart A L, Spence P, et al. 2018. The Antarctic slope current in a changing climate. Rev Geophys, 56(4): 741-770, doi:10.1029/2018rg000624.
Tomczak M, Godfrey J S. 1994. Regional oceanography: an introduction. Butler & Tanner, Great Britain.
Utermöhl H. 1958. Methods of collecting plankton for various purposes are discussed (Zur vervollkommnung der quantitativen phytoplankton-methodik). Mit Int Ver Theor Angew Limnol, 9(1): 1-38, doi:10.1080/05384680.1958. 11904091.
Wåhlin A K, Yuan X, Björk G, et al. 2010. Inflow of warm circumpolar deep water in the central Amundsen shelf. J Phys Oceanogr, 40(6): 1427-1434, doi:10.1175/2010jpo4431.1.
Walker D P, Brandon M A, Jenkins A, et al. 2007. Oceanic heat transport onto the Amundsen Sea shelf through a submarine glacial trough. Geophys Res Lett, 34(2): L02602, doi:10.1029/ 2006GL028154.
Wang C F, Xu M Q, Xuan J, et al. 2021. Impact of the warm eddy on planktonic ciliate, with an emphasis on tintinnids as bioindicator species. Ecol Indic, 133: 108441, doi: 10.1016/j.ecolind.2021.108441.
Williams M, Budillon G, Smith W, et al. 2015. Observation activities in the Ross Sea: Current and future national contributions to the Southern Ocean Observing System. SOOS Report Series, NO. 1, doi:10.5281/ zenodo.21169.
Xu Z L, Chen Y Q. 1989. Aggregated intensity of dominant species of zooplankton in autumn in the East China Sea and Yellow Sea. Chin J Ecol, 8(4): 13-15 (in Chinese with English abstract).
Yang E J, Lee Y, Lee S. 2019. Trophic interactions of micro- and mesozooplankton in the Amundsen Sea polynya and adjacent sea ice zone during austral late summer. Prog Oceanogr, 174: 117-130, doi:10.1016/j.pocean.2018.12.003.
Zhang W C, Feng M P, Yu Y, et al. 2012. An illustrated guide to contemporary tintinnids in the world. Beijing: Science Press, 1-499.
14 October 2021;
20 January 2022;
30 March 2022
10.13679/j.advps.2021.0049
, ORCID: 0000-0001-7534-8368, E-mail: wuchangzhang@qdio.ac.cn
: Wang C F , Xu Z Q, Li H B, et al.Horizontal distribution of tintinnids (Ciliophora) in surface waters of the Ross Sea and polynya in the Amundsen Sea (Antarctica) during summer 2019/2020. Adv Polar Sci, 2022, 33(1): 28-43,doi: 10.13679/j.advps.2021.0049
杂志排行
Advances in Polar Science的其它文章
- Foreword
- “Opinion Editorial” category attracts more attention
- One special issue will be published in late 2022
- Potential suitable sites for the calibration of Scientific Echo Sounder in the marginal seas around Antarctica
- Research on submesoscale eddy and front near the South Shetland Islands (Antarctic Peninsula) using seismic oceanography data
- Variability of size-fractionated phytoplankton standing stock in the Amundsen Sea during summer
