A comparison of sensitivity indices for tolerance design of a transmission mechanism
2022-07-20ZhenyuLIUHanchaoXUGuodongSAYufengLYUJianrongTAN
Zhen-yu LIU,Han-chao XU,Guo-dong SA,Yu-feng LYU,Jian-rong TAN
1State Key Laboratory of CAD&CG,Zhejiang University,Hangzhou 310027,China
2Ningbo Research Institute,Zhejiang University,Ningbo 315100,China
3School of Mechanical Engineering,Zhejiang University,Hangzhou 310027,China
4Polytechnic Institute,Zhejiang University,Hangzhou 310027,China
Abstract:Sensitivity analysis is used to quantify the contribution of the uncertainty of input variables to the uncertainty of systematic output responses.For tolerance design in manufacturing and assembly,sensitivity analysis is applied to help designers allocate tolerances optimally.However,different sensitivity indices derived from different sensitivity analysis methods will always lead to conflicting results.It is necessary to find a sensitivity index suitable for tolerance allocation to transmission mechanisms so that the sensitivity results can truly reflect the effects of tolerances on kinematic and dynamic performances.In this paper,a variety of sensitivity indices are investigated and compared based on hybrid simulation.Firstly,the hybrid simulation model of the crank-slider mechanism is established.Secondly,samples of the kinematic and dynamic responses of the mechanism with joint clearances and link length errors are obtained,and the surrogate model established using polynomial chaos expansion(PCE).Then,different sensitivity indices are calculated based on the PCE model and are further used to evaluate the effect of joint clearances and link length errors on the output response.Combined with the tolerance-cost function,the corresponding tolerance allocation schemes are obtained based on different sensitivity analysis results.Finally,the kinematic and dynamic responses of the mechanism adopting different tolerance allocation schemes are simulated,and the sensitivity index corresponding to the optimal response is determined as the most appropriate index.
Key words:Transmission mechanism;Sensitivity analysis;Tolerance allocation;Hybrid simulation;Polynomial chaos expansion(PCE)
1 Introduction
The kinematic and dynamic performances of a transmission mechanism are reflected by its displacement,speed,acceleration,and other data.For example,the vibration performance can be expressed as acceleration fluctuation.These performances of the transmission mechanism are significantly affected by the geometric errors of its parts.The motion stability of the transmission mechanism,such as the crank-slider mechanism,is seriously affected by geometric errors such as joint clearance and link length error.To ensure the comprehensive performance of the mechanism,tolerance design is necessary,which can reasonably control part geometric errors with low cost.
The existing dynamics studies of the mechanism with clearance mainly focus on the construction of contact models for the collision of kinematic pairs (Tian et al.,2018),including the continuous contact model (Haines,1980),the“separationcontact”two-state model (Dubowsky et al.,1987),the“contact-separation-collision”three-state model(Soong and Thompson,1990),and the combined model of massless link and spring damping(Seneviratne et al.,1996).These methods can numerically predict kinematic and dynamic performances,considering the clearance and length error.However,there are few studies on tolerance design aiming at optimizing the kinematic and dynamic performances of the transmission mechanism.More in-depth studies are needed.
Tolerance design includes tolerance specification,tolerance modeling,and computer-aided tolerance optimization design (Cai et al.,2004;Cao et al.,2006,2015).As one of the key steps in the tolerance design process,tolerance allocation has attracted much attention.For example,Lin et al.(2018)proposed a method for motion error analysis of a cycloidal pinion reducer considering manufacturing tolerances,and explored tolerance allocation and optimization using the Monte Carlo method;Dantan et al.(2008) proposed tooth contact analysis,Monte Carlo simulation,and a genetic algorithm for gear tolerance allocation to achieve optimal manufacturing cost;Liu et al.(2019)used the linear regression method to find the mapping relationship between the tolerance zone error of the motion axis and machining accuracy.They carried out a sensitivity analysis to obtain the contribution of the degree of tolerance to the machining accuracy,and finally achieved a reasonable tolerance allocation combined with the tolerance-cost function.
However,state-of-the-art tolerance allocation methods mainly focus on the geometric errors of products rather than their kinematic and dynamic performances,which are very important for the transmission mechanism.Moreover,the above methods are difficult to use to make reasonable performance-oriented tolerance allocation due to the nonlinearity of the kinematic and dynamic models of the transmission mechanism.
Sensitivity analysis provides a feasible way for the performance-oriented tolerance allocation of the transmission mechanism.It is used to quantify the contribution of input variable uncertainty to model output response uncertainty(Saltelli et al.,2008).It can determine the main error affecting the mechanism performance and can provide a theoretical basis for tolerance allocation.For example,Ziegler and Wartzack(2015) proposed a global sensitivity analysis method for convex hull-based tolerance technology to estimate the impact of single part tolerance on assembly clearance in a pin-hole connection.Abbiati et al.(2021)established a sensitivity analysis framework of hybrid simulation by using the Sobol method in the global sensitivity analysis method and obtained the sensitivity of a certain structure response,which reduced the number of experimental samples compared with the Monte Carlo method.Borgonovo et al.(2012) applied the moment independence method in the global sensitivity analysis method to the field of environmental science to evaluate the impact of input values on the model results.The advantage of the method is that its numerical estimation method reduces the calculation burden.Zhou (2019) used the information entropy method in the global sensitivity analysis method to evaluate the effect of each parameter on bolt stress.The advantage is that the output variable is allowed to be a multidimensional variable.
In the above studies,the sensitivity analysis has shown its value well,but the following problems remain:
(1) The above sensitivity analysis methods can be applied to a transmission mechanism;however,the results are not consistent in most cases.This is because these methods are different in principle,which leads to their different objects of application.For example,Borgonovo (2007) proposed a momentindependent method that can be defined in the presence of correlations among the inputs,whereas the Sobol method requires independent inputs.Therefore,it is necessary to find a sensitivity analysis method,suitable for the performance-oriented tolerance allocation of the transmission mechanism,which can truly reflect the effect of geometric errors on performance.
(2) For many complex nonlinear physical systems,the sensitivity index cannot be analytically solved and can only be estimated by a numerical method based on a sample.However,the sample size of physical experiments is always limited due to their high cost and to the inability to modify the size of parts,while the data obtained by simulation is time-consuming with low accuracy.Therefore,it is necessary to build a high-accuracy simulation model to obtain samples and then to calculate the sensitivity index quickly through surrogate model technology.
In this study,we proposed a comparison method of the sensitivity indices based on hybrid simulation,so as to determine the optimal sensitivity index that accurately reflects the impact of geometric errors on the kinematic and dynamic performances of the transmission mechanism as shown in Fig.1.Firstly,we established a hybrid simulation model including a real experiment platform and a simulation model,where the parameters of the simulation model were calibrated according to the experimental data.Secondly,the combined sample of clearance and link length was generated by a classic sampling method,Latin hypercube sampling (LHS),which can effectively improve the uniformity of sample points in design space.The corresponding kinematic and dynamic performances of the mechanism were calculated based on the hybrid simulation model performance.Then,the polynomial chaos expansion (PCE) method,a method that can effectively deal with system uncertainty caused by input random variables,was used to construct the surrogate model,and the sensitivity of the kinematic and dynamic performances of the machine to the joint clearance and link length errors was calculated based on the surrogate model.Finally,the tolerance was allocated according to the results of each sensitivity analysis method combined with the cost-tolerance function,and the sensitivity analysis method was determined by comparison.

Fig.1 Approach framework for comparing sensitivity indices based on the hybrid simulation model
This paper is organized as follows:Section 2 introduces four popular sensitivity indices;Section 3 shows the proposed hybrid simulation model in detail;Section 4 proposes the comparison method of sensitivity indices and gives detailed experimental results;Section 5 discusses the limitations of our study and how future work could be carried out;Section 6 summarizes the whole paper.
2 Introduction of sensitivity indices
The purpose of sensitivity analysis is to explore the distribution of model output uncertainty with respect to input uncertainty (Saltelli and Tarantola,2002).Considering that the experimental purpose is to research the sensitivity of the kinematic and dynamic performances of the crank-slider mechanism to errors of clearance and link length,this paper selects four of the popular sensitivity analysis methods for research and comparison,as follows:linear regression method,variance-based method,moment-independent method,and information-entropy method.
2.1 Linear regression method
Linear regression (Darlington and Hayes,2016)is a statistical analysis method that uses regression analysis in mathematical statistics to determine the quantitative relationship between two or more variables.Linear regression is a powerful tool determining relations among system outputyand input variablesX.It focuses on the first-order effects (the main effects)ofXony,and ignores the higher-order effects(the nonlinear effects).In most cases,the higher-order effects are much smaller than the first-order effects.Therefore,linear regression can be used not only for sensitivity analysis of linear models,but also for nonlinear models.
For a linear model,we assume that its expression is

whereyis the response value of the model,a0is the initial value,X={x1,x2,…,xk}is the set of input variables,andaiis the coefficient of each input variable.
The linear regression method first needs to experiment with the model.Randomly sampling the input variables gives a matrixMwith a sample space ofNrows andkcolumns.The responseyof each row of the matrixMis obtained experimentally and by getting anN-row output vectorY,whereNis the scale of the experiment and the number of rows of the matrixM.In theory,the larger the size ofN,the more accurate the prediction model.After obtaining much experimental data,we can carry out simple linear regression to obtain the expression of the prediction model:

whereb0andbiare calculated by the least square method according to the square difference between the linear regressionyand the experimentaly.It should be noted that due to errors in the experimental data,the prediction model is often different from the actual model,which is also the reason for usingb0andbi.To reduce this error,we can increase the size ofNor optimize the loss function.
The sensitivity ofytoxiis

2.2 Variance-based method
The Sobol method is a widely used sensitivity analysis method(Sobol,1993).It uses variance to describe the uncertainty between input variables and the output response of the model and considers the interactions between input variables.
For a model,we assume that its expression is

Assume that the spatial domain ofXisΩX.The input variables are independent of each other and follow a joint probability density function(PDF):

whereis the PDF ofxi.
The Sobol method holds that for any squareintegrable functiong(X),the function can be decomposed into the sum of its sub-terms:

whereg0is the expectation ofY,andgi,gij,andg12…kare the coefficients for each item.Eq.(6) can also be written as

whereu={i1,i2,…,is}⊂{1,2,…,k}are index sets,guis the coefficient of each item,andXuis a sub-vector ofX.In the above equation,the number of summation terms is 2k-1.
The Sobol decomposition is unique under the condition:

This condition means that the mean of each term is 0,which means that all the terms in the expansion are orthogonal to each other.Uniqueness and orthogonality allow the varianceDofYto be decomposed as follows:

whereDudenotes the partial variance:

Since the mean of each term in the expansion is 0,the variance of each term is the expectation of each term squared.The Sobol indexSuis

The first-order indexdescribes the effect of an input variablexi.The second-order indexdescribes the interactions of {xi,xj}.The higher-order sensitivity quantifies the interactions of more input variables.The total sensitivity indexrepresents the total effect of an input variablexiand explains the interaction between its main effect and all other input variables.Its expression is

whereS~iis the sum of allSuwithunot includingi.
There are mainly three methods to calculate Sobol indices:Monte Carlo simulation method(Sobol,2001),Fourier amplitude sensitivity test (Cukier et al.,1973),and proxy model method (Sudret,2008).The proxy model constructed by PCE can directly obtain Sobol indices and requires fewer samples than the Monte Carlo simulation method.
2.3 Moment-independent method
The moment-independent method (Borgonovo,2007)is a sensitivity analysis method based on probability distribution,which can reflect the effects of random variables on the entire probability distribution function of the output response.It can reflect the uncertainty of random variables more comprehensively.
Assuming thatXis a set ofkindependent input variables when each input variable obeys a certain distribution,its uncertainty will be passed to the output responseYthroughg(X),so thatYalso obeys a certain distribution.
The PDF and cumulative distribution function(CDF)ofYarefY(y)andFY(y).Whenxiis a definitethe conditional PDF and the conditional CDF ofYcan be expressed asandFig.2 shows the curves of the above functions.
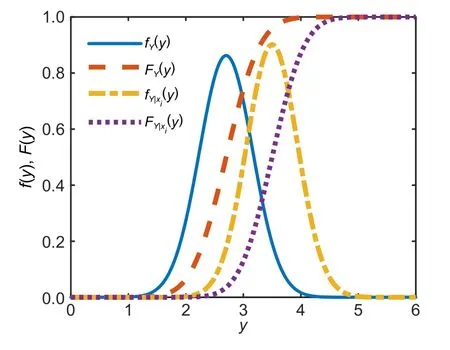
Fig.2 Unconditional and conditional CDF and PDF for Y
Whenxiisthe area difference offY(y)can be expressed as


The moment-independent sensitivity index based on a PDF is

wheredivided by two is for normalization.
2.4 Information-entropy method
Information-entropy(Shannon,1948)is a concept in information theory describing the degree of uncertainty of information sources,and is deduced from the definition of entropy in thermodynamics.It can represent the disorder degree of the system.The greater the entropy is,the more chaotic the system is,which makes prediction more difficult.When the entropy is zero,the system eliminates the effects of uncertain factors,and the output is a deterministic result.The information-entropy method is a new global sensitivity analysis method,which uses the change of entropy to predict the importance of input variables to output response.
The output responseYof the model is divided into one and multi-dimensional vectors,and there are two types:continuous and discrete.WhenYis a 1D continuous variable,its spatial domain isΩY,its PDF isfY(y),and the information entropy ofYcan be expressed as

whereris the base of the logarithm function,generally not less than 2.


The largerSxiis,the greater the change of information entropy ofYwill be after the uncertainty ofxiis eliminated,which indicates that the sensitivity ofYtoXis higher.
3 Hybrid simulation model enhanced by measured data
In this section,we propose a hybrid simulation model of a crank-slider mechanism.Limited physical experiment data was used to support the verification and calibration of the simulation model,which could guarantee its accuracy.
3.1 Crank-slider experiment platform
The crank-slider experiment platform is composed of an actuator,a motor drive device,and a data acquisition (DAQ) system.The actuator includes a crank disc,connecting rod,slider,connecting shaft,and other supporting parts.A rigid connection is adopted between the experimental platform and the experimental table.The experimental platform is shown in Fig.3,and the schematic plot of the experimental platform is shown in Fig.4.

Fig.3 Crank-slider experiment platform

Fig.4 Schematic plot of the experimental platform
The DAQ system includes a pull rod displacement sensor and a triaxial acceleration sensor.The displacement sensor sends the displacement information of the slider to the DAQ card by voltage,and then the data is transmitted to the computer at a certain sampling frequency by the DAQ card.The voltage signal of the acceleration sensor is small and easily interfered with,so a constant current adapter is installed between it and the DAQ card to filter and amplify the signal.Displacement data and acceleration data can be converted into velocity data by differential and integral processing respectively,and they can be cross-verified to improve the reliability of experimental data.Each device is shown in Fig.5.

Fig.5 DAQ system:(a)displacement sensor;(b)acceleration sensor;(c)constant current adapter;(d)DAQ card
The crank-slider mechanism has a fixed crank length,connecting rod length,and aperture size at both ends of the connecting rod.By changing the connecting shaft with different diameters,impact dynamics experiments under different gaps were carried out,and the kinematic and dynamic performances of the mechanism were obtained.The clearance between the connecting shaft and the connecting rod is shown in Fig.6,and the dimension parameters are shown in Fig.7.

Fig.6 Radius clearance (ΔR) between the connecting shaft and connecting rod:(a)ΔR=0.0 mm;(b)ΔR=0.2 mm;(c)ΔR=0.6 mm;(d)ΔR=1.0 mm
In Fig.7,half the difference between the left aperture of the connecting rodHLand the left connecting shaft diameterSLis the radius clearance ΔRL,and half the difference between the right aperture of the connecting rodHRand the right connecting shaft diameterSRis the radius clearance ΔRR.That is because,when there is clearance at both ends of the connecting rod,the connecting rod lacks axial fixing,so only one end of the test is allowed to have clearance,and the other end is axially fixed by a rolling bearing,where the clearance is approximately zero.The three connection modes in the experiments are shown in Fig.8.

Fig.7 Dimension parameters of the crank-slider mechanism parts (LL is the length of the crank,and LR the length of the connecting rod)
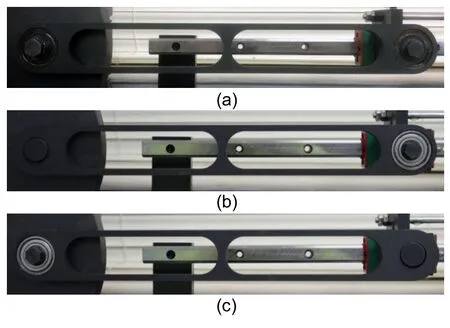
Fig.8 Three connection modes in the experiments:(a) no joint clearance at both ends;(b)joint clearance on the left;(c)joint clearance on the right
Through different combinations,the experimental data of the crank-slider mechanism with different joint clearances at various speeds can be obtained by this experimental platform,which contains 40 samples.Some specific parameters are shown in Table 1.

Table 1 Experimental parameters
Experimental data corresponding to each parameter and reflecting the kinematic and dynamic performances of the mechanism were obtained.Partial experimental results are shown in Figs.9 and 10.

Fig.9 Experimental slider displacement data
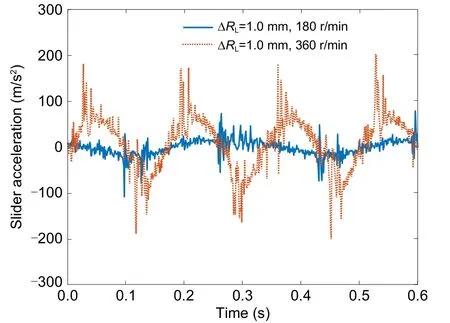
Fig.10 Experimental slider acceleration data
Based on all the experimental data,several facts were observed:
(1) With the increase of the joint clearance,the deviation of the slider displacement curve near the motion pole of the mechanism increases.
(2) The acceleration curve of the slider shows significant oscillation near the pole position of the mechanism,and the larger the joint clearance is,the larger the oscillation amplitude is.
(3) Under the same joint clearance,the higher the motor speed,the greater the oscillation amplitude of the slider acceleration curve near the pole position of the mechanism.
(4) Compared to the acceleration of the slider,the joint clearance has little effect on the displacement of the slider.
Therefore,the joint clearance indeed seriously affects the dynamic performance,and the variance of the slider acceleration data is considered as the output response to reflect the kinematic and dynamic performances of the mechanism.
3.2 Simulation model enhanced by physical experiment
To establish the simulation model of the crankslider mechanism and obtain the acceleration data of the slider,we used MSC ADAMS to simulate the mechanism.The functions of MSC ADAMS are focused on the modeling,analysis,and optimization of multi-body mechanical systems (Ambaye and Lemu,2021),which can be used to predict the performances of mechanical systems,motion range,and collision detection.The simulation model of the no-clearance crank-slider mechanism is shown in Fig.11.

Fig.11 Simulation model of the ideal crank-slider mechanism
The geometric and material parameters of the simulation model are the same as those of the real model.To extract the variance reflecting the fluctuation degree of the slider acceleration,it is necessary to first obtain the slider acceleration data under the ideal no-clearance condition.Simulation and experimental data for the no-clearance acceleration at four different speeds are shown in Fig.12.
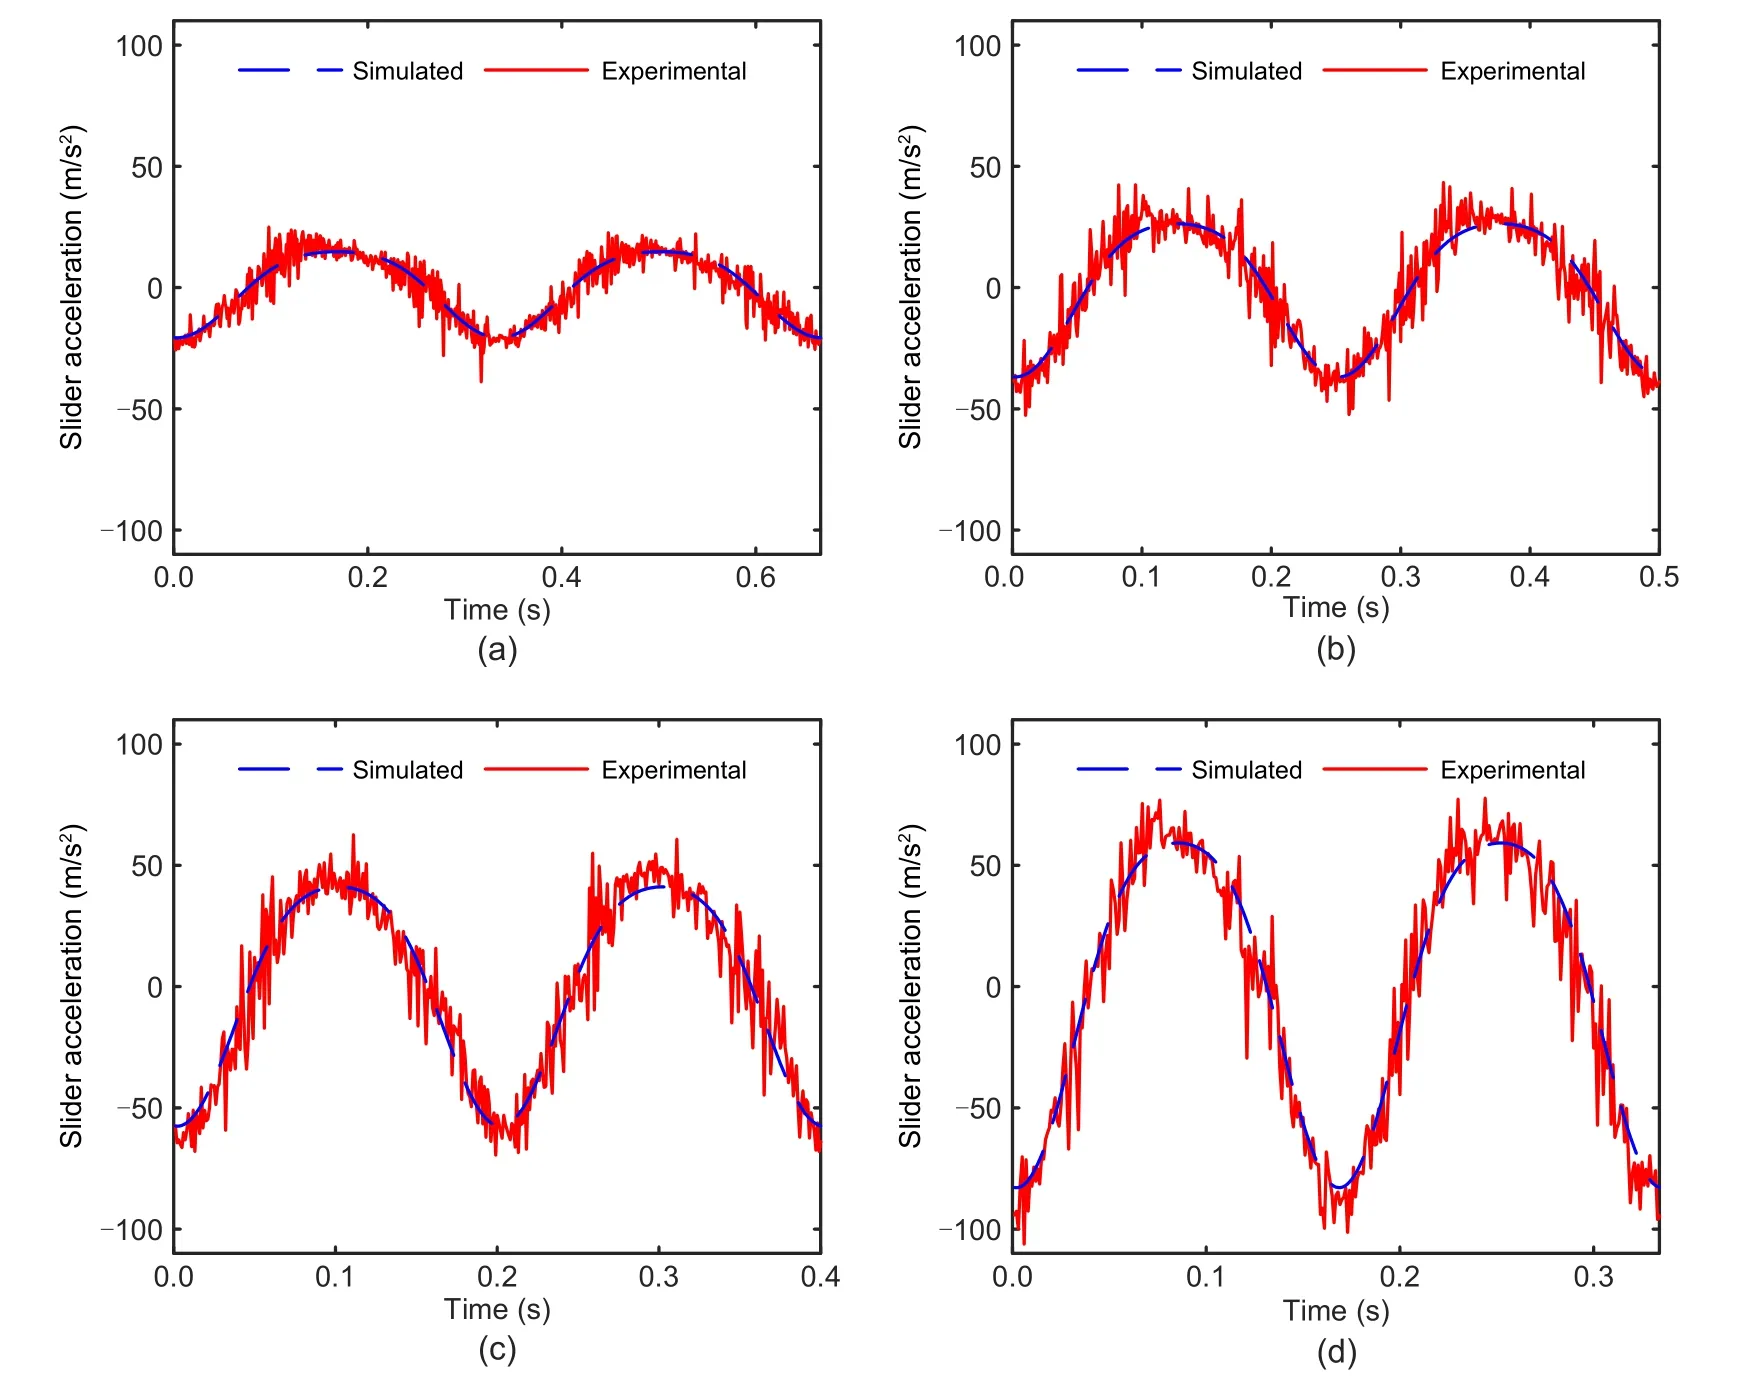
Fig.12 Simulated and experimental slider acceleration data under the no-clearance condition at four different speeds:(a)180 r/min;(b)240 r/min;(c)300 r/min;(d)360 r/min
Secondly,the acceleration performance of the slider is mainly related to the impact at the joint clearance.To make the simulation model reflect the collision situation of the physical model,it is very important to set the contact parameters reasonably.In MSC ADAMS,the parameters affecting contact collision include stiffness,force exponent,damping,and penetration depth.We used the method of comparison with the experimental platform data,took the acceleration as the measurement index,constantly adjusted these four parameters,and finally got a reasonable parameter.By changing the clearance and speed of the simulation model,the same experiment as the experimental platform was carried out,and 40 sets of simulation data were obtained.The simulation results were compared with the experimental platform data,and part of the comparison is shown in Fig.13.
According to Fig.13,the simulation data are in good agreement with the physical experiment data.To quantify the accuracy of the simulation data,the variance of the difference between the simulation acceleration data and the ideal no-clearance acceleration data and the variance of the difference between the experimental acceleration data and the ideal no-clearance acceleration data were calculated.The magnitude of the variance reflects the fluctuation degree of the slider acceleration.Some calculated values are shown in Table 2.

Fig.13 Comparison of simulation and experimental data on slider acceleration:(a)ΔRL=0.2 mm,180 r/min;(b)ΔRR=1.0 mm,240 r/min;(c)ΔRL=0.8 mm,300 r/min;(d)ΔRL=0.4 mm,360 r/min
The calculated results were classified according to the speed,and the average errors between simulation variance and experimental variance at 180,240,300,and 360 r/min are 9.86%,11.86%,7.98%,and 9.55%,respectively.Analysis shows that at all four different speeds,the best speed for the simulation model to simulate the kinematic and dynamic performances of the crank-slider mechanism is 300 r/min.
3.3 Random sampling of input variables
For the hybrid simulation model of the crankslider mechanism,its input variables include ΔRL,ΔRR,the length of the crankLL,and the length of the connecting rodLR(Fig.7).According to the central limit theorem,when the number of samples is large,the sum of multiple random variables obeying arbitrary distribution tends to a normal distribution.Therefore,random variables in engineering are often assumed to obey normal distribution.We assume that each input variable is a random number that obeys a normal distribution in each tolerance zone or limit clearance.
The range of tolerance zone and limit clearance increases with the reduction of tolerance class.To maximize the scope of the experiment and provide more comprehensive experimental data,we selected the tolerance grade of IT12.The value range and normal distribution of each input variable are shown in Table 3.
The normal distribution of each input variable was determined and random sampling was carried out.The PCE surrogate model requires fewer sample data and,among the existing sampling methods,LHS(McKay et al.,2000)has the advantages of both Monte Carlo random sampling and stratified sampling.The LHS method ensures the uniformity of a small number of samples and is one of the best small sample simulation methods (Helton and Davis,2003).Therefore,the LHS method was used to sample input variables and obtain 100 groups of sample data,some of which are shown in Table 4.

Table 2 Comparison among simulation,experiment,and ideal data

Table 3 Value range and normal distribution of each input variable

Table 4 Partial random sampling data
3.4 Experiment based on the hybrid simulation model
The hybrid simulation model is a simulation model obtained through the verification and calibration of physical experimental data,as shown in Fig.14.

Fig.14 Hybrid simulation model of the crank-slider mechanism
The simulation effect of this model was better at 300 r/min,so the experiment was carried out at this speed.One hundred sets of sample data were input to obtain the slider acceleration data of five cycles in the process of uniform rotation of the corresponding hybrid simulation model.After subtracting them from the acceleration data of the slider of the ideal no-clearance mechanism at the same speed,the variance of the difference value was obtained to reflect the kinematic and dynamic performances of the mechanism.The corresponding variance of each sample is shown in Fig.15.

Fig.15 Variance data of slider acceleration based on the hybrid simulation model
4 Comparison method of sensitivity indices based on PCE surrogate model
The purpose of sensitivity analysis is to guide tolerance allocation and satisfy kinematic and dynamic performances.Therefore,we defined the basis for evaluating the sensitivity indices by whether the tolerance scheme guided by each sensitivity could better meet the performance requirements.We also proposed a comparison method of sensitivity indices for kinematic and dynamic performances.Firstly,the sensitivity indices were calculated based on the PCE surrogate model,which was built based on the experimental data of the hybrid simulation model.Secondly,using the constraint function of cost-tolerance,the tolerance allocation scheme corresponding to each sensitivity index was solved according to the sensitivity results.Finally,each tolerance scheme was imported into the hybrid simulation model and the corresponding kinematic and dynamic performances were compared to determine the best sensitivity index for the transmission mechanism.
4.1 Surrogate model based on the PCE method
The PCE method is a very effective analysis method based on random uncertainty.It arises from the theory of the Wiener homogeneous function (Wiener,1938;Wiener and Teichmann,1959).
The PCE method can be roughly divided into two steps:
(1)Construction of the PCE model.The input and output random variables are expressed as weighted linear combinations of a set of orthogonal polynomial basis functions.
(2)Calculation of the PCE coefficient.The weights of each orthogonal polynomial basis function are calculated.
We used the non-interference polynomial chaos expansion (NIPCE) method (Acharjee and Zabaras,2007) of the PCE method to establish the surrogate model,which is widely used in engineering problems.For NIPCE,the PCE coefficient can be obtained by the stochastic response surface method (SRSM)(Isukapalli,1999;Isukapalli et al.,2000).
The PCE surrogate model was built based on the experimental data of the hybrid simulation model.The specific process is as follows:
(1) The PCE model was constructed according to the mathematical model.Appropriate orthogonal polynomial basis functions were selected and combined according to the rules.The specific form depended on the set order.
(2) The PCE coefficient was calculated by the SRSM.We input 100 groups of sample data,including input variable values and output variance values.Part of the sample data was used for the PCE coefficient calculation,and the number of groups required also depended on the set order,while the other part of the sample data was used for model testing.
(3)The obtained PCE surrogate model was used to calculate the output variance corresponding to the original 100 groups of input variables,and the percentage error and standard error (RMSE) between the original variance and the output variance were calculated.The different-order PCE surrogate models were evaluated,and the third-order one was the optimal order.The percentage error in the third order is shown in Fig.16.

Fig.16 Approximation error of the PCE surrogate model
Furthermore,the RMSE of the third-order PCE is 1.132.It was proved that this model could effectively restore the numerical relationship between output variance and input variables in the hybrid simulation model.
4.2 Sensitivity calculation based on the PCE model
For the above four sensitivity indices,the PCE surrogate model is used to obtain the output response corresponding to specific input variables,so as to calculate their sensitivity.The specific process is as follows:
(1)Linear regression method
The PCE surrogate model is used to expand the sample size,and linear regression calculation is performed directly to obtain the expression as follows:

whereyis the difference variance,x1is the value of ΔRL,x2is the value of ΔRR,x3is the value ofLL,x4is the value ofLR,and their units are all mm.
In this expression,the coefficients ofx2andx4are negative,which is inconsistent with the actual situation of the model.Using multiple groups of sample sizes to re-calculate the linear regression,the obtained expression resembles the above.This model is not linear,and its higher-order effects are large enough that linear regression cannot be used to calculate the sensitivity of its output response to its input variables.
(2)Sobol method
The Sobol method is used to calculate the firstorder sensitivity of the variance of the slider acceleration difference,which reflects the kinematic and dynamic performances of the mechanism,to each input variable(Saltelli et al.,2008).The calculation method is as follows:set two input sample matricesAandBwith the same sizeN;takeBas the original matrix and replace theith column with theith column ofAto get matrixC;the corresponding output response column vectorsyA,yB,andyCiof each input sample matrix are obtained.The first-order sensitivity index can be calculated by

where

The convergence value is shown in Fig.17 as the sample size changes.

Fig.17 First-order Sobol sensitivity indices
(3)Moment-independence method
The PCE surrogate model is used to calculate the output response corresponding to a specific input sample.Eqs.(13)-(15) are used to calculate the momentindependent sensitivity indexS(PDF)ibased on the PDF.The convergence value is obtained by changing the sample size,as shown in Fig.18.
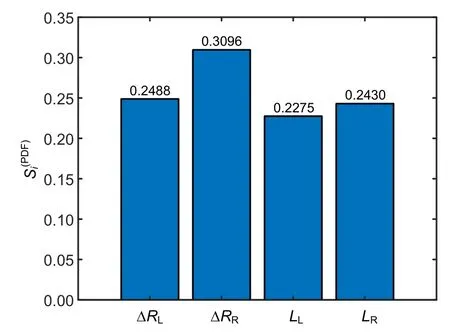
Fig.18 Moment-independent sensitivity indices
(4)Information-entropy method
The method of information-entropy is like the method of moment-independence.Eqs.(16)-(18) are used to calculate the global sensitivity indexSxiof information-entropy.The convergence value is obtained by changing the sample size,as shown in Fig.19.

Fig.19 Information-entropy sensitivity indices
4.3 Tolerance allocation based on the sensitivity
In this study,sensitivity and cost-tolerance functions are combined to allocate tolerance.Given a total cost value,the cost was allocated according to the proportional relationship between the sensitivity indices of the input variables.Then,the tolerance range of each mechanism part size corresponding to the input variable was calculated by combining the cost-tolerance functions.The tolerance allocation scheme corresponding to each sensitivity index was obtained.
The cost-tolerance function (Mo et al.,2011)used is as follows:
(1) Machine cost-tolerance model of the outer circle feature size:whereTis the dimensional tolerance,and its unit is mm.

(2) Machine cost-tolerance model for locating feature size:

We assume that the total cost is 5,and the reasons are as follows:the input samples of the hybrid simulation model are sampled based on the tolerance grade of IT12,so the tolerance allocation should be within this tolerance grade,and the fit limit clearance of connecting shaft in tolerance grade of IT12 is 0.42 mm;the tolerance allocation is determined by the cost allocation,which is based on the sensitivity index,and the sensitivity index of each mechanism part is not very different.The tolerance cost and tolerance range of each mechanism part size of the mechanism corresponding to the input variables are shown in Table 5.
4.4 Comparison of sensitivity indices based on kinematic and dynamic performances
Based on obtaining the tolerance scheme of each sensitivity index,it was assumed that the size of parts obeys normal distribution within the tolerance range.The LHS method was used to sample each part size,and the sample size of each tolerance scheme was 40 groups.The sample data were input into the hybrid simulation model in turn,and the slider acceleration data of two cycles at 300 r/min were obtained.Summary data of slider acceleration corresponding to each sensitivity index are shown in Figs.20-22.
After subtracting each acceleration term from the acceleration degree of the slider of the ideal nonclearance mechanism at the same speed,the variance of the difference value is obtained.Each sensitivity index has 40 variances,the average of which is shown in Table 6.

Table 5 Tolerance cost and tolerance range of each mechanism part size

Fig.21 Slider acceleration data based on the momentindependence index

Fig.22 Slider acceleration data based on the informationentropy index

Table 6 Sensitivity indices corresponding to the mean-variance
The curve in Fig.20 is more concentrated near the ideal curve than those in Figs.21 and 22.Among all the mean-variance of sensitivity indices,the meanvariance of the Sobol index is the smallest.Therefore,it can be considered that the Sobol index is the most appropriate sensitivity index for the transmission mechanism.When the researcher allocates tolerances to the transmission mechanism,the Sobol sensitivity analysis method can be used to assist the tolerance design,which can help the researcher determine the main effect of each input variable on the output response and optimize the kinematic and dynamic performances of the transmission mechanism.

Fig.20 Slider acceleration data based on the Sobol index
5 Discussion
Compared with the other sensitivity analysis methods in this study,the Sobol sensitivity analysis method can better optimize the kinematic and dynamic performances of the crank-slider mechanism for tolerance allocation because the first-order Sobol index can effectively extract the main effect of each input variable in the nonlinear model on the response,but not the total effect.This is very important for sensitivity analysis of complex models such as transmission mechanisms because the total effect of each input variable on the response includes redundancy.The more complex the model is,the more attention should be paid to the redundancy,which will enlarge the effects of some input variables on the model response.
By comparing Figs.17-19,it can be found that in the first-order Sobol index,the joint clearance ΔRRhas the largest proportion of sensitivity,while in the information-entropy index,ΔRRhas the smallest proportion of sensitivity.Therefore,the first-order Sobol index is more reasonable,because the slider is jointed with the right end of the connecting rod,where ΔRRhas the greatest effect on the kinematic and dynamic characteristics of the slider.What makes Fig.19 so unusual is that it over calculates the total effects of some input variables on the model response.
Although this study is based on the comparative study of sensitivity analysis methods of typical transmission mechanisms,the best sensitivity analysis method obtained by comparison is not suitable for all transmission mechanisms.This is because the kinematic and dynamic performances of the transmission mechanism are affected by the transmission type,and the Sobol method has requirements for independent inputs,which not all transmission mechanisms can meet.However,when the transmission form studied by the researcher resembles the crank-slider mechanism,this research is of value.At the same time,this study also points out the necessity for researchers to consider the total effect redundancy when performing sensitivity analysis on complex mechanisms.
In future research,we will propose a new sensitivity index,which will be suitable for more types of transmission mechanism and can be used in the presence of correlations among the inputs.
6 Conclusions
The kinematic and dynamic performances of the transmission mechanism are significantly affected by the geometric errors of the parts,and the tolerance design can make a reasonable geometric errors allocation of the parts while controlling the production cost.In this study,the crank-slider mechanism was used as the research object.Based on the proposed hybrid simulation model,the optimal sensitivity index for the transmission mechanism was determined by comparing multiple sensitivity indices and helped to achieve better tolerance design by assisting tolerance allocation.
(1) A hybrid simulation model was established based on the experimental data of the crank-slider experiment platform.The accuracy and reliability of simulation data are ensured when the experiment cost is reduced and the input variables are freely controlled.
(2)Based on the experimental data of the hybrid simulation model,a surrogate model based on the PCE method was established for the sensitivity calculation.It simplifies the calculation significantly.
(3)The tolerance was allocated based on the sensitivity and cost-tolerance function,and the tolerance scheme corresponding to each sensitivity index was obtained.Based on the kinematic and dynamic performances of the mechanism of each tolerance scheme,a new sensitivity evaluation method with engineering value is proposed.
Acknowledgments
This work is supported by the National Natural Science Foundation of China (Nos.52075480 and 52105279),the High-Level Talent Special Support Plan of Zhejiang Province(No.2020R52004),and the Ningbo Natural Science Foundation(No.2021J163),China.
Author contributions
Zhen-yu LIU designed the research.Han-chao XU and Guo-dong SA processed the experimental and simulation data.Guo-dong SA was in charge of the whole project.Yu-feng LYU assisted with the sampling and laboratory analyses.Jianrong TAN gave theoretical guidance on the whole work.
Conflict of interest
Zhen-yu LIU,Han-chao XU,Guo-dong SA,Yu-feng LYU,and Jian-rong TAN declare that they have no conflict of interest.
杂志排行
Journal of Zhejiang University-Science A(Applied Physics & Engineering)的其它文章
- Review of elemental mercury(Hg0)removal by CuO-based materials
- Coordinated deformation control technologies for the high sidewallbottom transfixion zone of large underground hydro-powerhouses
- Numerical analysis of the influence of a river on tunnelling-induced ground deformation in soft soil
- Free-standing MXene/chitosan/Cu2O electrode:an enzyme-free and efficient biosensor for simultaneous determination of glucose and cholesterol
