CHALCO And China Geological Survey Entered into Strategic Cooperation Agreement
2022-07-01
CHALCO And China Geological Survey Entered into Strategic Cooperation Agreement
In late April, CHALCO and China Geological Survey entered into strategic cooperation agreement in the headquarter of CHALCO. Board Chairman of CHALCO, Yaolin, and Director of China Geological Survey, Zhong Ziran witnessed the signing ceremony, and discussed with each other about co-improving resource support capability and achieving common development and win-win benefit.
According to the agreement, the both parties will focus on strategic mineral resources that are badly needed by our country, and give full play to professional and technical advantages of China Geological Survey and nonferrous whole industry chain advantages of CHALCO to cooperate with each other for a new round of strategic ore prospecting, and for the exploration and construction of a new prospecting mechanism characterized by combining public-welfare geological survey team and domestic and overseas mineral resources of big state-owned mining company. The both parties will also be dedicated to promoting information exchange and achievement transformation, and sharing with each other the achievements of domestic and overseas geological survey and mining development. The both parties are devoted to supporting and guaranteeing national energy resources.
In the forum, the both parties discussed a new round of strategic ore prospecting outline, international ore investment and cooperation, and CHALCO Group’s ore prospecting scheme.
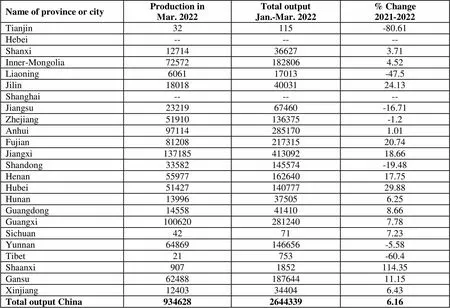
Refined Copper Production by Province or City in 2022 Unit: metric ton
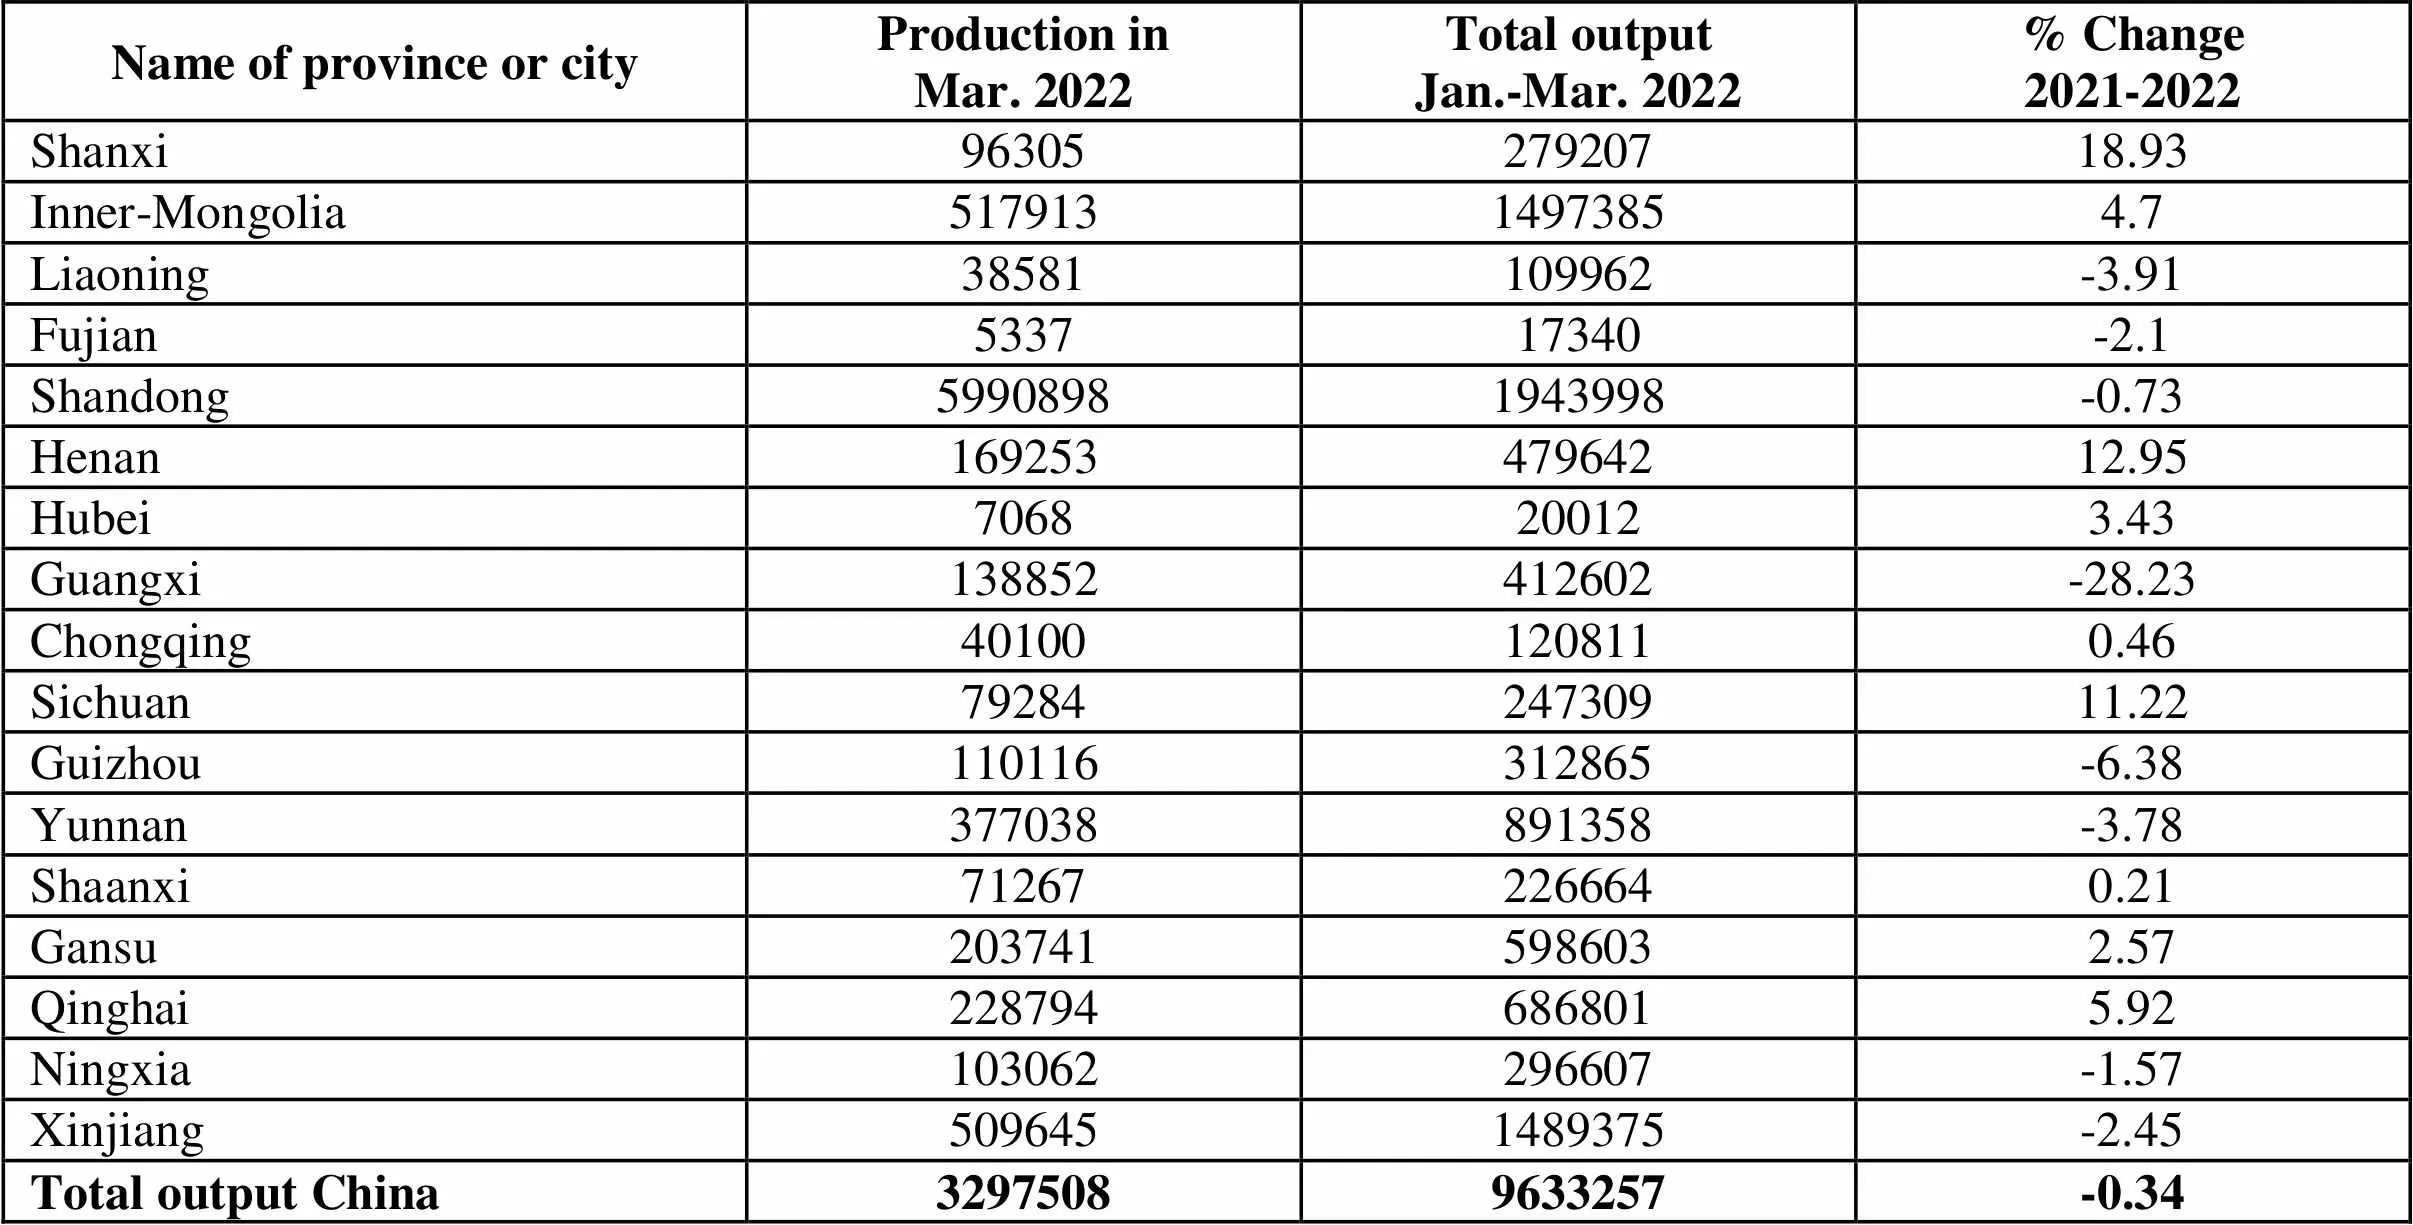
Aluminium Production by Province or City in 2022 Unit: metric ton

Production of the Ten Major Nonferrous Metals in 2022 Unit: metric ton
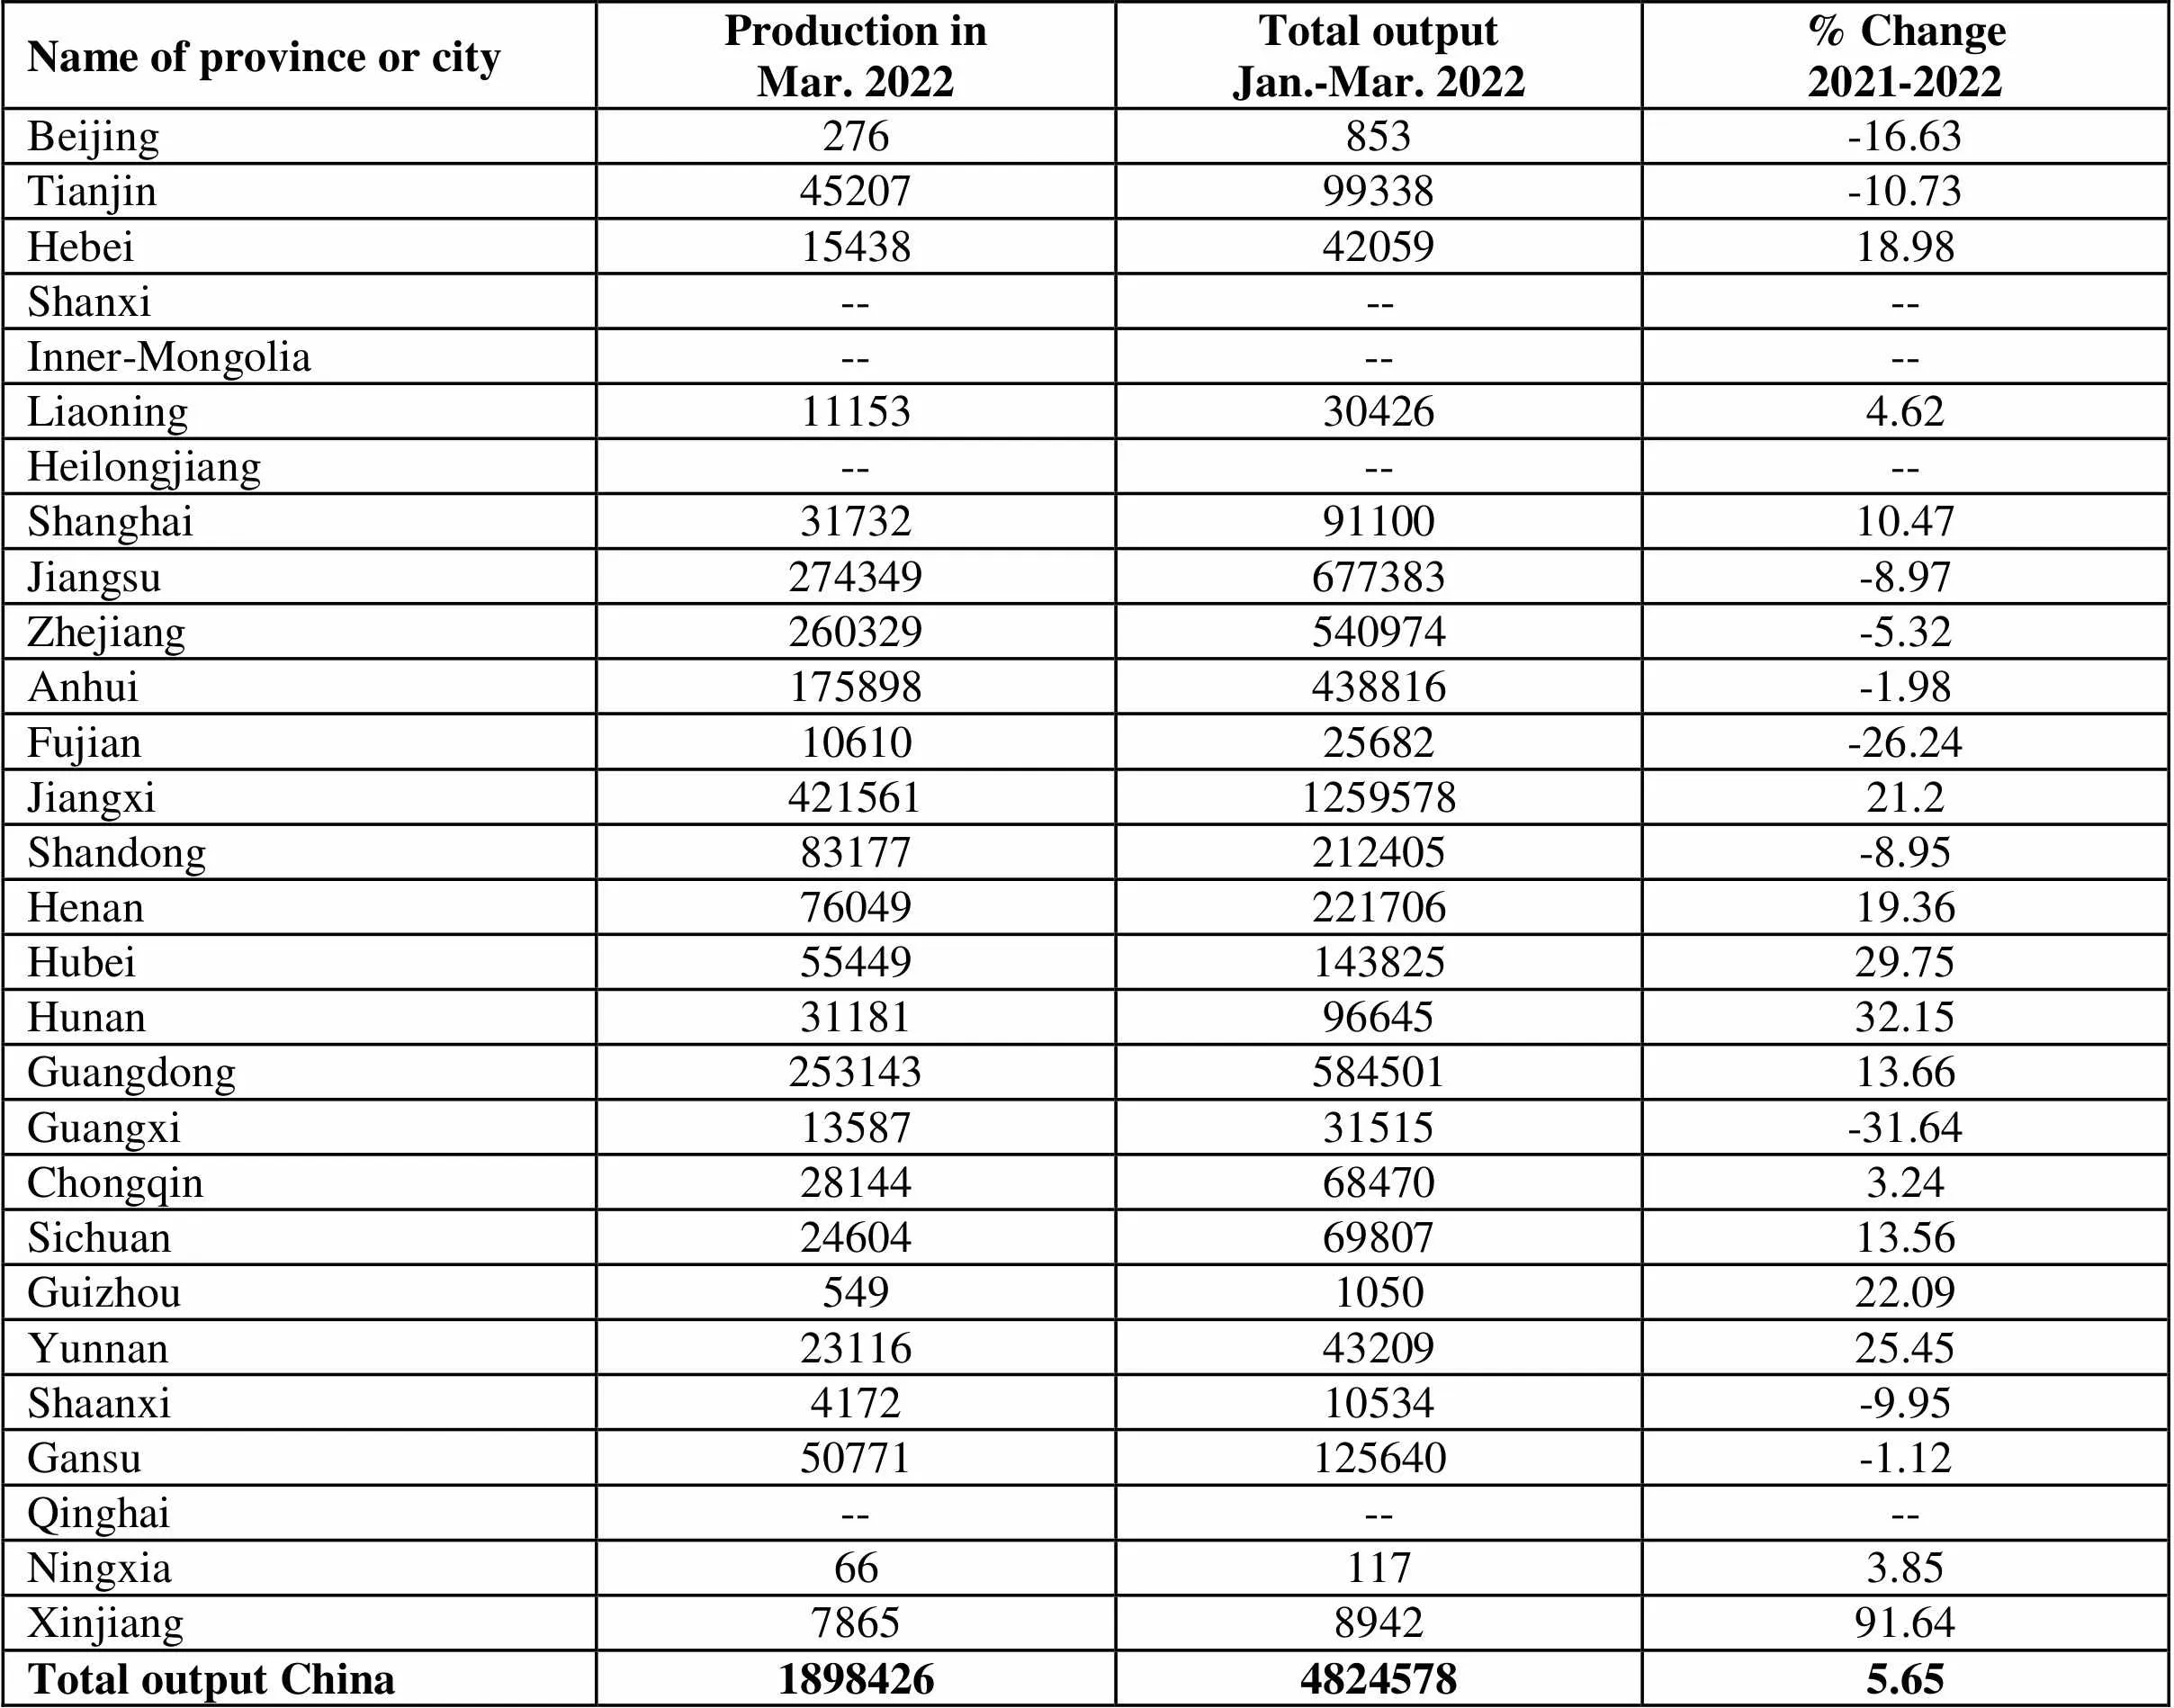
Fabricated Copper Production by Province or City in 2022 Unit: metric ton
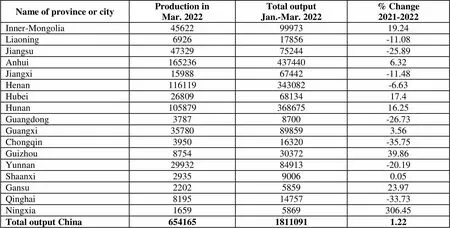
Lead Production by Province or City in 2022 Unit: metric ton
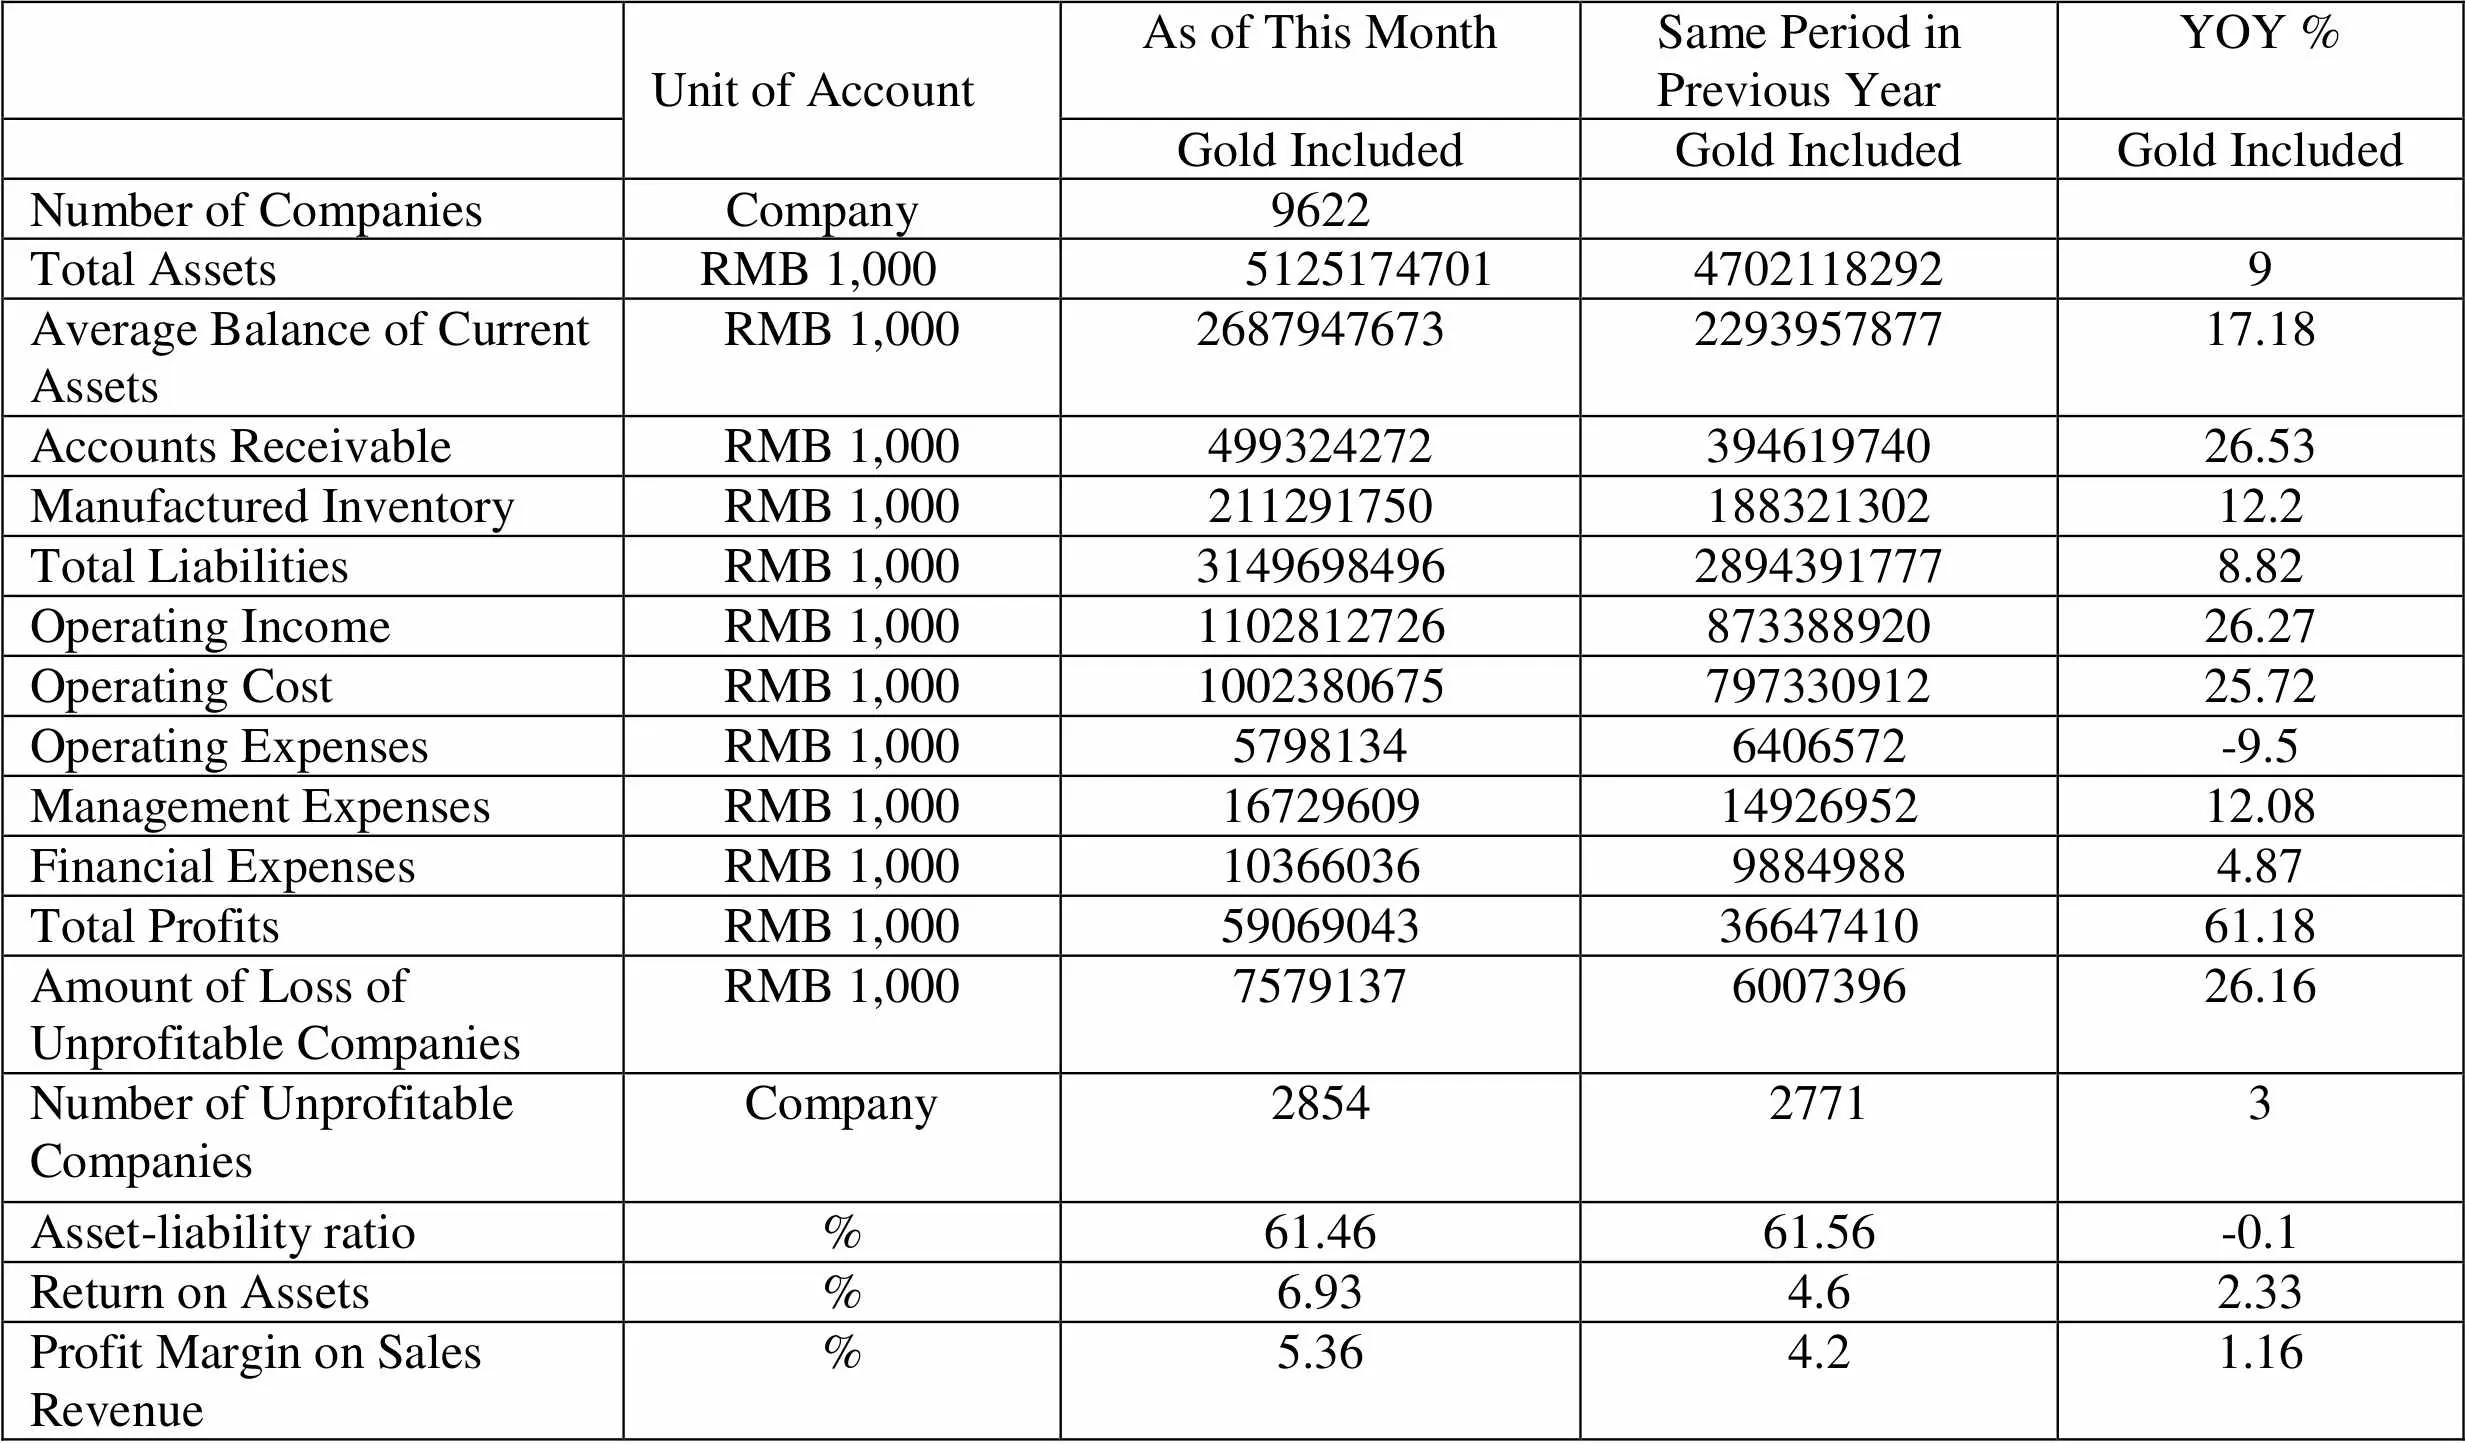
Key Financial Indicators of Non-ferrous Companies Above Designated Size January – February 2022
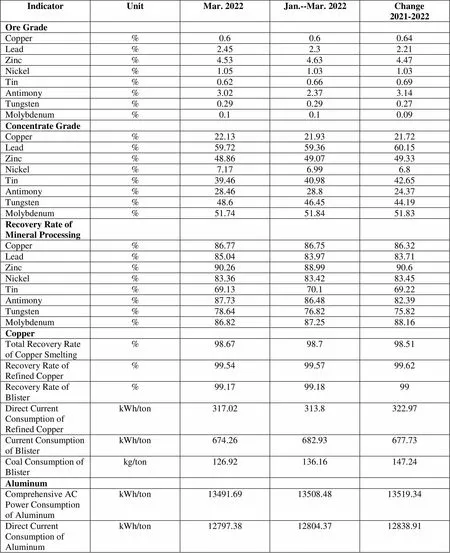
Technical and Economic Indicators of Major Enterprise
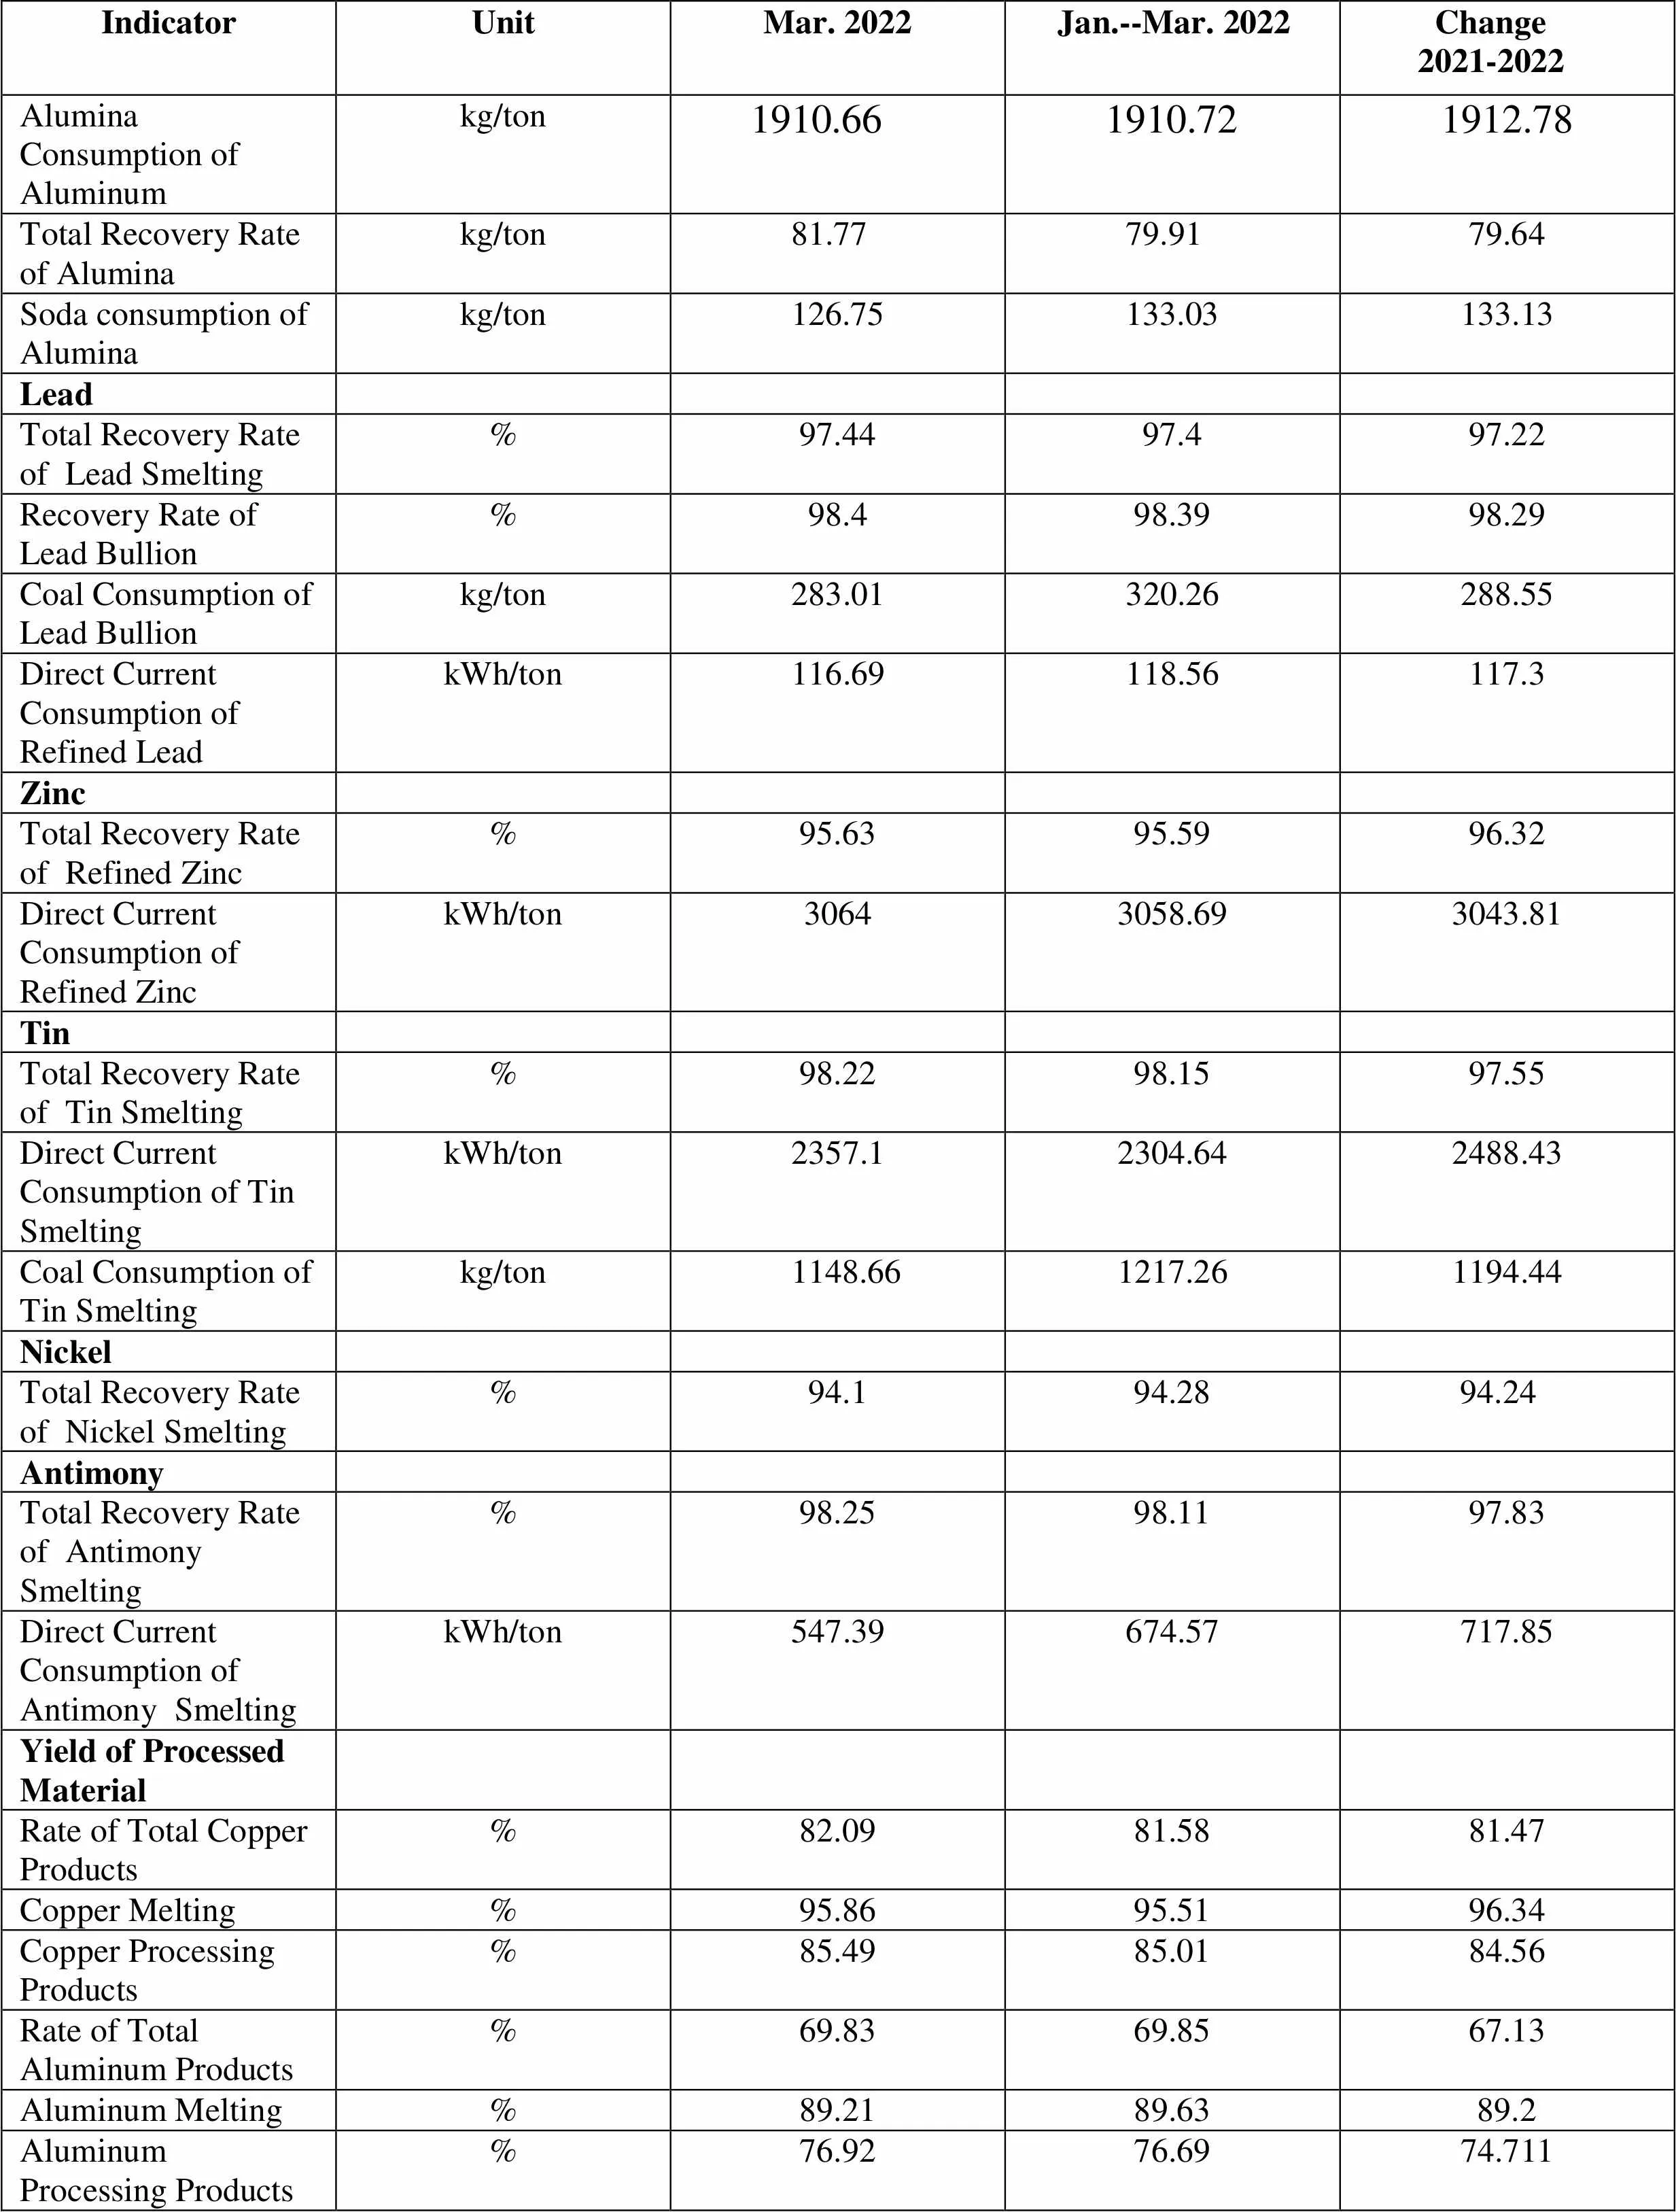
IndicatorUnitMar. 2022Jan.--Mar. 2022 Change 2021-2022 Alumina Consumption of Aluminumkg/ton 1910.66 1910.721912.78 Total Recovery Rate of Aluminakg/ton81.7779.9179.64 Soda consumption of Aluminakg/ton126.75133.03133.13 Lead Total Recovery Rate of Lead Smelting%97.4497.497.22 Recovery Rate of Lead Bullion%98.498.3998.29 Coal Consumption of Lead Bullionkg/ton283.01320.26288.55 Direct Current Consumption of Refined LeadkWh/ton116.69118.56117.3 Zinc Total Recovery Rate of Refined Zinc%95.6395.5996.32 Direct Current Consumption of Refined ZinckWh/ton30643058.693043.81 Tin Total Recovery Rate of Tin Smelting%98.2298.1597.55 Direct Current Consumption of Tin SmeltingkWh/ton2357.12304.642488.43 Coal Consumption of Tin Smeltingkg/ton1148.661217.261194.44 Nickel Total Recovery Rate of Nickel Smelting%94.194.2894.24 Antimony Total Recovery Rate of Antimony Smelting%98.2598.1197.83 Direct Current Consumption of Antimony SmeltingkWh/ton547.39674.57717.85 Yield of Processed Material Rate of Total Copper Products%82.0981.5881.47 Copper Melting %95.8695.5196.34 Copper Processing Products%85.4985.0184.56 Rate of Total Aluminum Products%69.8369.8567.13 Aluminum Melting%89.2189.6389.2 Aluminum Processing Products%76.9276.6974.711

Alumina Production by Province in 2022 Unit: metric ton
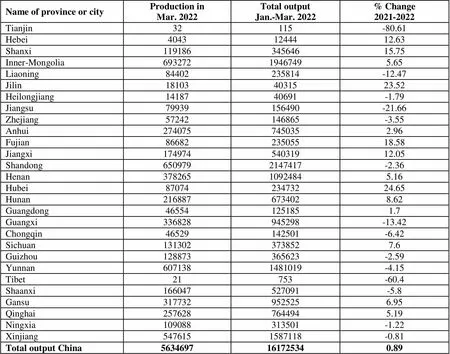
Yield of Ten Major Types of Nonferrous Metals By Region

Zinc Production by Province in 2022 Unit: metric ton
