Mixing Dynamics and Synthesis Performance of Staggered Herringbone Micromixer for Limit Size Lipid Nanoparticles
2022-06-30ShuaiZhangYunlongFanChenmuXueYuanzhanYangXiaoqiongLiXiaodongChenYulinDeng
Shuai Zhang, Yunlong Fan, Chenmu Xue, Yuanzhan Yang, Xiaoqiong Li,Xiaodong Chen, Yulin Deng
Abstract: Staggered herringbone micromixer has shown good efficiency of mixing and performance of synthesizing nanoparticles. To bring a detailed understanding of the mixing dynamics and syn−thesis performance of this kind of micromixer, this paper carries out a high−fidelity numerical simu−lation and a parametrial experimental study on a well−established design. A passive tracer is induced in the numerical simulation to analyze mixing dynamics induced by the staggered herring−bone structures. Three effects are identified to reveal the underlying mechanisms, including folding,stretching, and splitting. To the authors’ knowledge, the splitting effect is identified for the first time by the isosurface of the passive tracer, to show the high efficiency of the staggered herring−bone design. The micromixer is then used to synthesize lipid nanoparticles by mixing a mixture of lipid and poly (lactic−co−glycolic acid) (PLGA) solutions with deionized water. Under a wide mass ratio of lipid and PLGA solutions, nanoparticles with good monodispersity are synthesized to reflect the good compatibility of the micromixer and the mixture. In addition, an optimized mass ratio is identified from the parametrical experiment.
Keywords: mixing dynamics; staggered herringbone micromixer; folding; stretching; splitting
1 Introduction
In recent years, microfluidic technology develops rapidly[1, 2 ], and it has been widely used in biomedicine, chemical reaction, separation, detec−tion and other fields[3-7]. Microfluidic chip has the characteristics of miniaturization and high integration[2, 8, 9]. As an important device in microfluidic chips, micromixer is particularly important in mixing, reactions, biological analy−sis, etc.[10, 11]. Realizing the rapid mixing of flu−ids is a prerequisite for these purposes.
Micromixer is mainly divided into two types:active micromixer and passive micromixer[12]. A passive micromixer does not require external energy, and it mainly relies on the structure of the microchannel to achieve mixing. Active micromixers usually use external forces to achieve mixing, such as electric fields, sound fields, magnetic fields, etc.[13]. Passive micromixer has attracted the attention of many scholars because of their simple structure and easy integration[5, 14].
Convection and diffusion are the two keys flow phenomena related to mixing in passive micromixers[15]. For a certain application,reagents generally cannot be changed, and the molecular diffusion rate does not change at a cer−tain temperature. It becomes almost impossible to improve the mixing efficiency by increasing diffusion. On the other hand, convection is more ready to be adjusted by flow rate or channel design to increase the degree of mixing.
There are mainly two ways to improve mix−ing. One is to prolong the flow time of the fluids to allow diffusion to have enough time to induce mixing. However, prolonging the flow time has its own limitations in practical. For example, the chemical reaction near the interface of the two reacting reagents may not happen evenly due to the long reaction time. Especially, in nanoparti−cle synthesis using micromixers, rapid mixing is prerequisite[16]. This is because the size of the particles is affected by the reaction time of the two reacting reagents[17]. The other way to improve mixing is to induce transverse flow in the cross−section of the channel or to “stir” the flow. Transverse flow can be induced by differ−ent channel structures with obstacles or cavities on the sides of the main channel.
Flows in a microfluidic channel are usually laminar to exclude chaotic eddies in turbulent flows. If two reacting reagents enter the main channel side−by−side, their streamlines remain parallel to each other. When there is no trans−verse flow, a little mixing of the two reagents can occur, except via a slow diffusion at their com−mon interface (i.e., the contact surface between the two liquids). Angled grooves or ridges placed on the channel floor walls can induce transverse flows while small resistance in the main flow direction is presented. The common interface between the two fluids can then rotate along the main flow direction with an increasing area. It was shown that the mixing process can be fur−ther improved by staggering the angled groves with an asymmetrical chevron[18]. The so−called staggered herringbone pattern results in the effect of chaotic stirring to stretch and fold the fluids. As a consequence, the area of the com−mon interface between the two liquids increases dramatically.
Staggered herringbone on one side of the main microchannel was proved to be an efficient micromixer to induce rapid mixing[18]. This kind of micromixer is called a “chaotic mixer” since chaotic flow with stretching and folding of vol−umes of the fluid is induced by the channel design. The chaotic mixer has been used to per−form rapid mixing of reagents for the controlled synthesis of two types of limit size lipid nanopar−ticle systems, having either polar or nonpolar cores[19]. However, an intuitive understanding of the flow dynamics is yet to be addressed to reveal the in−depth reason for the good perfor−mance of the chaotic mixer.
In this paper, a combined numerical and experimental study is carried out to analyze the mixing process and its result of a chaotic mixer.The design of the mixer follows Ref. [19]. A numerical simulation with a high grid resolution is carried out to reveal the mixing process. A parametrical experiment study is then performed to generate nanoparticles of different sizes.
2 Methods
2.1 Channel Design
The channel design of the chaotic mixer follows Ref. [19] with small modifications. The micromixer has two inlets and one outlet. Multi−ple groups of six staggered herringbone struc−tures are arranged at the bottom of the micromixer, as shown in Fig. 1 (a). The total number of groups is 36. The detailed geometry in the straight parts of the channel path is shown in Fig. 1 (b), whereW= 200 μm andw= 50 μm are the width of the microchannel and the width of the staggered herringbone structure, respec−tively. Meanwhile,H= 79 μm andh= 31 μm are the height of the microchannel and the her−ringbone structure, respectively.D= 550 μm andd= 100 μm are the length of a group of stag−gered herringbone structures and the distance between adjacent groups, respectively.
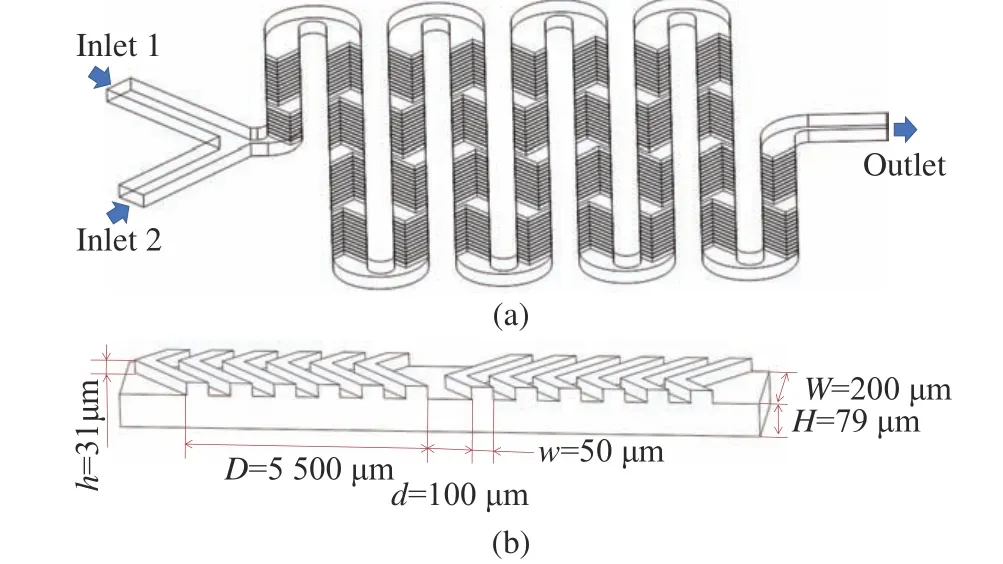
Fig. 1 The size of the staggered herringbone micromixer:(a) overall geometry of the micromixer; (b) dimen−sions of the staggered herringbone structure
2.2 Numerical Methods
In order to understand the mixing dynamics of the micromixer, a numerical simulation is car−ried out. The synthesis process of the limit size liquid nanoparticles involves many fundamental physical and chemical phenomena. Since the mix−ing dynamics are more concerned in the present study, reagents inside the micromixer are consid−ered to be the same viscous and incompressible fluid. The reaction of the two reagents is excluded. The fluid viscosity is measured to be about 1.8 mPa·s, which is less than twice that of water. The fluid is thus regarded to be Newto−nian. A passive tracer is used in the numerical simulation to show the mixing of the two reagents. Meanwhile, only the convection of the passive tracer is considered by setting the diffu−sion coefficent to a extreamly low value. The con−servation equations contain a momentum equa−tion, continuum equation, and convection equa−tion for the passive tracer. The equations are,respectively,

whereuis the velocity vector,ρis the fluid den−sity,µis the dynamic viscosity,Dis the diffu−sion coefficient,cis the volume fraction of the passive tracer,pis pressure, andtis time.
Numerical simulations are carried out using Ansys Fluent, considering a transient laminar flow inside the micro−device. Initially, the values ofcare set to be 0 and 1 in the two inlets,respectively. Physical properties are according to water, which has a density of 998 kg/m3and a dynamic viscosity of 1.0× 1 0−3Pa·s. Fluid veloc−ity at both inlets is 0.025 m/s. Pressure outlet condition is set to the outline with a reference pressure of 1.013 × 10⁵Pa. While no−slip bound−ary conditions are imposed on the channel walls.
In order to capture the detailed mixing pro−cess, a fine mesh is required to resolve both the main channel and the herringbone structures. A grid independent study is carried out first with three grid resolutions, namely low, medium, and high resolutions. The corresponding mesh num−bers are 4 155 785, 13 437 046 and 31 139 607,respectively. For the mesh with high resolutions,as shown in Fig. 2 (a), the flow domain is dis−cretized in Fluent Meshing into polyhedral cells,which have a nearly uniform size of 3 μm.Fig. 2 (b) and Fig. 2 (c)show enlarged views at the staggered herringbones and the inlet.
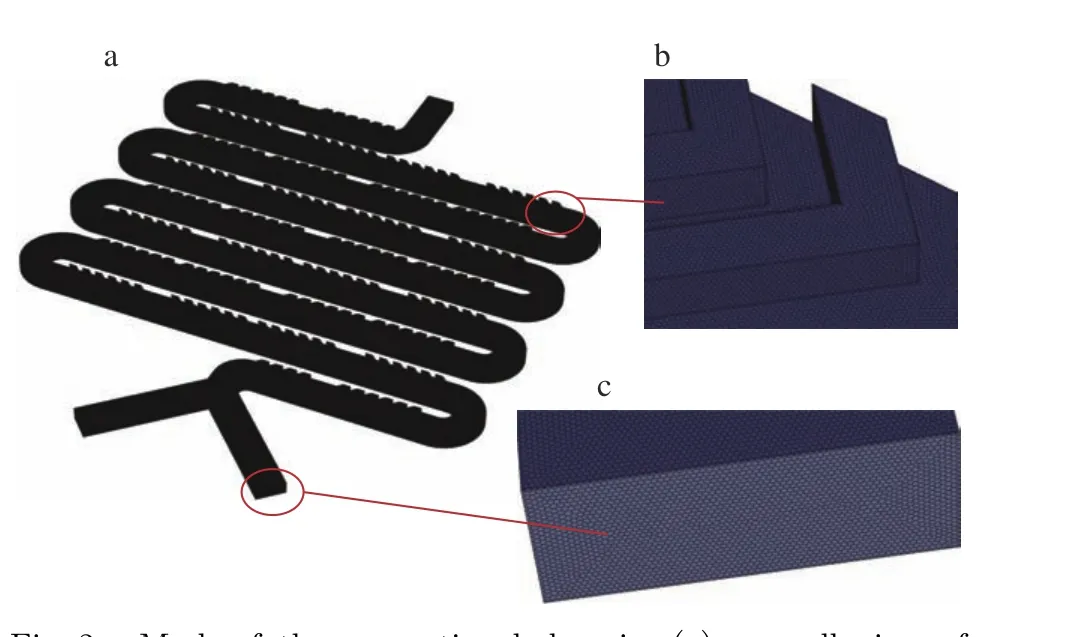
Fig. 2 Mesh of the computional domain: (a) overall view of the mesh; (b) enlarged view of a staggered herringbone structure; (c) enlarged view of a inlet
Fig. 3 (a) and Fig. 3 (c) show the distribu−tion ofcwithin the cross−section at 30 mm down−stream of the channel junction for simulations under different grid resolutions, respectively. It is shown that similar patterns are captured with the three grid resolutions. As expected, simula−tions with high resolution show the sharpest interface between the two fluids. Meanwhile, the letter−C−like pattern at the right is obviously more detailed with finer grid resolution. Fig. 3 (d)shows the distribution ofcacross the centerline shown in Fig. 3 (a) for the three grid resolutions.The curves for medium and high grid resolution tend to collapse with each other, indicating the convergence of the grid resolution. In order to obtain more accurate results, the high resolution is used in the following study.
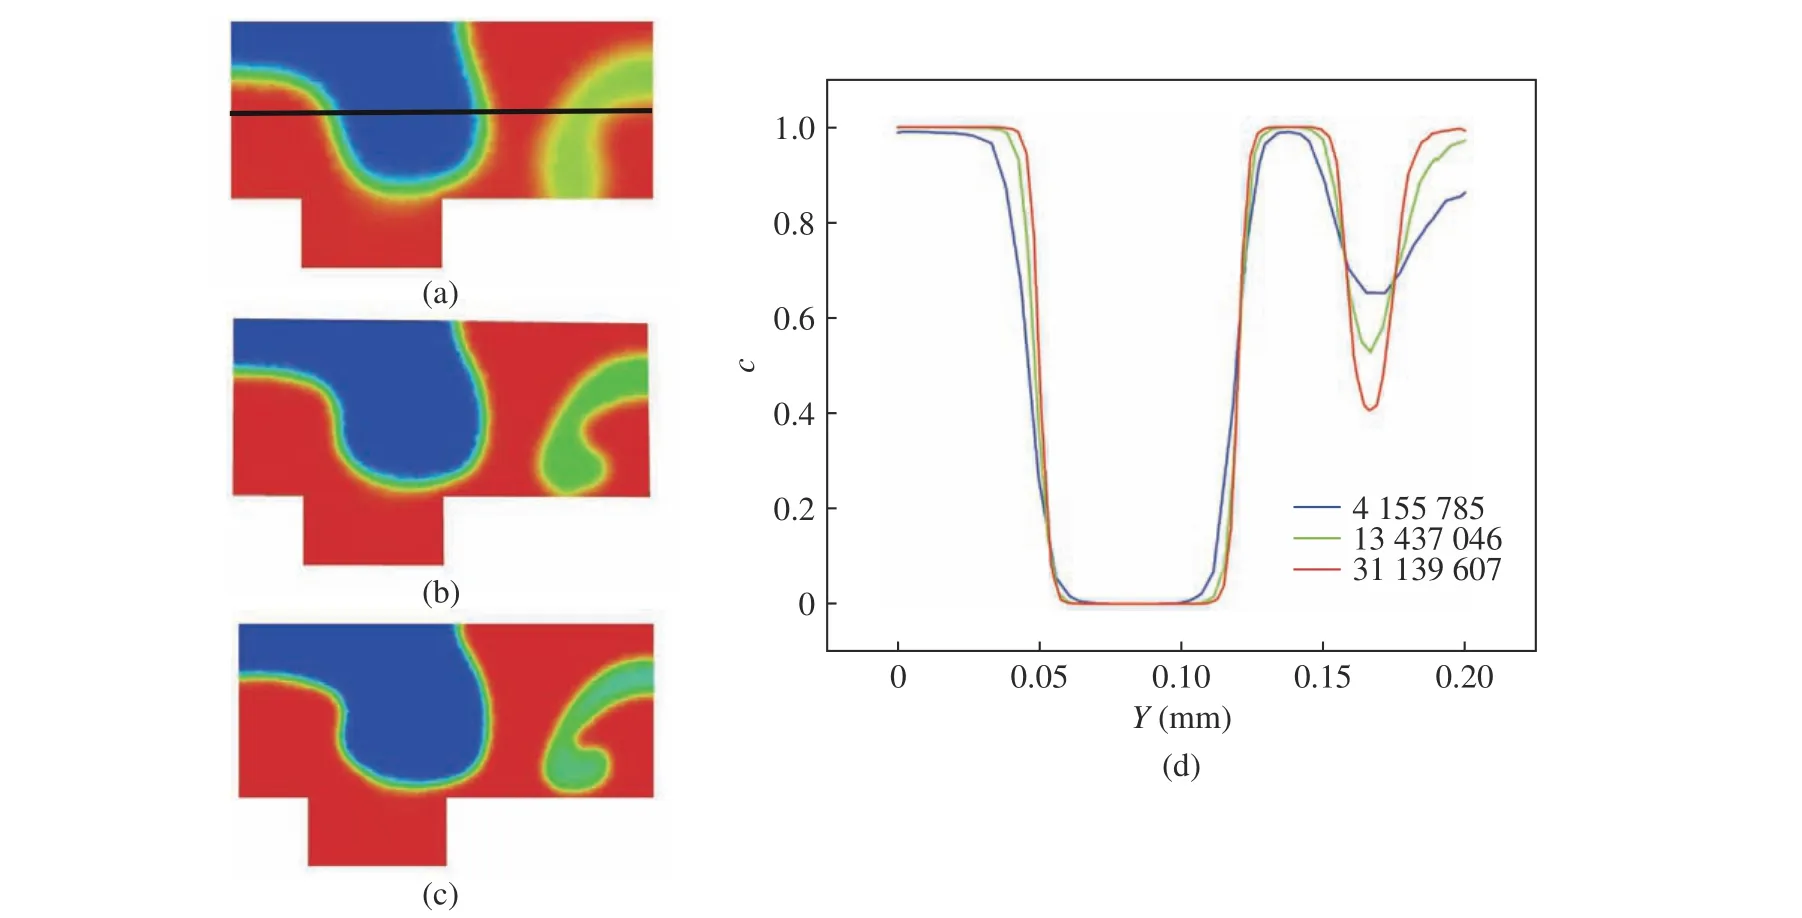
Fig. 3 Distribution of the volume fraction of the passive tracer, c, for the three grid resolutions: (a), (b), and (c) the distributions on the cross−section at the downstream location; (d) the distrubition across the centerline showing in Fig. 3(a) for the three grid resolutions
2.3 Reagent Preparations
Reagents used in this paper to synthesize nanoparticles are poly ( lactic−co−glycolic acid)(PLGA)” solution and lipid solution, following Ref. [20]. The synthesis principle of lipid−PLGA nanoparticles is through the steps of polymer molecular self−assembly and lipid encapsulation.Liposome synthesis is the spontaneous formation of spherical aggregates of lipid molecules in order to maintain a minimal entropy state under the condition of changing polarity. In the microflu−idic channel, due to the laminar flow effect, lipids are generated at the liquid interface of the two solutions, and the homogeneity of the generated liposomes can be effectively controlled by control−ling the liquid flow rate and solute concentration.The herringbone mixing channel can keep the contact surface stable to a certain extent even when the fluid contact surface is enlarged by crimping the fluid channel. Therefore, the homo−geneity of the liposomes can be ensured while improving the mixing efficiency.
The preparation process of the PLGA solu−tion is achieved by the following steps. 100 mg PLGA is added in 6.5 mL Dimethylformamide(DMF) solution and 3.5 mL Trifluoroethanol(TFE) solution, and it is whirled in a centrifuge tube at room temperature for 24 h to prepare1%PLGA solution. For lipid solution, 10 mg of chole−sterol, 30 mg of Distearoyl phosphoethanolamine−polyethylene glycol 2000 (DSPE−PEG2000), and 45 mg of 1,2−dipalmitoyl−sn−glycero−3−phospho−choline (DPPC) are weighed and put into a cen−trifuge tube. 10 mL of ethanol is added to dis−solve the lipid. The lipid solution is obtained after stirring at room temperature for 30 min.The mass ratio of the three reagents was mDPPC:mDSPC−PEG2000: mcholesterol= 4.5 : 3 : 1.
To synthesize nanoliposome particles, inlet 1 was injected with a mixture of lipid and PLGA solutions with a mass ratio varying from 0.050 to 0.40, while a flow rate wasQ1= 0.2 mL/min.Inlet 2 was injected with deionized water with a flow wasQ2= 1 mL/min. The resulting solution with nanoparticles is collected at the outlet at room temperature (about 25°C). The collected nanoparticles are stored for 24 hours at a low temperature (about 4°C) to complete the prepa−ration of nanoparticles. Then these nanoparticles were determined by dynamic light scattering(DLS) (Zetasizer 3000HS, Malvern) and trans−mission electron microscope (TEM) was used to observe the structure of them.
3 Results and Discussion
3.1 Mixing Dynamics
Fig. 4 shows the distribution ofcon the channel walls to provide a basic understanding of the mixing dynamics. As the two fluids gather to enter the main channel side−by−side, the sharp interface between the two fluids is clearly observed near the inlets. The top view in Fig. 4 (a)shows that the side−by−side pattern is destroyed at the second U−turn. However, the bottom view in Fig. 4 (b) shows that the side−by−side pattern is destroyed at the first group of the staggered herringbone structure. The interface does not stay sharp as the fluids move downstream, indi−cating the mixing of the fluids from the two inlets. Comparing Fig. 4 (a) and Fig. 4 (b), it is obvious that the staggered herringbone struc−tures disturb the fluid flow at the bottom directly, while the fluid flow at the top is then altered.
In order to observe the transverse flow in the microchannel, sixteen cross−sections are taken at the positions of the two black lines shown in Fig. 4. Fig. 5 shows that, in cross−section 1, the interface between the two fluids is disturbed but still sharp. The flow is influenced by the stag−gered herringbone structure to fold the interface toward the left side. When flowing into cross−sec−tion 2, the distribution ofcseems to be flipped,while an additional portion of the interface appears on the right side. The non−sharpness of t he interface portion indicates that it is stretched along the direction perpendicular to it. Folding and stretching of the interface continue to occur as observed in the following cross−sections. When approaching the outlet as on cross−section 16, the interface is hard to be identified, whilecis close to 0.5 at the cross−section. This means the fluids from the two inlets are mixed wall to each other.
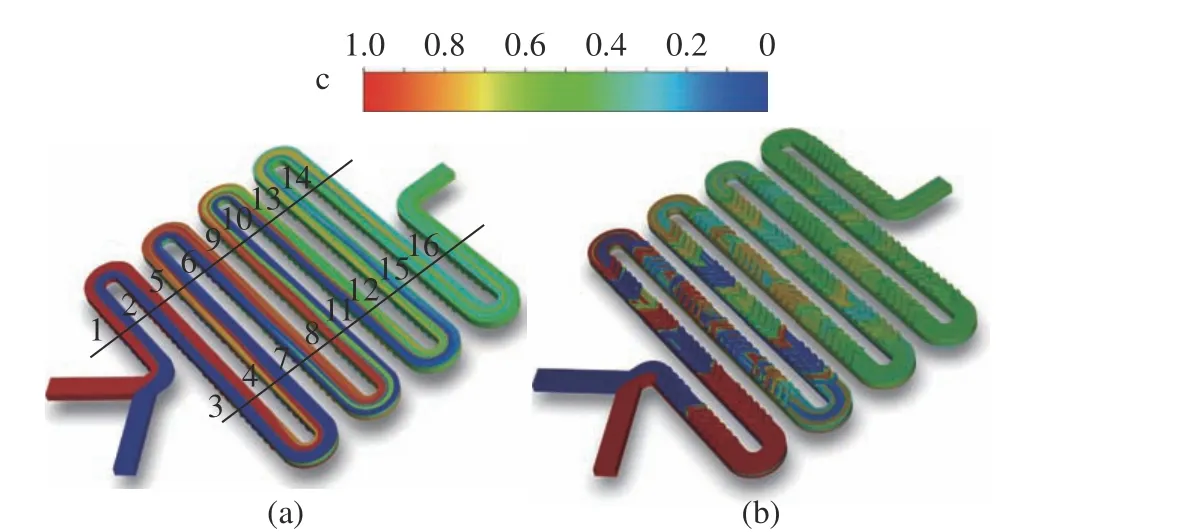
Fig. 4 Distribution of the volume fraction of the passive tracer,c, on the channel walls: (a) top view; (b) bottom view
The folding and stretching effects induced by the staggered herringbone structures can be obtained on the channel cross−section. However,it is difficult to observe the effects of the down−stream channel. To solve this problem, the iso−surface ofc= 0.5 is obtained, as shown in Fig. 6,from the high−fidelity simulation to provide addi−tional information about the mixing process. It is obvious that there is only one layer of isosurface at the inlet, while multiple layers appear at the outlet. The number of layers is roughly 10. This helps to improve the mixing efficiency. The fold−ing of the micromixer continuously influences the mixing dynamics through the whole channel. The staggered herringbone structures generate a com−plex three−dimensional effect to further increase the area of the isosurface ofc= 0.5.
Fig. 7 shows the detailed folding and split−ting of the isosurface. As shown in Fig. 7 (a),after flowing into the region of staggered herring−bone structure, the isosurface is folded to one side and then split into two parts (as marked with ①), in which there is additional folding of the two parts. The larger part is further split downstream by another group of herringbone structure at the position marked with ②. The process repeats in the following position marked with ③. As shown in Fig. 7 (b), the complex spatial distribution of thec= 0.5 isosurfaces is observed downstream. Overall, the isosurface is folded along the streamline of the mean flow.Note that the usage of the isosurface can not reflect the stretching effect.
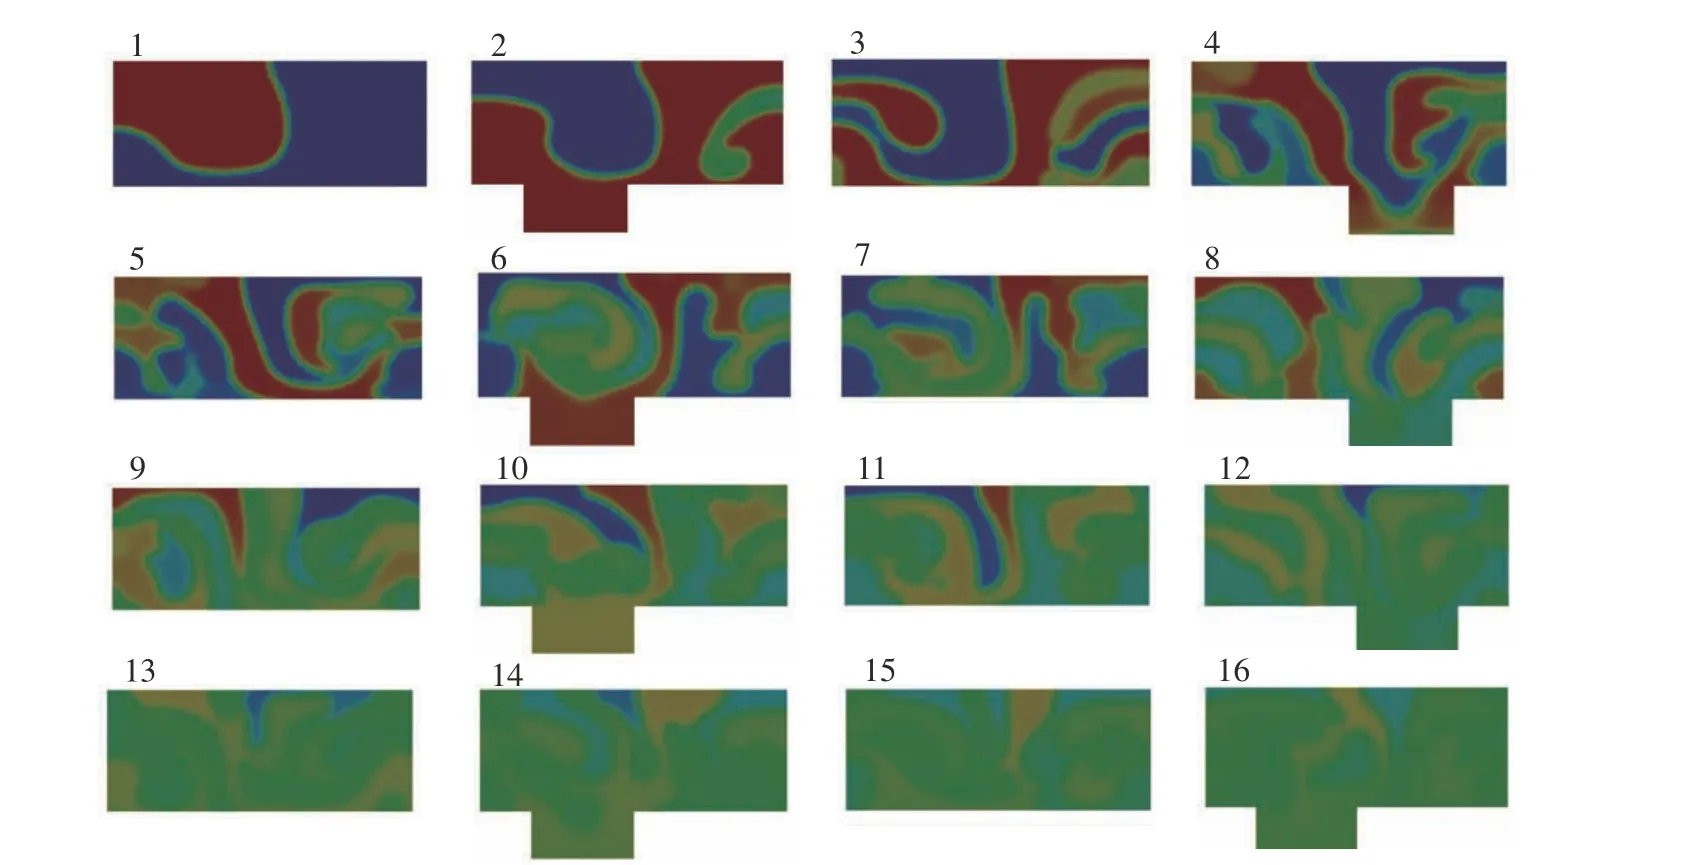
Fig. 5 Distribution of the volume fraction of the passive tracer, c, in sixteen cross−sections in Fig. 4 (a)
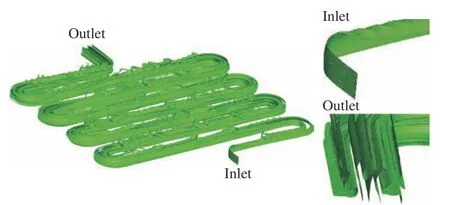
Fig. 6 Contact surfaces represent by 50% mass fraction
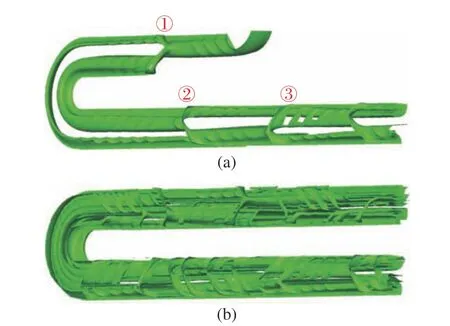
Fig. 7 Folding and splitting of the isosurface of c = 0.5 along the mean channel: (a) near the inlets; (b) near the third U−turn
At the first sight, ideally, the number of lay−ers of the isosurface could increase exponentially with the number of groups of herringbone struc−tures,N, to be 2N. However, since the splitting can not be perfect and there are counter effects of the nearby structures in terms of folding, the layers of the isosurface increase slowly after mul−tiple splitting and folding. This reflects indi−rectly the stretching effect across the interface between the two fluids (as shown in Fig. 5) ,which also plays an important role during the whole mixing process.
The information obtained from the above analyses provides a deep understanding of the mixing dynamics induced by the staggered her−ringbone structures. Future studies on the key geometrical parameters of the structures could provide guidance for the design of the micro−mixer. The method used in the present numeri−cal simulation may be used to establish an opti−mization criterion for further improvement of mixing efficiency.
3.2 Nanoparticle Syntheses
In order to understand the performance of the mixer on synthesizing lipid nanoparticles, a parametrial study is carried out by varying the mass ratios of lipid and PLGA solutions (ml/mp).Fig. 8 shows variations of mean size of nanoparti−cles and polydispersity index (PDI) with differ−ent mass ratios. PDI characterizes the dimen−sional consistency. When the mass fraction ratio ofml/mpincreases from 0.050 to 0.40, the size of the nanoparticle increases near linearly. However,PDI shows a decreasing and then increasing ten−dency. The smallest PDI is achieved atml/mp=0.20. The corresponding PDI is 0.050±0.027,while the mean size is 113.30±5.39 nm.
Fig. 9 shows the images of nanoparticles taken by a transmission electron microscope(TEM). Fig. 9 (a), Fig. 9 (b), and Fig. 9 (c)are different enlargement factors, showing the good uniformity of the nanoparticles. The nanoparticles are spherical with core−shell mor−phology, in which the white region is the poly−mer core composed of PLGA and the gray sur−rounding region is the outer layer of lipid.

Fig. 9 Images of nanoparticles taken by a transmission electron microscope (TEM) with different enlargement factors
4 Conclusion
In this paper, a high−fidelity numerical simula−tion is carried out to study the mixing dynamics in a staggered herringbone micromixer. A pas−sive tracer is used to track the two mixing fluids.The distribution of the passive tracer is analyzed in terms of cross−section contours and median isosurface to show the folding, stretching, and splitting effect of the micromixer to the mixing dynamics. Among them, the splitting effect is identified clearly for the first time. An experi−mental study is carried out by varying the mass ratio of two solutions to understand the synthe−sis perforation of the micromixer. It is found that good monodispersity can be obtained and there is an optimized mass ratio for the lowest polydis−persity index of about 0.05. The information obtained from the present paper can be used in the optimization of the staggered herringbone micromixer, in terms of both geometrical design and reagent selection.
杂志排行
Journal of Beijing Institute of Technology的其它文章
- Application of Micro Electro Mechanical System(MEMS) Technology in Photoacoustic Imaging
- A New Class of Biodegradable Organic Optoelectronic Materials: α-Oligofurans
- Design of Implant Prosthesis for Bone Injury Repair Considering Stress Shielding Effect
- A Microfluidic System with Active Mixing for Improved Real-Time Isothermal Amplification
- Effect of Auxiliary Gas Flow Parameters on Microstructure and Properties of Ta Coatings Prepared by Three-Cathode Atmosphere Plasma Spraying
- Nanoscale Metal-Organic Frameworks:Stimulus-Response and Applications
