A Feature Extraction Method for scRNA-seq Processing and Its Application on COVID-19 Data Analysis
2022-06-30XiuminShiXiyuanWuHengyuQin
Xiumin Shi, Xiyuan Wu, Hengyu Qin
Abstract: Single−cell RNA−sequencing (scRNA−seq) is a rapidly increasing research area in biomed−ical signal processing. However, the high complexity of single−cell data makes efficient and accurate analysis difficult. To improve the performance of single−cell RNA data processing, two single−cell features calculation method and corresponding dual−input neural network structures are proposed.In this feature extraction and fusion scheme, the features at the cluster level are extracted by hier−archical clustering and differential gene analysis, and the features at the cell level are extracted by the calculation of gene frequency and cross cell frequency. Our experiments on COVID−19 data demonstrate that the combined use of these two feature achieves great results and high robustness for classification tasks.
Keywords: biomedical signal processing; scRNA−seq; feature extraction; COVID−19
1 Introduction
Biomedical signals are an important manifesta−tion of human life information, which can be divided into system−level signals, organ−level sig−nals and cell−level signals [1]. For a long time,related research on biomedical signal detection and processing had greatly promoted research in disease prevention, diagnosis and treatment [2].With nowadays scientific developments, biomedi−cal signals were obtained from deeper levels,among which amino acid and nucleic acid sequences have gradually become the focus of attention. There has been some progress in the processing of nucleic acids, but it was not until the advent of scRNA−seq technology that tran−scriptomics−related knowledge was truly acquired at cellular resolution [3]. scRNA−seq data can independently provide the RNA expression pro−file of each and every cell, thus providing the basis for accurate heterogeneity analysis.
Feature extraction is important research content in biomedical signal processing, so it has become our interest point for the in−depth study of scRNA−seq analysis. The scRNA−seq data without feature extraction has high dimensional−ity and high noise level, which greatly restrict the efficiency and effectiveness of the research on single cells [4]. Popular practices in the field are to project features into 2D or 3D space, making clusters of similar cells distinguishable. Cur−rently the most widely used methods are PCA[5], ICA [6], tSNE [7] and UMAP [8]. However,these methods are in many cases insufficient to represent all the complex differences of single−cell data [9], so subsequent highly specified methods have emerged, which can be classified as feature selection based methods, deep auto−encoder based methods, and supervised learning based methods.Among them, IGRDCGA [10] is a gene selection and classification method based on dynamic crossover genetic algorithm, which can screen out high−quality genes and achieve high interpretabil−ity. The intrinsic entropy (IE) [11] model is also a feature selection method that interprets the IE as the regulatory fluctuation of each gene in cel−lular processes to identify informative genes for accurate cluster analysis. Both deep auto−encoders and variational auto−encoders have a strong ability to learn the deep distribution of data [12], and they have been applied in scRNA−seq data processing. scGDC [13] is an auto−encoder based deep learning subspace clustering algorithm, which simultaneously learns the deep features and topology of cells. CellVGAE [14] is a variational graph auto−encoder architecture with graph attention layers that focuses on dimension−ality reduction and clustering of single cells.Graph−sc [15] is a graph auto−encoder network that creates embeddings for scRNA−seq cellular data that can be used to perform a variety of analyses. Supervised learning uses a data−driven approach to generalize the intrinsic distribution of scRNA−seq data. Among them, ItClust [16],Moana [17] and scDeepSort [18] are all novel and effective methods. The method proposed in this paper interprets the characteristics of single−cell data from the perspective of marker gene sequences. Based on the existing success of multi−feature fusion technique in complex data analy−sis [19, 20], marker gene features are divided into differentially expressed feature and highly expressed feature, which can capture expression patterns at the resolution of both clusters and cells. In the method section, details of these two features and the corresponding dual−input neural network will be elaborated. In the experiments section, the proposed model was used to predict cell types and disease state of COVID−19 patients. Additionally, some experiments on robustness are carried out, proving that the whole set of pipelines proposed is usable in prac−tical scenarios.
2 Methods
2.1 Pre-processing
In order to improve the usability and scalability of the scRNA−seq processing pipeline designed in this study, all codes were developed based on Python and SCANPY [21], which provided use−ful functions including single−cell quality control and differential analysis of cell clusters. For the input data, the pre−processing followed the crite−ria as in Tab. 1, which was standard operating procedure with scRNA−seq processing [22].
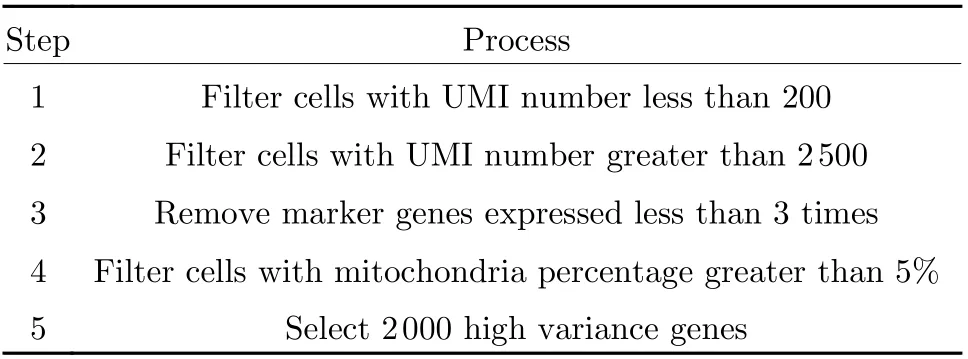
Tab. 1 Pre-processing standards for scRNA-seq
After preprocessing is completed, a count matrix of scRNA−seq data is obtained as

whereNis the number of cells andMis the total number of genes detected. Theith row of the count matrixXcontains the expression levels of all genes on theith cell, andxijis the value ofith cell in thejth column, corresponding to the specific marker genegj.
2.2 Differential Expression Feature Extraction
Differential expression features are a list of genes that can best distinguish the current cluster from all other clusters. The specific calculation pro−cess is as follows: Firstly, hierarchical clustering[23] was performed on the entire data to gener−ate a clustering tree as shown in Fig. 1. Then,the raw cluster IDs and the fine cluster IDs were taken out at different depths of this clustering tree, respectively. Except for the root node, all raw cluster nodes have non−repetitive fine clus−ters as their child nodes, which are connected to form a subtree. Finally, genes with significant differences are marked on all leaf nodes of each subtree. This process uses the Wilcoxon rank sum test algorithm [24].
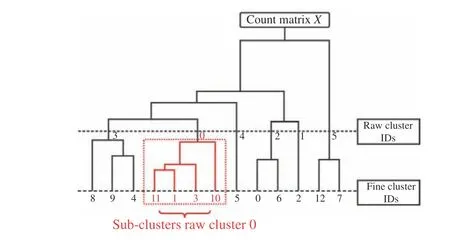
Fig. 1 Hierarchical clustering tree
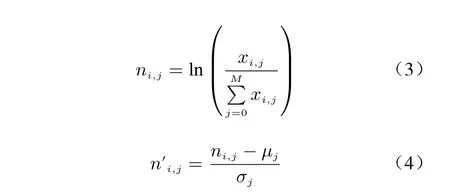
Hierarchical clustering is a bottom−up clus−tering method. The Euclidean distance between clusters is calculated as
2.3 High Expression Feature Extraction
The high expression features are single−cell−level features that contain a list of marker genes ordered by expression level, reflecting the single−cell internal transcriptional characteristics. It is generally known that scRNA−seq data can describe the life activities of single cells to a cer−tain extent by counting mRNA, but this data captures not only the unique life activities of the cell but also common life activities like metabolism, transmembrane transport and so on.For this reason, it is necessary to exclude “the housekeeping genes” whose expression levels are relatively conserved [4].
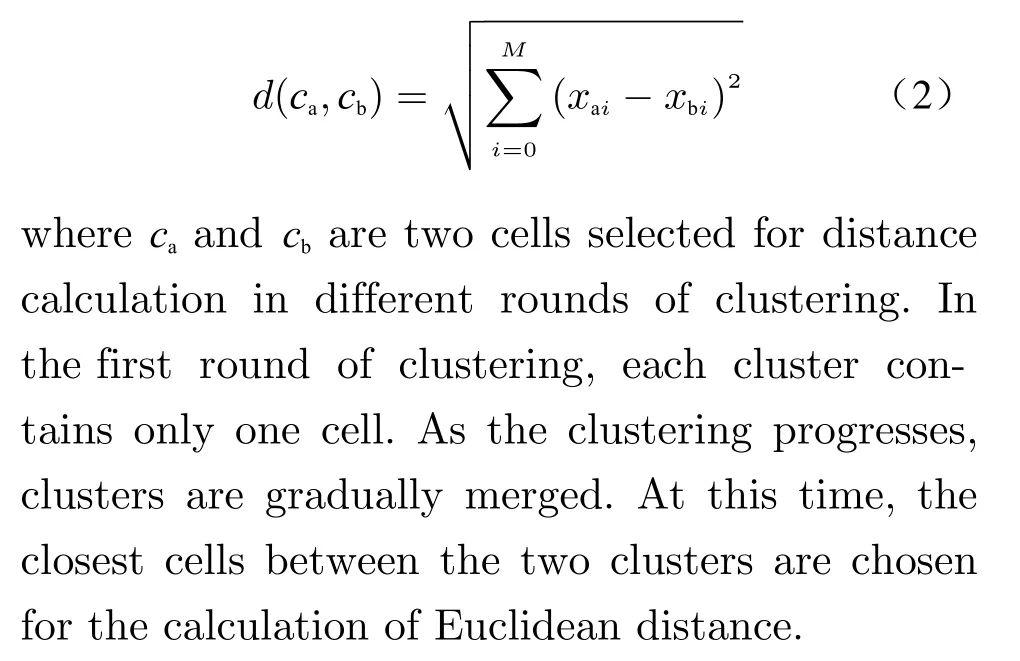
The term frequency−inverse document fre−quency [25] in the field of natural language pro−cessing is a common data processing method for finding keywords. The gene frequencyni,jand cross cell frequencyn′i,jwere defined as follow−ing equations
whereµjandσjare the mean and standard devi−ation of the expression of genegjin all cells,respectively. Firstly, the expression counts for each marker gene were normalized within each cell to make cross−cell differences comparable.Then, normalize all data in the vertical direction of the count matrix. Finally, genes were sorted by their gene frequency−cross cell frequency index to form the high expression feature sequence.Such feature can diminish the importance of those genes that are highly expressed in all cells,highlighting genes that are uniquely expressed in the current cell.
2.4 Dual-Input Deep Neural Network
A deep neural network was built to process the two features as input sequences and combine the processing results. The entire network mainly contained three parts as shown in Fig. 2: input layer, fully connected layer and linear classifica−tion layer. The input layer accepts two different inputs, where the multi−head attention module[26] is used to extract features of differential genes, and the gate recurrent unit(GRU) [27]networks is used to extract features of highly expressed genes. These two dense vectors gener−ated by the encoders for two features will later be concatenated and further processed in the fully connected layer. Finally, the classification layer of the network generates the corresponding categories specified by the task through the soft−max function.

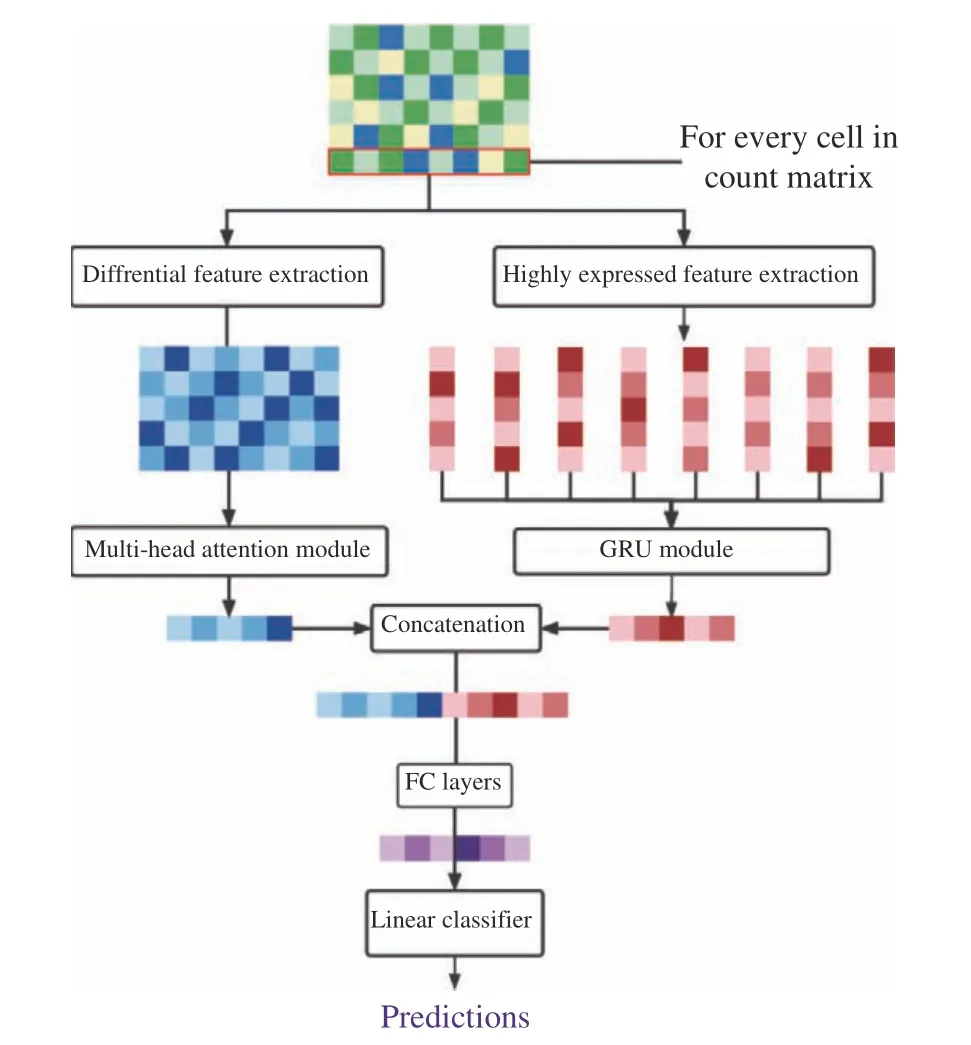
Fig. 2 Overall structure of scRNA count matrix processing networks
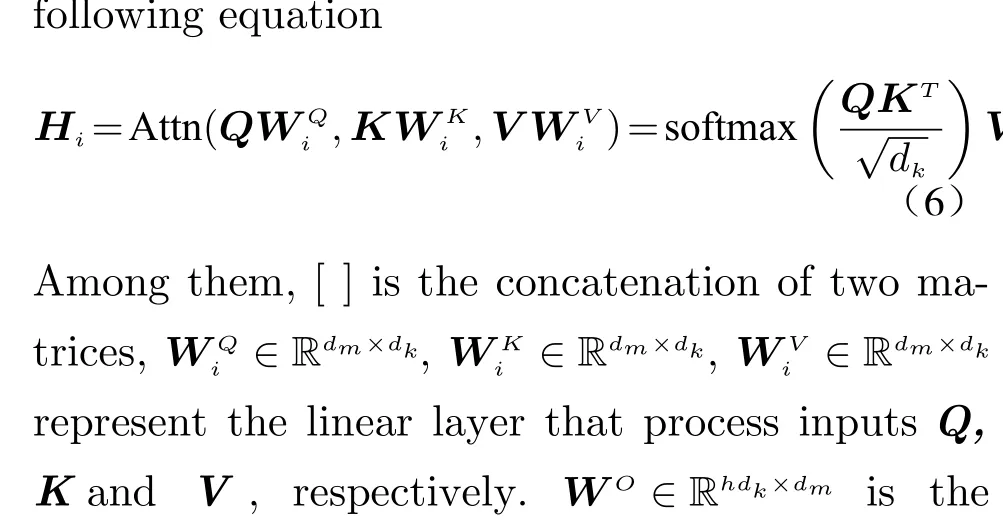
The multi−head attention module of the input layer is shown in Fig. 3 and is calculated by the following equations matrix at the output of this module.dkis the dimension inside attention module, anddmis the dimension of the output, andhis the number of heads.
The GRU module of the input layer is a variant of the recurrent neural network model,which uses a simplified gating mechanism to overcome the difficulties in long−term depen−dency modeling. The structure of one single GRU unit is shown in Fig. 4. Its gating mechanism is mainly implemented by the update gateztand the reset gatert. A typical forward propagation is calculated according to the following equations
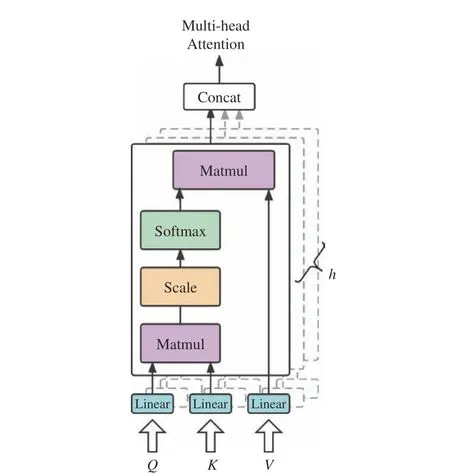
Fig. 3 Detailed structure of multi−head attention module
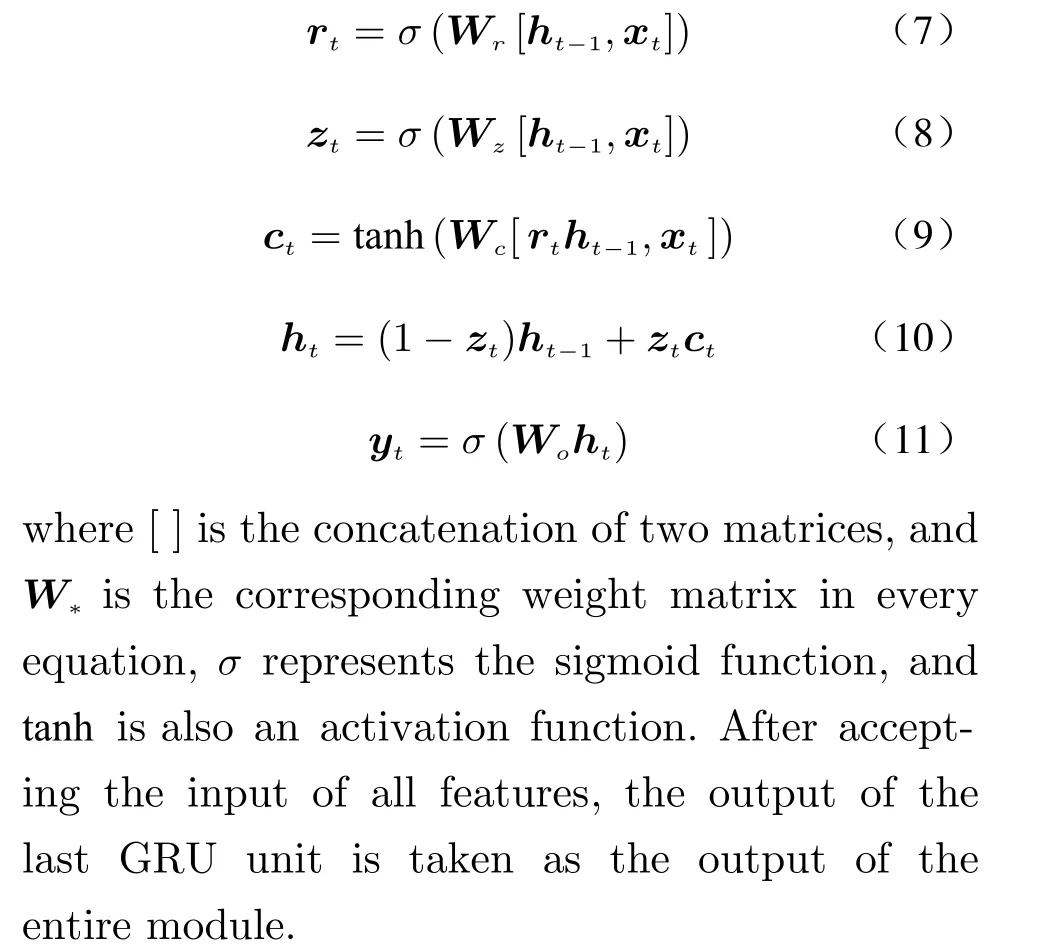
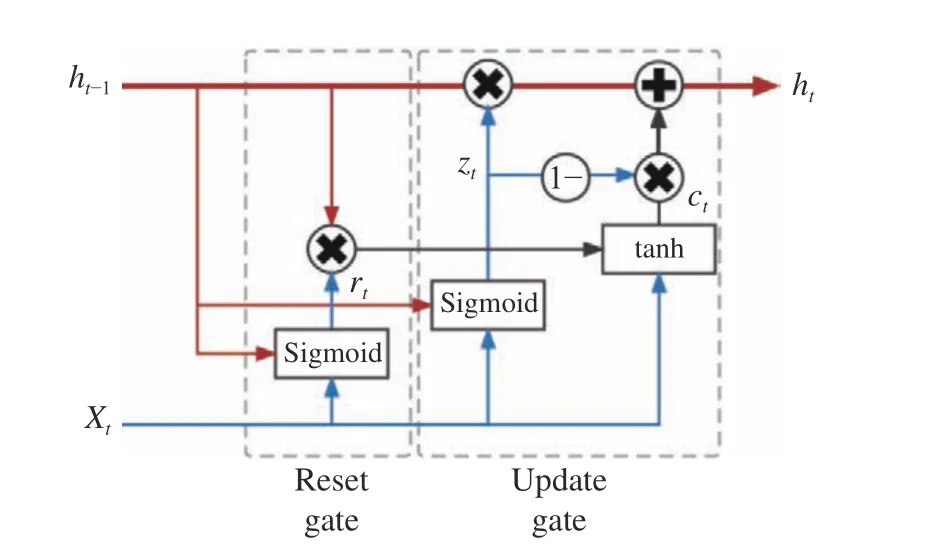
Fig. 4 Structure of one single GRU
2.5 Performance Indicators
The effect of the multi−classification task is mea−sured by the following indicators: accuracy,recall, precision and F1 score, and their equa−tions are as follows
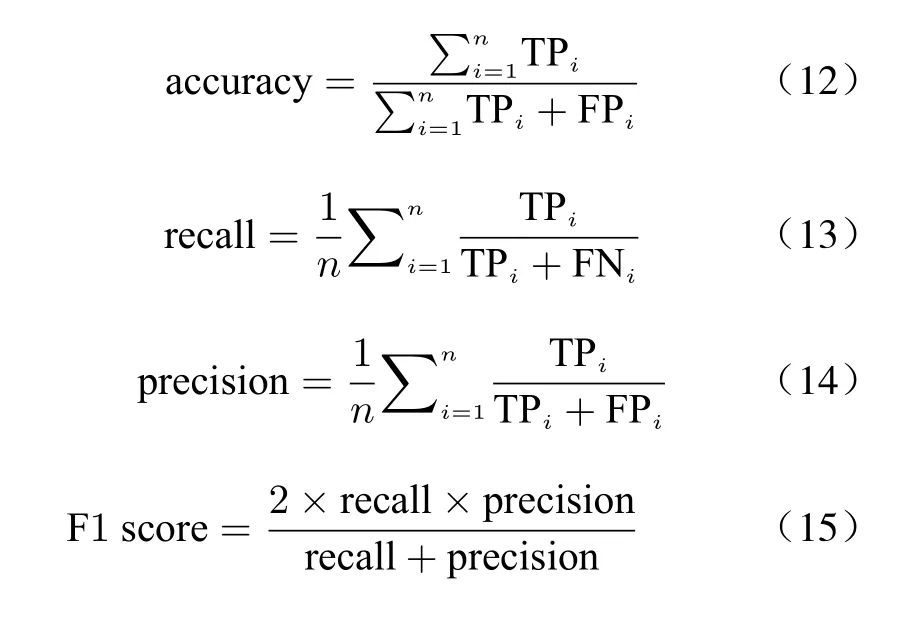
where TP indicates the correct prediction result,FP indicates that other categories are wrongly classified into this category, and FN indicates that this category is wrongly classified into other categories.
3 Experiments and Results
3.1 Data Source
The data used in this study was collected, ana−lyzed and open−sourced by Meyer et al. from Uni−versity College London and Wellcome Sanger Institute [28]. Detailed information are listed in Tab. 2.
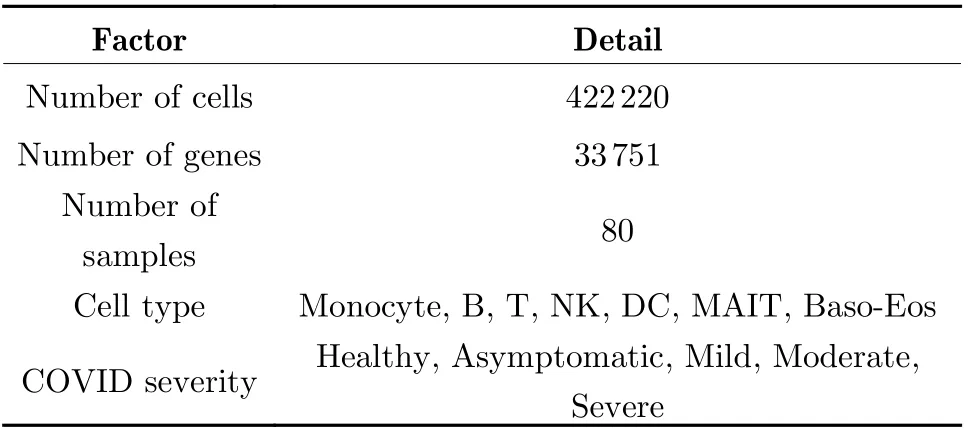
Tab. 2 Information of COVID-19 data used in this work
The data is randomly sampled and divided into training set, validation set and test set according to the ratio of 6 : 2 : 2. The three data−sets were independently processed through the same feature extraction method and then con−verted into the format consistent with the model input. The training of the model was carried out in a supervised manner, while introducing early stop mechanism by validations after every epoch.Finally, the model was tested on the test set whose distribution was never involved in the training process.
3.2 Experiments on Effectiveness
To verify the effectiveness of feature and model structure design, all components are split into different configurations. Specifically, the tests in this section include the model we developed(denoted as proposed), other methods like ItClust and Moana, a total of four combinations of two features and two input layer encoders,denoted as diff+attn, diff+gru, highly+attn and highly+gru. The accuracy, recall, precision and F1 scores of the two classification tasks are shown in Tab. 3 and Tab. 4. Because of the pro−posed feature extraction method, the subsequent model only had to calculate sequence of marker genes rather than the entire count matrix, thus leading to an obvious advantage in efficiency.The information on runtime and the platform are presented in Tab. 5 and Tab. 6, respectively. In general, the proposed model achieved better per−formance due to the comprehensive use of the two features. As for the selection of features and encoders, the differential gene features are more suitable for multi−head attention encoders, while the high−expression gene features match GRU encoder.
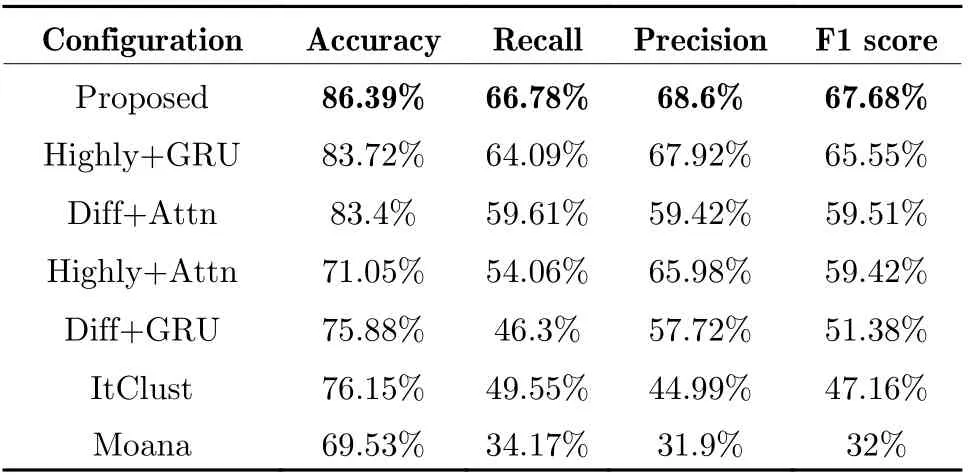
Tab. 3 Comparison of performance in disease status prediction of COVID-19 data
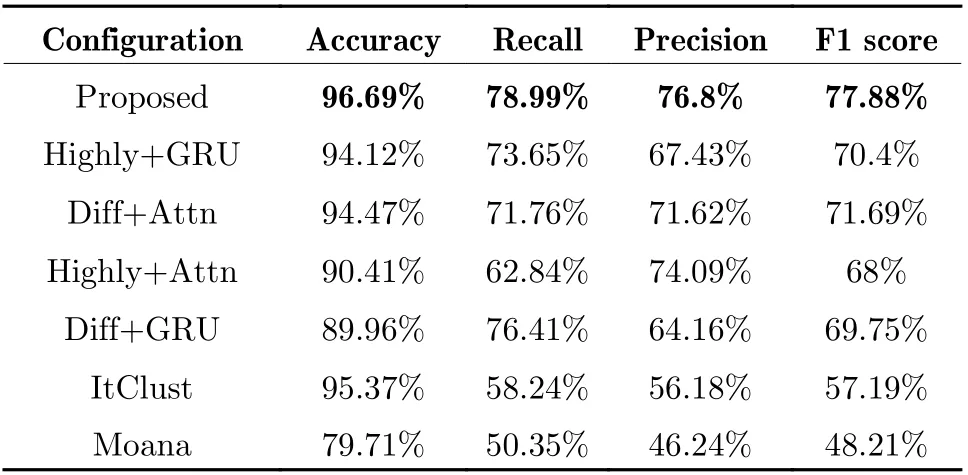
Tab. 4 Comparison of performance in cell type prediction of COVID-19 data

Tab. 5 Runtime of different models

Tab. 6 Information of hardware platform
3.3 Experiments on Robustness
Although the distribution of human peripheral blood RNA sequencing data is theoretically com−mon, the smaller the number of sequencing, the more difficult it is to reflect the real situation of peripheral blood samples. We use random down−sampling to introduce deviation to the distribu−tion of the test data. The proposed test set were randomly divided into equal parts (The number of samplings is denoted as div, whose value ranges from 1 to 12). As the sampling factor grows, the performance of all models inevitably decreases due to the increasing deviation, as shown in Fig. 5. It can be seen that the high expression features are less affected by the scale of down−sampling, while the differential expres−sion features are more sensitive. The proposed model surpassed all other models when the down−sampling factor was less than 6. When the factor was greater than 6, it showed competitive perfor−mance with settings denoted as Highly+Attn and Highly+GRU.
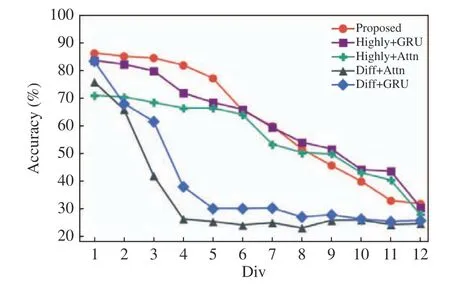
Fig. 5 Variance in accuracy with number of cells
The following experiments simulated changes in number of high variance genes (denoted as hvg, whose value ranges from 250 to 5 000),whose results are shown in Fig. 6. It can be seen that the overall accuracy of the model first increases and then decreases as hvg changes, and the best effect is obtained when hvg=2 000.Additionally, hvg changes have greater impacts on high expression features, and the proposed model obtained better performance than all other settings.
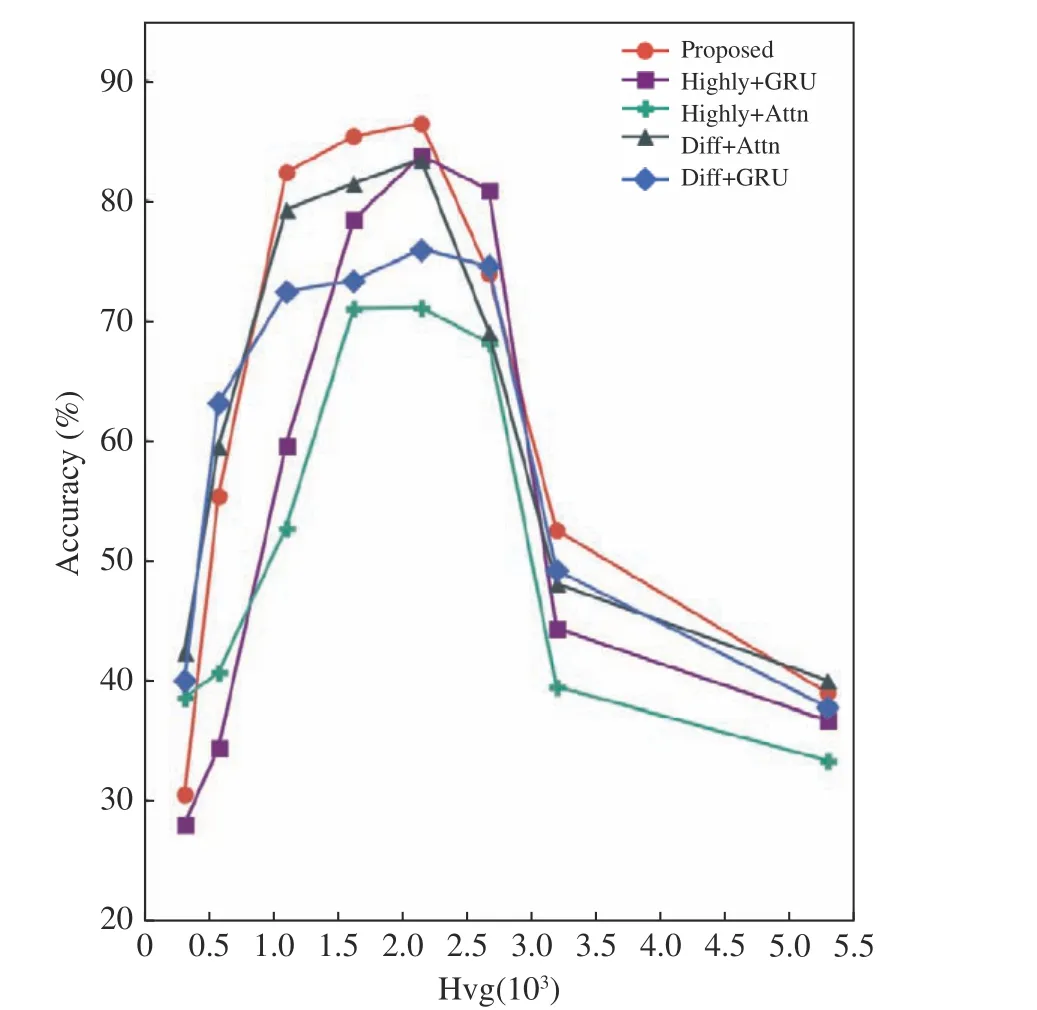
Fig. 6 Variance in accuracy with number of high variance genes
4 Conclusion
In this work, we proposed a feature extraction method and the corresponding deep learning neu−ral network to solve the practical difficulties in scRNA−seq data processing. By introducing dif−ferential expression features and high expression feature, the model integrated gene expression characteristics at different resolutions, which is proven beneficial to the downstream analysis.Two classification tasks were conducted on the up−to−date COVID−19 data, statuses of disease were well predicted with the accuracy of 86.39%and the F1 score of 66.78%, and cell types were well predicted with the accuracy of 96.69% and the F1 score of 78.99%. Performances of this pro−posed method surpassed those based on feature projection. Owning to its ability and robustness in feature extraction, the proposed pipeline is believed to have the potential to be imple−mented in many other scenarios such as diagnos−tics and precision therapy. Furthermore, we also look forward to its extension and transplanta−tion on scATAC−seq or spatial transcriptome data.
杂志排行
Journal of Beijing Institute of Technology的其它文章
- Application of Micro Electro Mechanical System(MEMS) Technology in Photoacoustic Imaging
- A New Class of Biodegradable Organic Optoelectronic Materials: α-Oligofurans
- Design of Implant Prosthesis for Bone Injury Repair Considering Stress Shielding Effect
- A Microfluidic System with Active Mixing for Improved Real-Time Isothermal Amplification
- Mixing Dynamics and Synthesis Performance of Staggered Herringbone Micromixer for Limit Size Lipid Nanoparticles
- Effect of Auxiliary Gas Flow Parameters on Microstructure and Properties of Ta Coatings Prepared by Three-Cathode Atmosphere Plasma Spraying
