Comparison of ship-based CTD measurement of Circumpolar Deep Water in the Amundsen Sea based on World Ocean Database
2022-06-23HEHailunWUShouchang
HE Hailun & WU Shouchang
Comparison of ship-based CTD measurement of Circumpolar Deep Water in the Amundsen Sea based on World Ocean Database
HE Hailun*& WU Shouchang
State Key Laboratory of Satellite Ocean Environment Dynamics, Second Institute of Oceanography, Ministry of Natural Resources, Hangzhou 310012, China
We compare the characteristics of Circumpolar Deep Water (CDW) in the Amundsen Sea based on Conductivity-Temperature-Depth (CTD) records in the World Ocean Database. There are considerable numbers of ship-based CTD casts in the year 1994, 2000, 2007 and 2009. After confining temporal- and spatial- windows, several stations are emerged as having at-least two casts in different years. The comparisons show that the CDWs turn warmer and salter on shelf and near ice shelf. The results therefore describe the geographic differences of CDW changes, and exhibit rareness of ship-based CTD survey in the Amundsen Sea.
Circumpolar Deep Water, Amundsen Sea, Conductivity-Temperature-Depth
1 Introduction
Amundsen Sea (AS) is a marginal sea in the Southern Ocean, where the ice shelf suffers rapidly basal melting (Rignot et al., 2019). Satellite images support the ice coverage trend is obviously negative in the satellite era (Parkinson, 2019). Ice melting in the AS exerts global impact on the sea level change (Mercer, 1978). Compared with atmospheric forcing, the ice melting is most likely to be forced by underlying warm water (Shepherd et al., 2004; Jacobs et al., 2011).
Considering the Amundsen Sea Shelf (ASS) as a soly unit, the boundary thermal forcing is mainly provided by the warm Circumpolar Deep water (CDW). The input and output of CDW into the ASS and the related net heat exchange supply energy to ice melting. The intrusion of the CDW to the ASS is partly caused by surface wind forcing near the shelf break (Kim et al., 2021). The thermohaline definition of CDW is>1°C (is thetemperature), and>34.6 psu (is practical salinity; Klinck et al., 2004). Similarly, the thermohaline definition can be also presented by potential temperature () and absolute salinity (SA; Assmann et al., 2019), as>1°C and>34.85 g∙kg−1. The upper CDW (UCDW) is characterized by a temperature maximum where the potential density is nearly 27.72 kg∙m−3. Lower CDW (LCDW) is related to a salinity maximum (roughly 34.74 psu) at the potential density layer of 27.8 kg∙m−3.
On the seasonal scale, the seal-borne tag CTD reveals that the seasonal variation of CDW in Eastern Trough (ET) is significant (Mallett et al., 2018). Winter CDW in ET is thicker than summer CDW. Heat content of CDW layer in winter is higher than that in summer. The season variation shows geographic difference. For instance, the seasonal variation of CDW in Pine Island Bay (PIB) is not significant.
On the lower frequency, the comparison of ship-based CTD between the year 1994 and 2009 indicates the temperature of CDW turns warmer in the PIB, and the heat content also increases (Jacobs et al., 2011). Using the machine learning technique (Boehme and Rosso, 2021), the variability of CDW is relatively high in the off-shelf, ET and Central Trough (CT).
Obtaining the CTD profiles in ASS mainly depends on two platforms, i.e. seal-tag CTD and ship-based CTD. The precision and vertical resolution of seal-tag CTD are considerably lower than ship-based CTD (Mallett et al., 2018). The reported precision of seal-tag CTD is roughly 0.03°C for temperature and 0.05 psu for practical salinity. Besides, due to date compression of seal-tag CTD, the vertical resolution is 18 depth levels per cast, which implies the vertical resolution is coarser than 20 m if the column thickness of cast measurement exceeds 360 m. In contrast, the ship-based CTD typically has 10 Hz higher frequency (typically less than 0.1 m in vertical resolution), and the precision is roughly 0.0001°C for temperature and 0.002 psu for practical salinity, respectively. Therefore, data quality of ship-based CTD is more reliable than seal-tag CTD on describing CDW.
Due to the limited ship-based CTD observation, the variance of CDW leaves a large room to be understood. The problems of previous studies are exposed as the definitions of CDW are not same. The variables can depend on isothermal line, vertical temperature maximum, isopycnal layer or neutral density layer. For instance, the isotherm is defined as upper boundary of CDW (Mallett et al., 2018). Neutral density also defines the column of CDW (Whitworth et al., 1998; Assmann et al., 2019). Meanwhile, systematic study of updated public datasets on AS CDW has not yet reported. Therefore, we investigate the spatial and temporal distributions of ship-based CTD casts in the AS, and compare the profiles of CDW at possible stations.
2 Material
World Ocean Database (WOD) is a global ocean dataset, which is provided by National Oceanic and Atmospheric Administration (https://www.ncei.noaa.gov/products/world- ocean-database). Figure 1 shows the spatial distribution of ship-based CTD in the WOD, where the RTOPO-2 topography (Schaffer et al., 2016) is used. In general, the ship-based CTD mainly locates at the front of ice shelf, on the shelf and slope.
The temperature-salinity diagram shows that there are at-least three water masses as CDW, Winter Water (WW) and Antarctic Surface Water (AASW; Figure 2). The maximum temperature approaches 2.0°C, which suggests CDW contains considerable heat content. The curve around CDW also shows the maximum temperature point in the temperature-salinity diagram, which indicates the core of CDW.
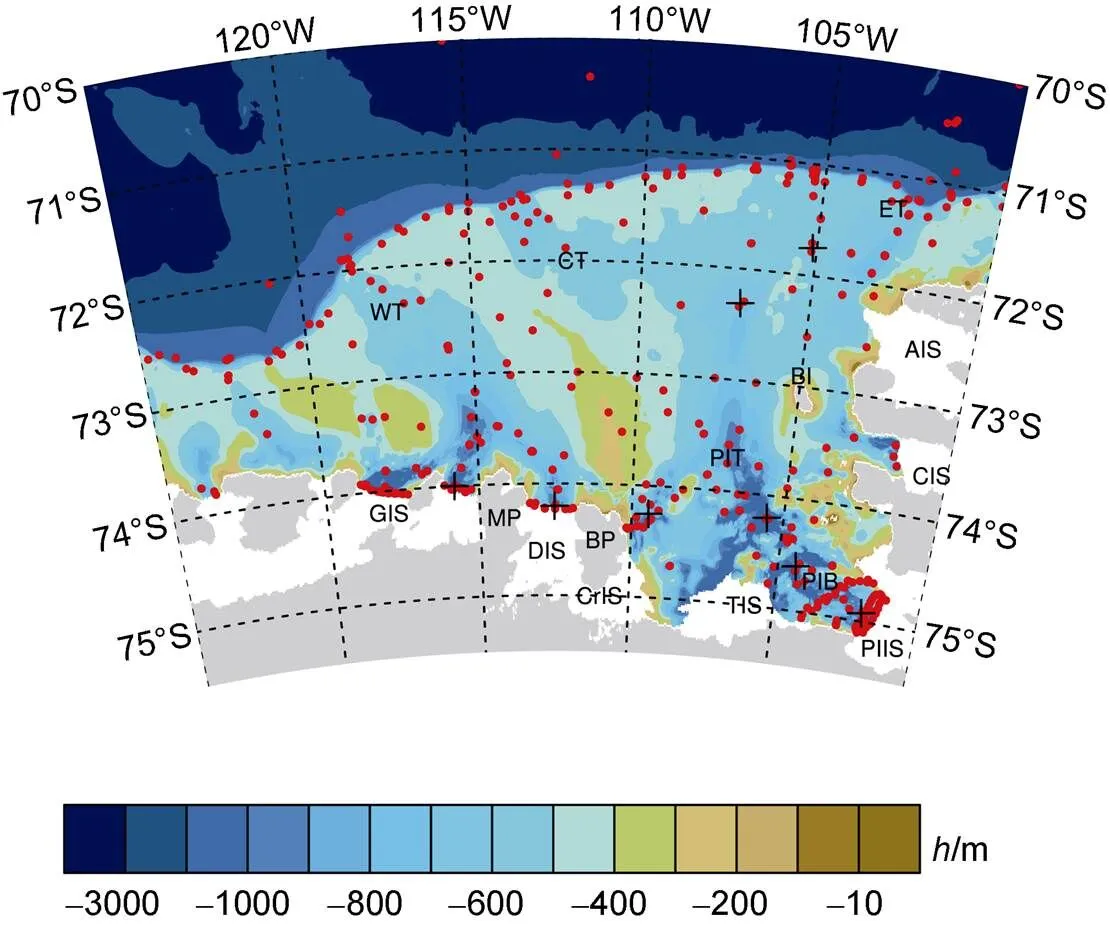
Figure 1 Topography of Amundsen Sea (RTOPO2;) and locations of ship-based CTD casts from World Ocean Database (2018). PIIS=Pine Island Ice Shelf, PIB=Pine Island Bay, PIT= Pine Island Trough, TIS=Thwaites Ice Shelf, AIS=Abbot Ice Shelf, CIS=Cosgrove Ice Shelf, CrIS=Crosson Ice Shelf, DIS=Dotson Ice Shelf, GIS=Getz Ice Shelf, ET=Eastern Trough, CT=Central Trough, WT=Western Trough, BP=Bear Peninsula, MP=Martin Peninsula, and BI=Burke Island.
Figure 2 Temperature-salinity diagram for all CTD stations in the Amundsen Sea.nis the neutral density.
In present study, we use two surfaces of CDW asn=28.0 and 28.27. The upper surface roughly overlay with isopycnal layers in the range of0= 27.7 to 27.75 (0is the potential density), while the lower surface is close to the isopycnal layer0=27.85. The temperature of upper surface is mainly larger than 0.5°C, which shows the upper surface captures the warm characteristic of CDW. Overall, the upper surface is above the core of CDW (temperature maximum), although the upper surface approaches the core of CDW in some stations. It is worthy to mention that some casts, which show significantly biased salinity for CDW, are not used. Meanwhile, for the lower surface of CDW, because the neutral density at the maximum depth of cast is always lower than the definition (n=28.27), we use the maximum depth of cast as lower surface of CDW in computing the CDW column averaged variables (temperature and salinity, Table 1).
We further plot the spatial distributions of yearly samples in Figure 3. The intensified CTD measurements were implemented in 1994, 2000, 2007 and 2009. The yearly ship-based CTD samples are reported as followings:
(1) In 1994, samples located sparsely in Getz Ice Shelf (GIS), Pine Island Ice Shelf (PIIS), ET, CT and Western Trough (WT). According to the information of CTD records, most of these casts (40 out 43) were conducted by Lamont-Doherty Geological Observatory, United States, and the cruise was. The other three casts were carried out by Germany, and the ship name was.
(2) In 2000, the survey was mainly conducted in PIIS, Bear Peninsula (BP), Dotson Ice Shelf (DIS), GIS, ET, CT and slope. All 82 casts were observed by Lamont-Doherty Geological Observatory, United States, and cruise was.
(3) In 2007, the distribution of stations is similar to year 2000, although the activity is intensified. The samples were conducted by United States, and the institute is Lamont-Doherty Geological Observatory. These records were based on.
(4) In 2009, the stations looked like those in 2000 and 2007, however the number of samples was relatively larger in the PIIS, but decreased in the BP. All 156 casts were implemented by Lamont-Doherty Geological Observatory, United States, and cruise was.
When compared the locations of all stations, several valuable stations are selected as shown in Figure 1 and Table 1. We will later discuss the records respectively (Section 3).

Table 1 Characteristics of CDW for different years. h is the water depth. zu is the depth of upper surface of CDW, and θ and S are the corresponding potential temperature and practical salinity. dz is the thickness of CDW,andare the mean potential temperature and practical salinity of CDW respectively. The water depth h is adopted from RTOPO2. D in the ID column indicates the difference between two casts.
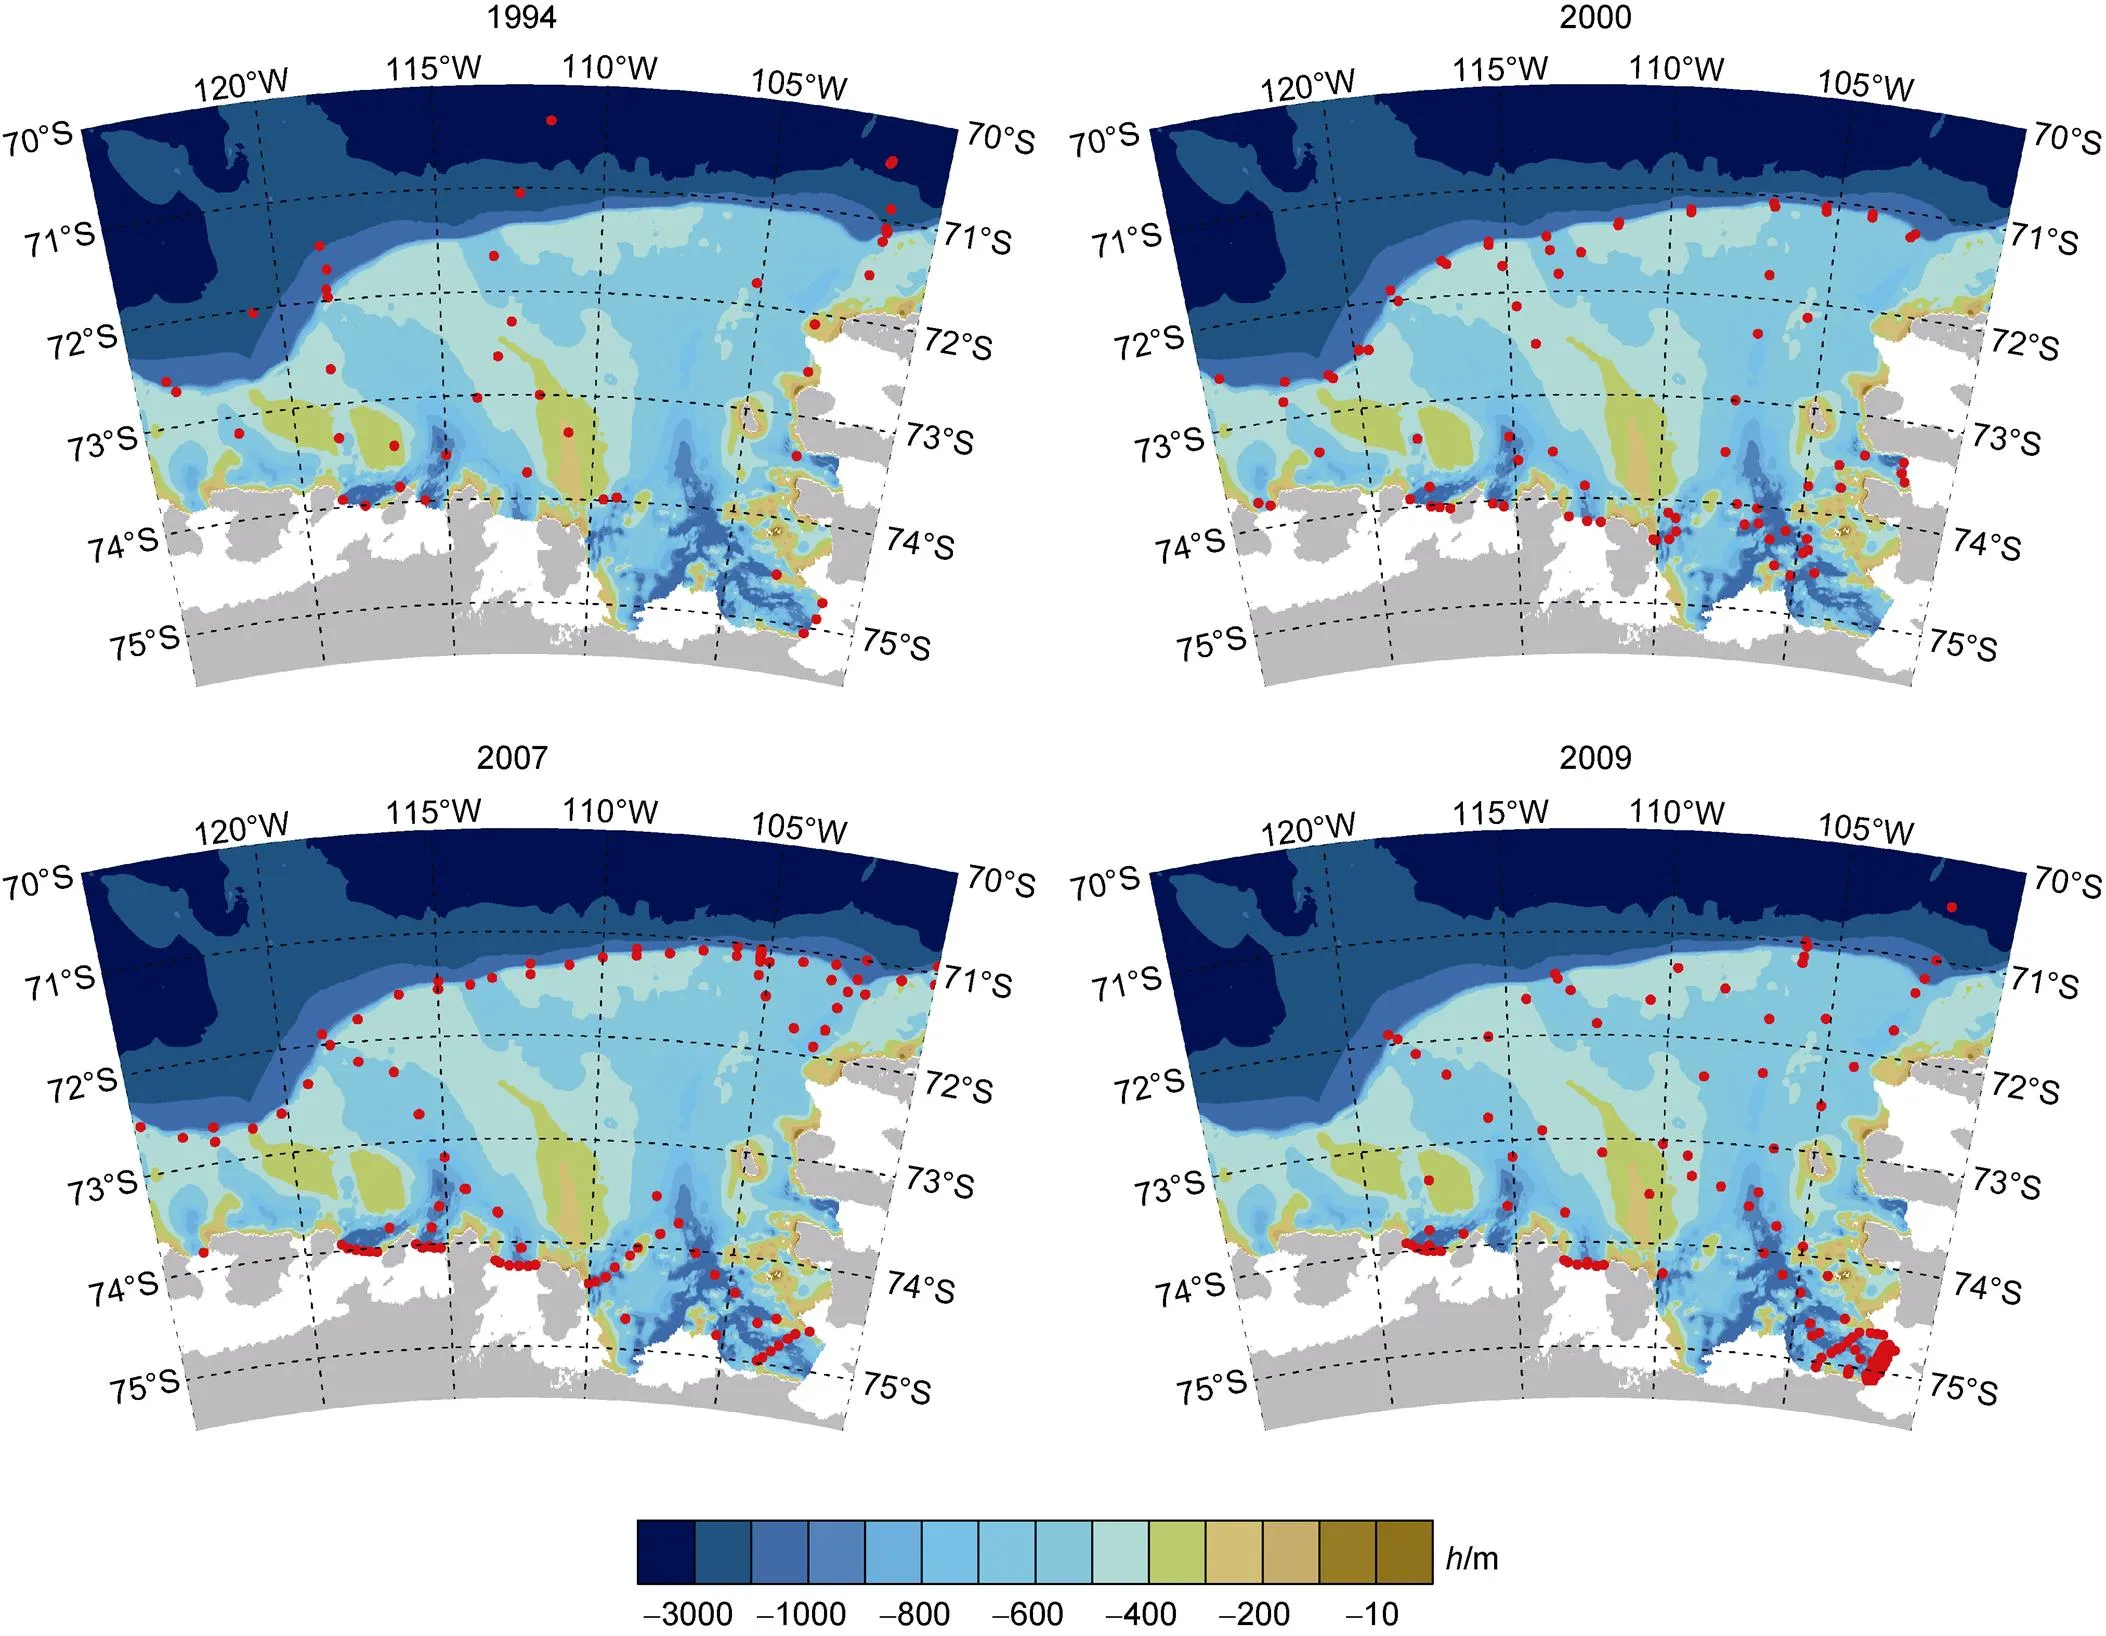
Figure 3 Spatial distribution of yearly CTD casts in the Amundsen Sea. Color shading shows the topography ().
3 Results
3.1 Water mass near ice shelf
3.1.1 PIIS
In PIIS, one station as 74.93°S, 101.95°W is selected (Figure 4 and Table 1). The water depths are in the range of 600 to 1000 m. The first survey time was March 1994, while the later time was 15 years later (January 2009). For the spatial distribution, the cast in 1994 was on the front of PIIS. A sample in January 2009 located closely with initial cast in 1994. Comparing these two closely-distributed casts, pair profiles show the upper neutral density surface deepens from 605 to 635 m. Correspondingly, the temperature has increased by 0.162°C. For the vertical mean of CDW layer, the temperature has increased by 0.14°C. The corresponding salinity changes are relatively weak (less than 0.02 psu). Meanwhile, the samples in January 2009 show consistent temperature-salinity diagram.
3.1.2 BP
For the station at northeast of BP (74.25oS, 109.45oW; Figure 5), there are five historic casts. The earlier three casts were in March 2000, the latter two casts were in February 2007. The water depths of these casts are in the range of 600 to 1000 m. The casts in February 2007 show warmer and salter CDW than earlier casts in March 2000. The increment of temperature (salinity) at upper layer of CDW attains 0.345°C (0.039 psu; Table 1).
3.1.3 DIS
For the station close to the DIS (74.20oS, 112.55oW), eight casts are recorded in the WOD (Figure 6). The earlier one cast was in March 2000, the later four casts were in February 2007, the following one cast was in December 2007, and the last two casts were in February 2009. The casts in March 2000 locate on front of DIS. On the TS diagram (Figure 6b), the casts in year 2007 show warmer and salter CDW than initial cast in year 2000. On the profiles, the significant changes of temperature and salinity of CDW are observed as compared with initial March 2000 cast. The temperature of upper layer of CDW increases 0.476°C. The salinity of upper layer turns salter from 34.489 (March 2000) to 34.546 psu (February 2007), and the increment attains 0.057 psu. It is also worth noting that between the February 2007 and 2009, the temperature difference is not negligible as well (Figure 6), which implies the inter-annual variation is probably not negligible.
3.1.4 GIS
For the station close to the GIS (74.00oS, 115.80oW), there are six historic casts (Figure 7). The earlier one cast was obtained in March 1994, the following cast was in March 2000, the later four cast were in February 2007. The primary characteristics of initial cast (March 1994) is cooler and fresher. The depth of upper layer is 825 m in March 1994. The temperature of upper layer of CDW is −0.146°C in March 1994, and the salinity is 34.485 psu. Later in March 2000, the depth of upper layer move downward to 870 m. Compared with initial cast, the temperature of upper layer of CDW increases from −0.146 to 0.193°C (Figure 7c), and the salinity slightly increases from 34.485 to 34.525 psu (Figure 7d). The CDW in February 2007 turns warmer and salter than that in March 2000. The differences of temperature and salinity of upper layer of CDW are 0.594°C and 0.057 psu between February 2007 and March 1994.
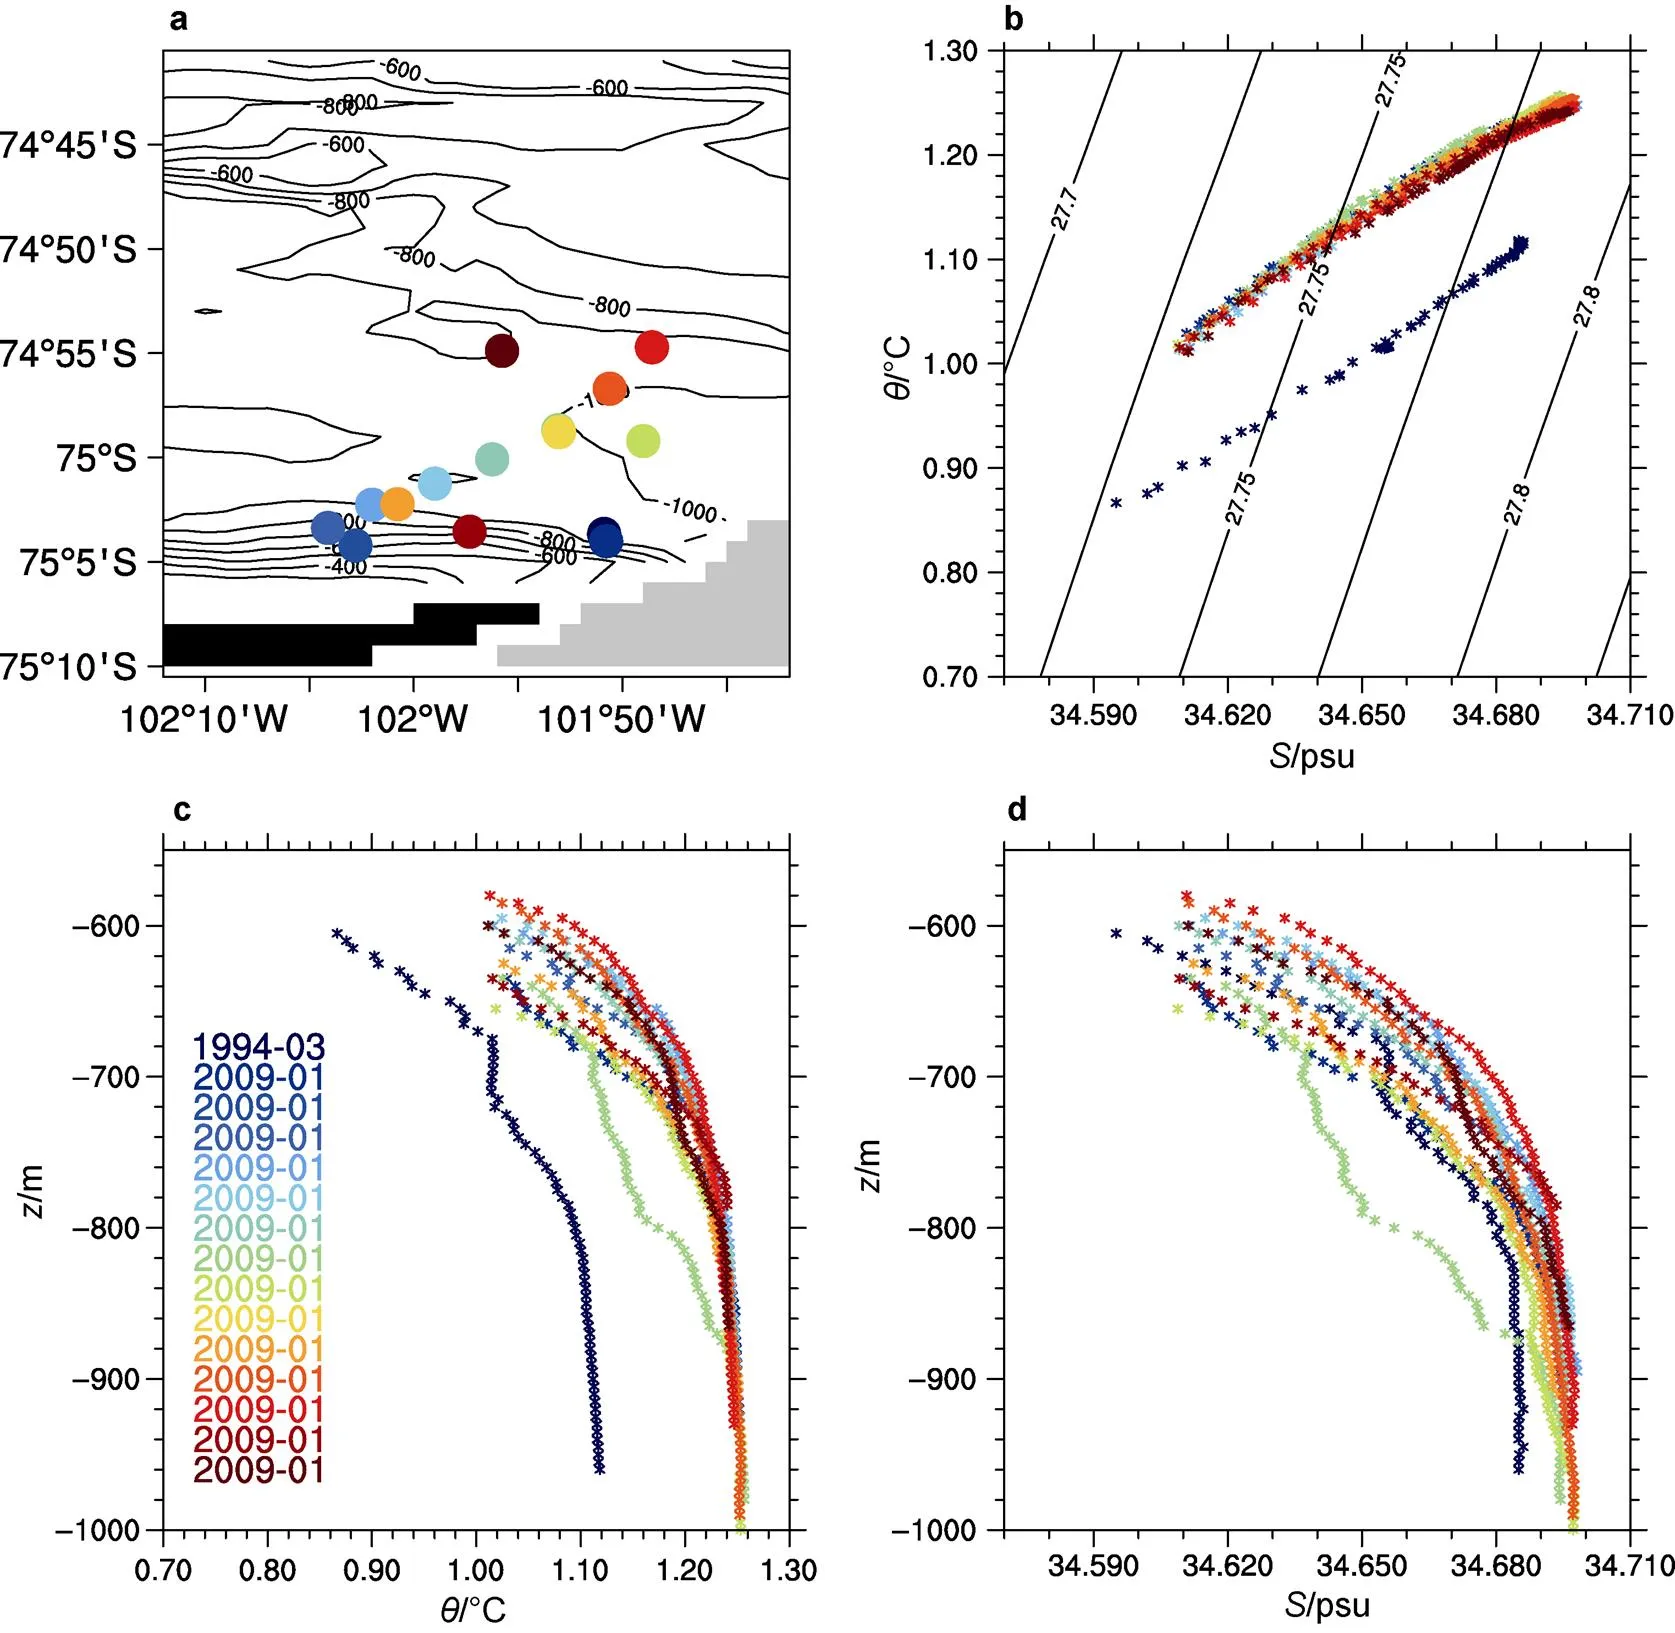
Figure 4 CTD records at PIIS station (74.93oS, 101.95oW) in the Amundsen Sea. a, Topography. Black fill represents land, grey fill shows ice shelf; b, Temperature-salinity diagram; c–d, Profiles of temperature and salinity.
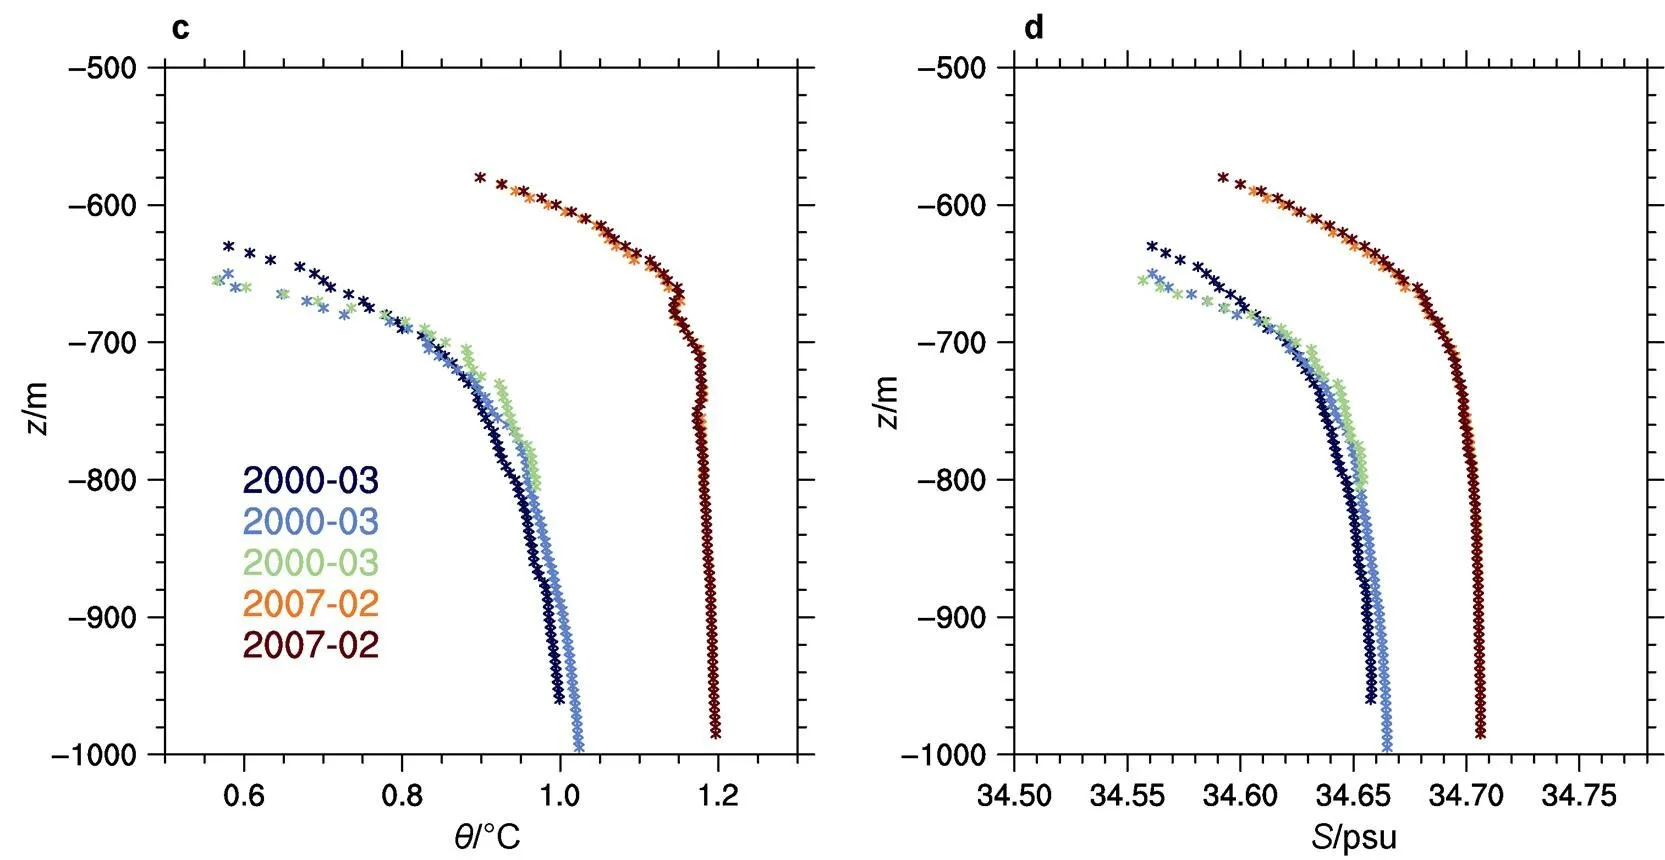
Figure 5 CTD records at BP station (74.25oS, 109.45oW) in the Amundsen Sea. a, Topography; b, Temperature-salinity diagram; c–d, Profiles of temperature and salinity.
Figure 6 CTD records at DIS station (74.20oS, 112.55oW) in the Amundsen Sea. a, Topography. Grey fill shows ice shelf; b, Temperature-salinity diagram; c–d, Profiles of temperature and salinity.
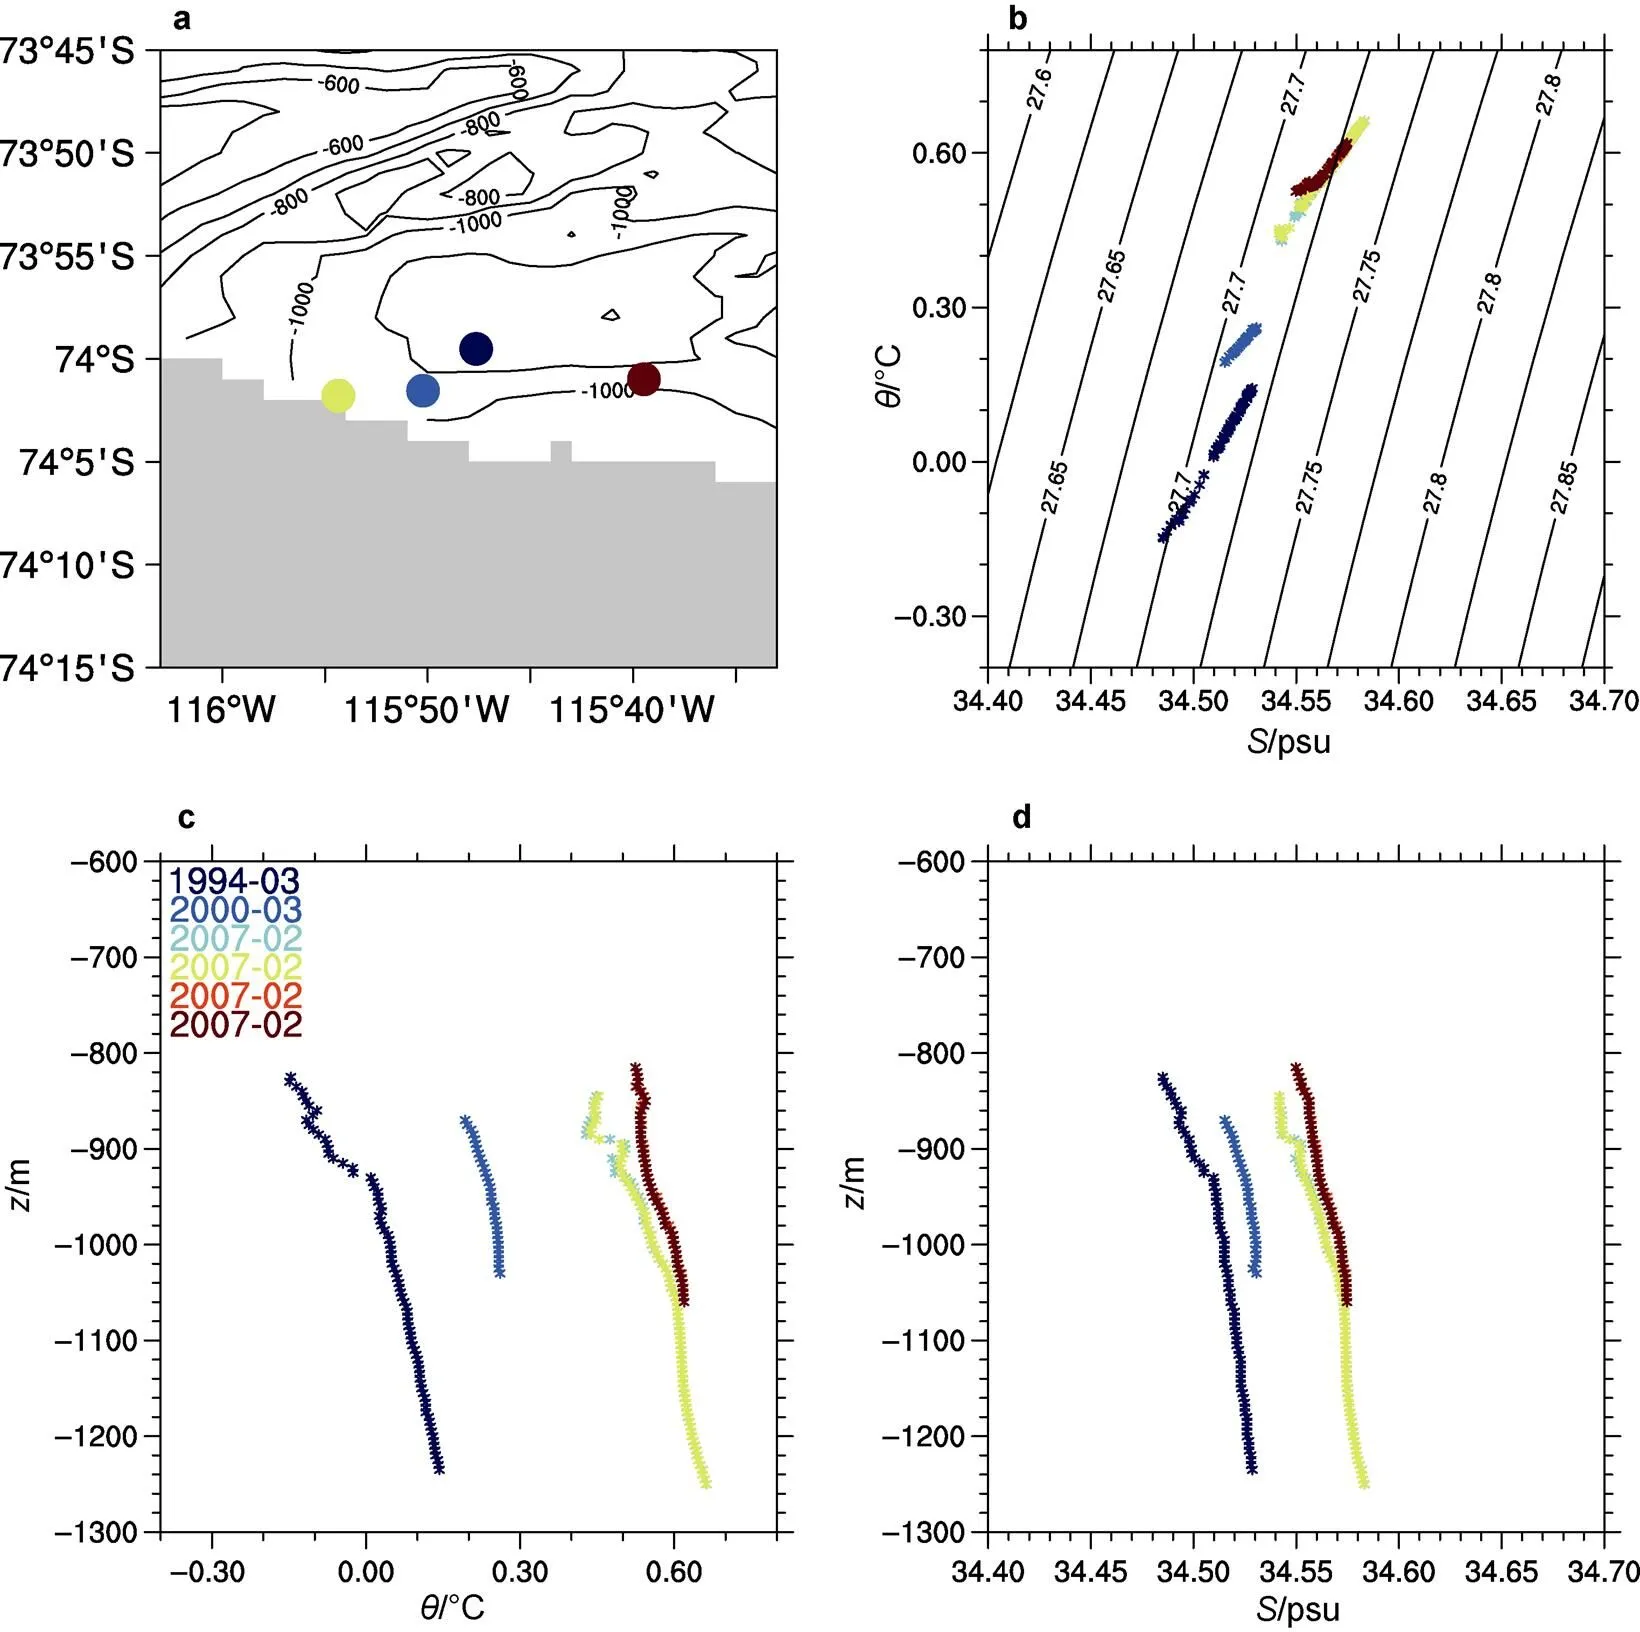
Figure 7 CTD records at GIS station (74.00oS, 115.80oW) in the Amundsen Sea. a, Topography. Grey fill shows ice shelf; b, Temperature-salinity diagram; c–d, Profiles of temperature and salinity.
3.2 Water mass on shelf
3.2.1 PIT
For the station 74.60oS, 104.40oW (Figure 8), which is located in southeast of PIT, two casts on March 2003 and January 2009 were recorded. The later cast shows warmer CDW than earlier cast. On the profiles, on the upper layer of CDW, the salinity of later cast is salter than that of earlier cast.
Similarly, the station 74.20oS, 105.55oW exists four historic records (Figure 9). The earlier cast was in March 2000, the latter two cast were in February 2007, and the last cast was in January 2009. The casts in years 2007 and 2009 show warmer and salter CDWs than the former cast in year 2000.
3.2.2 ET
For the station around the outer shelf of ET (71.75oS, 105.12oW), two historic records exist. The earlier cast was in February 1994, and the later cast was in February 2009. The casts were in the same month, but exhibited long time gap as 15 years. The year 2009 cast shows slightly warmer CDW (increasing 0.031°C), and the water turns a little salter follows the time evolution (increasing 0.018 psu; Table 1 and Figure 10).
For the station close to the ET (72.31oS, 107.05oW), there are two historic casts (Figure 11). The earlier cast was in March 2000, and the later cast was in February 2009. The cast in year 2009 shows warmer and salter CDW than earlier cast in year 2000. The depth of upper layer of CDW is lifted shallower in 2009 (480 m) than 2000 (560 m). The water temperature and salinity of upper layer increase 0.458°C and 0.051 psu from 2000 to 2009, respectively. However, the temperature and salinity changes of mean CDW column are relatively weak (0.243°C for temperature and 0.029 psu for salinity; Table 1).
4 Discussion
The results near the ice shelf are physical sounding, as the near-bottom water at the front of ice shelf changes warmer and salter continuously. However, the thermal forcing of CDW on ice melting depends on the difference between inflow and outflow of CDW, which is not involved in present study. The fresh water due to ice melting does not decrease the salinity of underlying CDW, and the results suggest the ice-melting water is confined in upper layer, and the ocean circulation related to CDW probably impose steady forcing on the basal ice shelf.
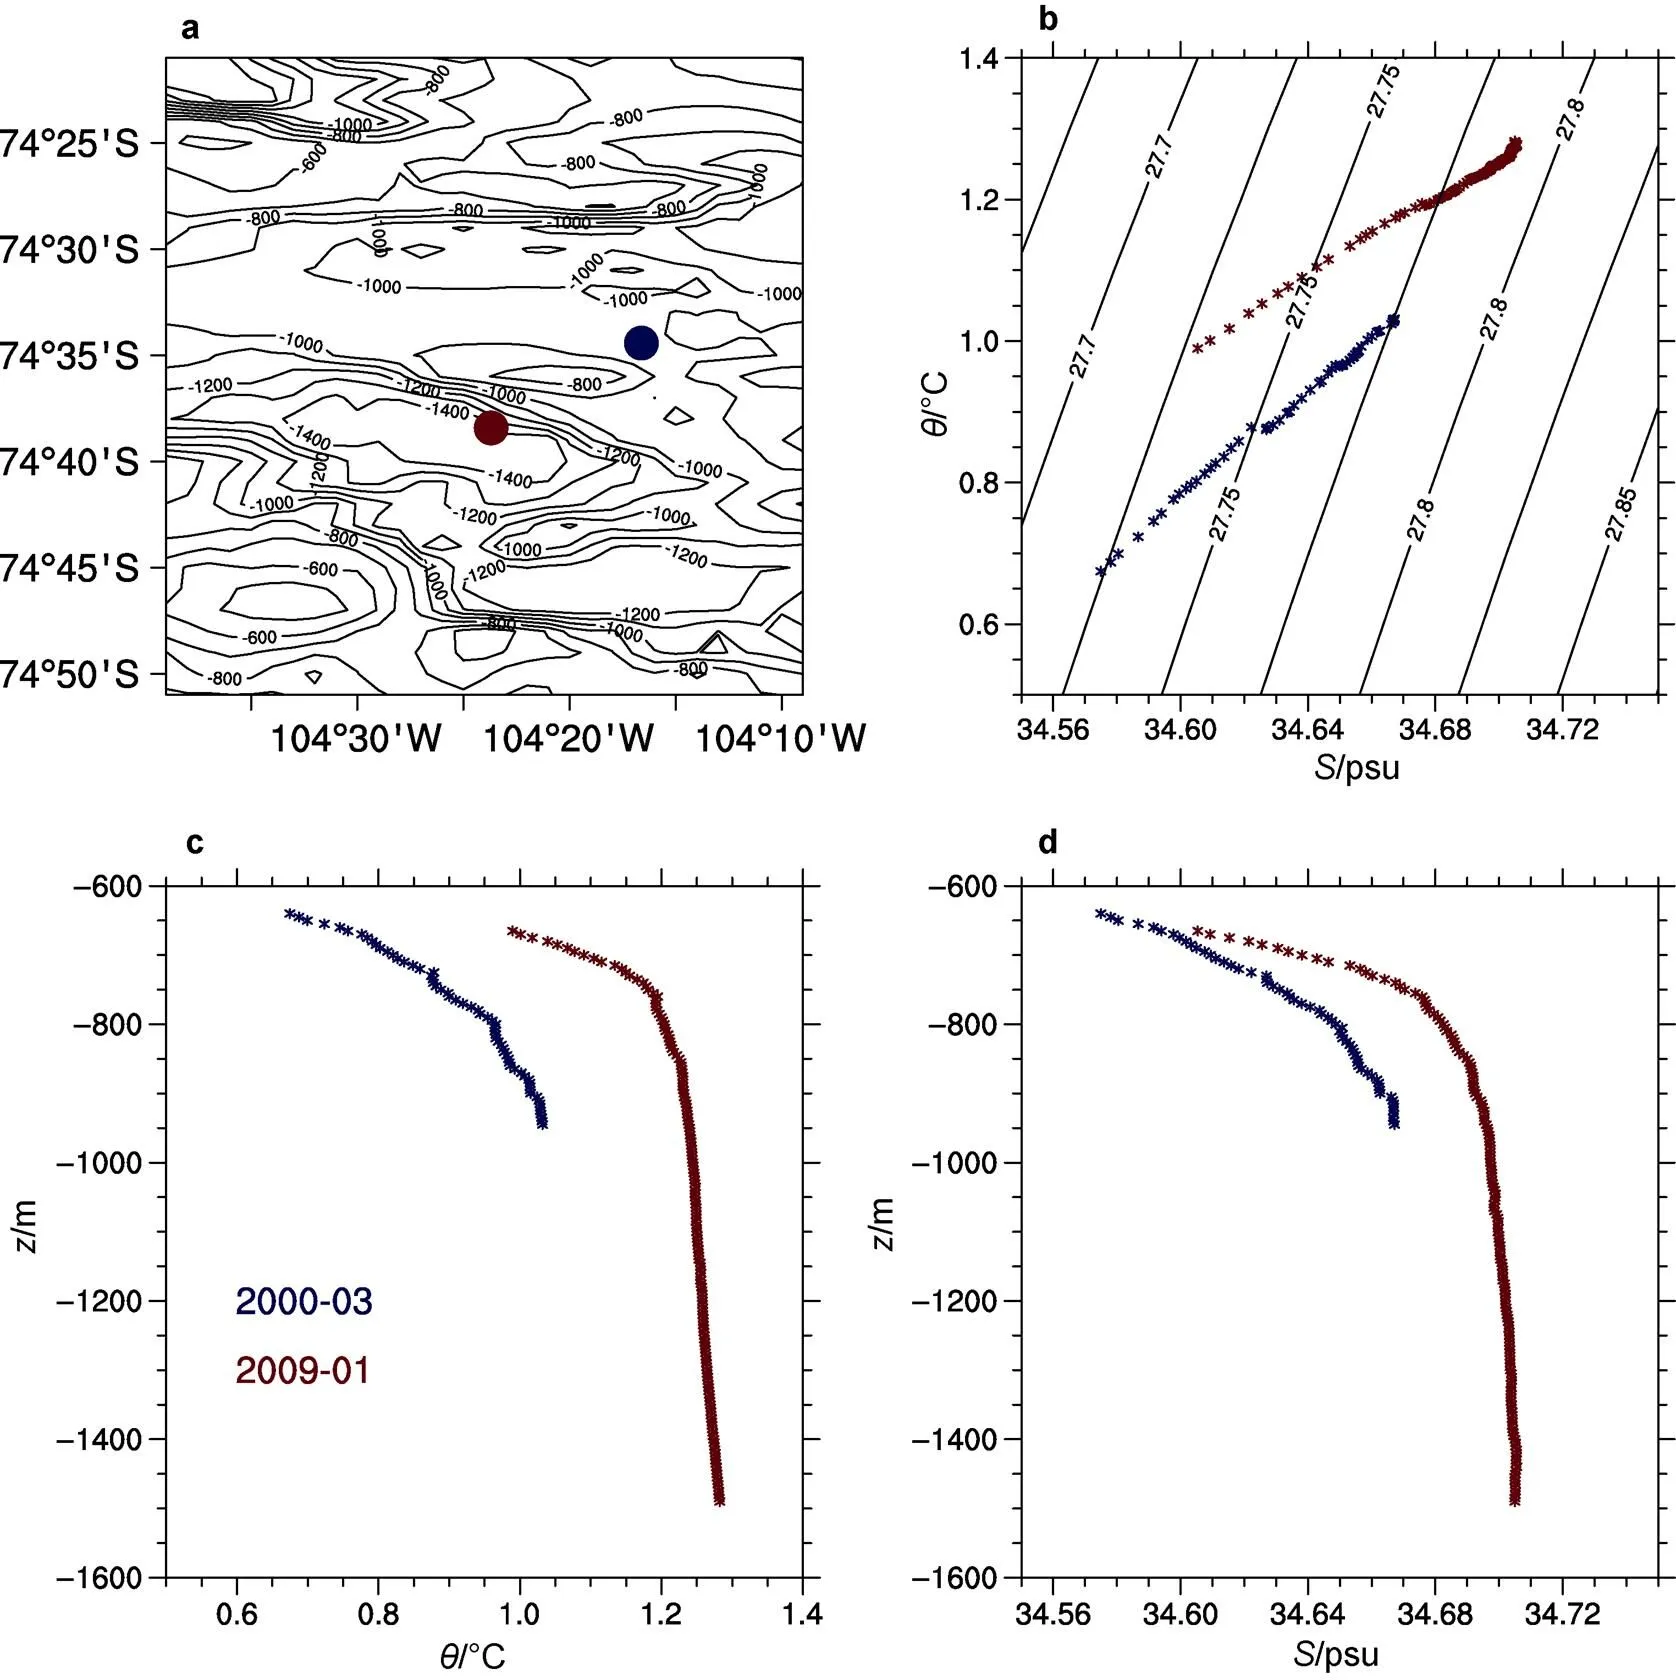
Figure 8 CTD records at PIT station (74.60oS, 104.40oW) in the Amundsen Sea. a, Topography; b, Temperature-salinity diagram; c–d, Profiles of temperature and salinity.
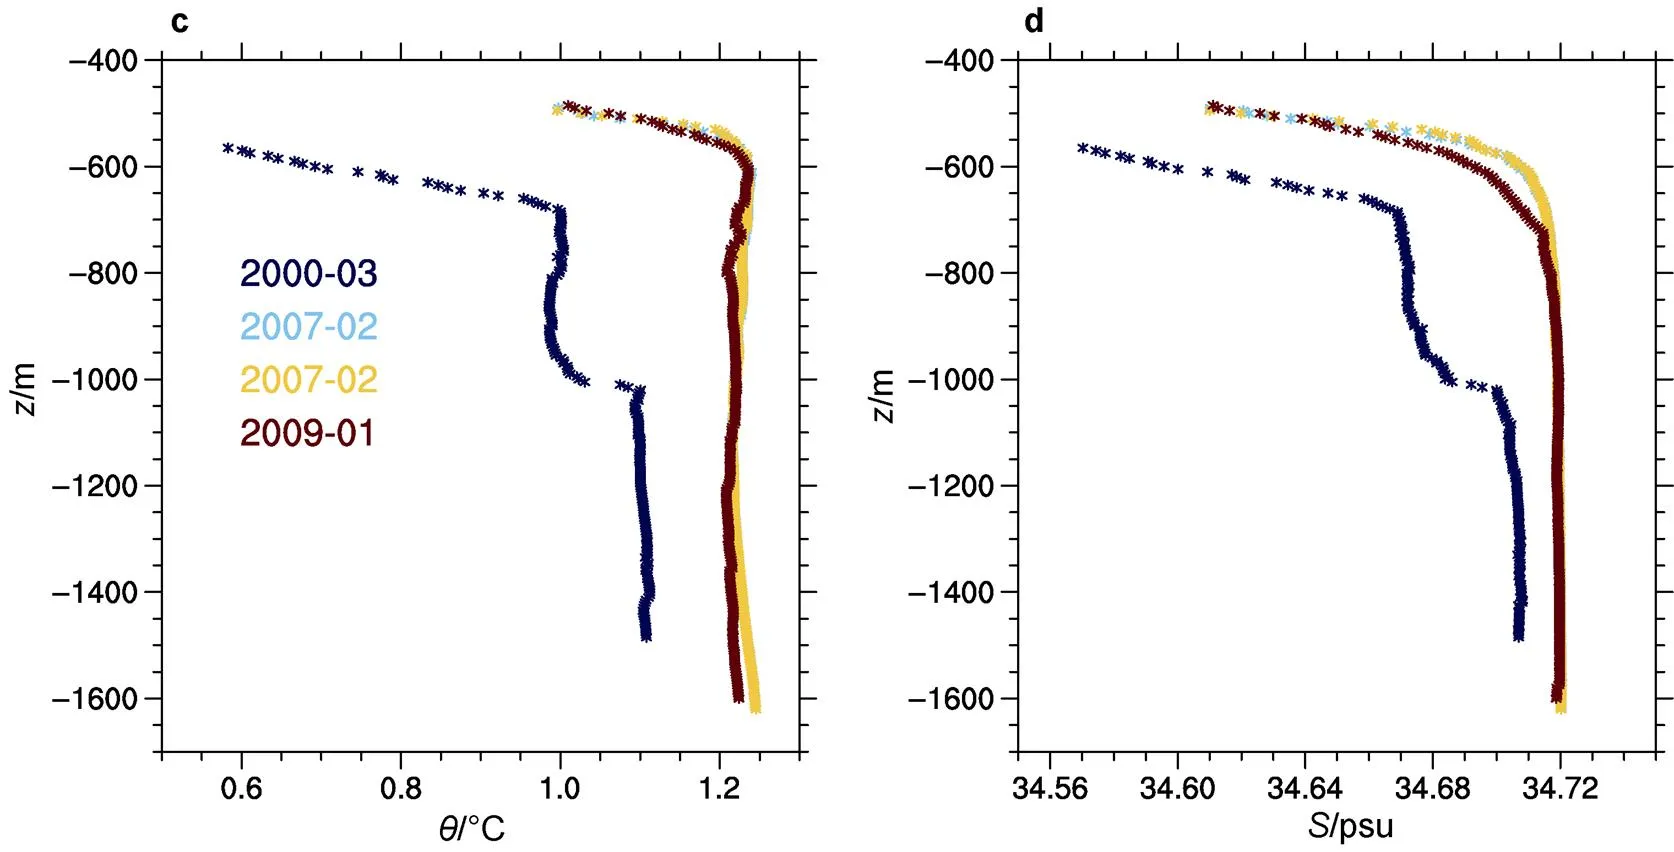
Figure 9 CTD records at PIT station (74.20oS, 105.55oW) in the Amundsen Sea. a, Topography; b, Temperature-salinity diagram; c–d, Profiles of temperature and salinity.
Figure 10 CTD records at ET station (71.75oS, 105.12oW) in the Amundsen Sea. a, Topography. The topography is as flat as −500 m; b, Temperature-salinity diagram; c–d, Profiles of temperature and salinity.
Figure 11 CTD records at ET station (72.31oS, 107.05oW) in the Amundsen Sea. a, Topography; b, Temperature-salinity diagram; c–d, Profiles of temperature and salinity.
5 Conclusions
CDW is a water mass which directly supplies thermal energy to ice shelf basal. This paper focuses on the change of CDW based on reliable CTD profiles. The data are provided by WOD, and the prominent number of records were operated in year 1994, 2000, 2007 and 2009. After imposing a suitable spatial window, CTD profiles are comparable in some nearly-same locations.
In the Ice Shelf region, there are considerable number of records in the GIS. The initial cast (March 1994) exhibited cooler and fresher water. Later in March 2000, the temperature of upper layer of CDW increased from initial −0.146°C to 0.193°C. The CDW in February 2007 further turns warmer and salter than those in March 2000. As a result, the temperature (salinity) increases 0.594°C (0.057 psu) from 1994 to 2007. The waters also turn warmer and salter in the PIIS, BP and DIS around Ice Shelf region.
On the shelf, the CDW is also found warmer and salter on PIT and ET. The most significant change is found on ET (72.31oS, 107.05oW), where the temperature of upper layer of CDW increased 0.46°C from 2000 to 2009, the corresponding salinity increased 0.05 psu. Furthermore, the depth of upper layer of CDW is also lifted up from 560 to 480 m, and the thickness of CDW also varies.
Although the stations look sparse, the results highlight the impact of climate change, as the waters both near Ice Shelf and on shelf are most likely turn warmer and salter. Considering the data quality of ship-based CTD casts are more reliable than that of seal-tag CTD, these results provide essential information for the regional ocean study.
Acknowledgments This study was financially supported by National Polar Special Program “Impact and Response of Antarctic Seas to Climate Change” (Grant nos. IRASCC 01-01-01B, 02-01-02). We would like to thank two anonymous reviewers, and Guest Editor Prof. Jiuxin Shi for their valuable suggestions and comments that improved this article.
Note: This paper is a solicited manuscript of Special Issue “Marine Ecosystem and Climate Change in the Southern Ocean” published on Vol.33, No.1 in March of 2022.
Assmann K M, Darelius E, Wåhlin A K, et al. 2019. Warm Circumpolar Deep Water at the western Getz Ice Shelf front, Antarctica. Geophys Res Lett, 46(2): 870-878, doi:10.1029/2018GL081354.
Boehme L, Rosso I. 2021. Classifying oceanographic structures in the Amundsen Sea, Antarctica. Geophys Res Lett, 48(5): e2020GL089412, doi:10.1029/2020GL089412.
Jacobs S S, Jenkins A, Giulivi C F, et al. 2011. Stronger ocean circulation and increased melting under Pine Island Glacier ice shelf. Nat Geosci, 4(8): 519-523, doi:10.1038/ngeo1188.
Kim T W, Yang H W, Dutrieux P, et al. 2021. Interannual variation of modified circumpolar deep water in the Dotson-Getz Trough, West Antarctica. J Geophys Res: Oceans, 126: e2021JC017491, doi:10. 1029/2021JC017491.
Klinck J M, Hofmann E E, Beardsley R C, et al. 2004. Water-mass properties and circulation on the west Antarctic Peninsula Continental Shelf in Austral Fall and Winter 2001. Deep Sea Res Part II Top Stud Oceanogr, 51(17-19): 1925-1946, doi:10.1016/j.dsr2.2004.08.001.
Mallett H K, Boehme L, Fedak M, et al. 2018. Variation in the distribution and properties of circumpolar deep water in the eastern Amundsen Sea, on seasonal timescales, using seal-borne tags. Geophys Res Lett, 45(10): 4982-4990, doi:10.1029/2018GL077430.
Mercer J. 1978. West Antarctic ice sheet and CO2greenhouse effect: a threat of disaster. Nature, 271(5643): 321-325, doi:10.1038/271321a0.
Parkinson C. 2019. A 40-y record reveals gradual Antarctic sea ice increases followed by decreases at rates far exceeding the rates seen in the Arctic. PNAS, 116(29): 14414-14423, doi:10.1073/pnas.190655 6116.
Rignot E, Mouginot J, Scheuchl B, et al. 2019. Four decades of Antarctic Ice Sheet mass balance from 1979–2017. PNAS, 116(4): 1095-1103, doi:10.1073/pnas.1812883116.
Santini M F, Souza R B, Wainer I, et al. 2018. Temporal analysis of water masses and sea ice formation rate west of the Antarctic Peninsula in 2008 estimated from southern elephant seals’ SRDL-CTD data. Deep Sea Res Part II Top Stud Oceanogr, 149: 58-69, doi:10.1016/j.dsr2. 2018.02.013.
Schaffer J, Timmermann R, Arndt J E, et al. 2016. A global, high-resolution data set of ice sheet topography, cavity geometry, and ocean bathymetry. Earth Syst Sci Data, 8(2): 543-557, doi:10.5194/ essd-8-543-2016.
Shepherd A, Wingham D, Rignot E. 2004. Warm ocean is eroding West Antarctic Ice Sheet. Geophys Res Lett, 31(23): L23402, doi:10.1029/ 2004GL021106.
Whitworth T, Orsi A H, Kim S J, et al. 1998. Water masses and mixing near the Antarctic Slope Front//Jacobs S S, Weiss R F. Ocean, ice, and atmosphere: interactions at the Antarctic Continental Margin. Antarc Res Series, 75:1-27, doi:10.1029/AR075p0001.
World Ocean Database. 2018. World Ocean Database 2018. https://www. ncei.noaa.gov/products/world-ocean-database.
10.13679/j.advps.2021.0036
: He H L, Wu S C. Comparison of ship-based CTD measurement of Circumpolar Deep Water in the Amundsen Sea based on World Ocean Database. Adv Polar Sci, 2022, 33(2): 145-155,doi: 10.13679/j.advps.2021.0036
12 July 2021;
21 April 2022;
30 June 2022
Corresponding author, ORCID: 0000-0003-0690-6252, E-mail: hehailun@sio.org.cn
杂志排行
Advances in Polar Science的其它文章
- Numerical simulation of the dynamic effects of grounding icebergs on summer circulation in Prydz Bay,Antarctica
- Bacterial community diversity of meltwater runoff and soil in Midre Lovénbreen glacier in Ny-Ålesund,Arctic
- Community structure of mesopelagic fauna and the length-weight relationships of three common fishes inthe Cosmonaut Sea,Southern Ocean
- Inventory of unintentional POPs emission from anthropogenic sources in Antarctica
- Development of the International Polar Years and their benefits for China
- The evaluation of biological productivity by triple isotope composition of oxygen trapped in ice-core bubbles and dissolved in ocean:a review
