Gadolinium-ethoxybenzyl-diethylenetriamine penta-acetic acid-enhanced magnetic resonance imaging for evaluating fibrosis regression in chronic hepatitis C patients after direct-acting antiviral
2022-06-10XiaoHeLiRuiHuangMingYangJianWangYingHuiGaoQianJinDanLiMaLaiWeiHuiYingRao
Xiao-He Li, Rui Huang, Ming Yang, Jian Wang, Ying-Hui Gao, Qian Jin, Dan-Li Ma, Lai Wei, Hui-Ying Rao
Abstract
Key Words: Gadolinium-ethoxybenzyl-diethylenetriamine penta-acetic acid-enhanced magnetic resonance imaging; Contrast enhancement index; Hepatitis C virus; Direct acting antiviral; Sustained virological response; Fibrosis regression
INTRODUCTION
Chronic hepatitis C (CHC) remains one of the major etiologies of chronic liver disease, causing substantial morbidity and mortality globally[1 ,2 ]. Remarkably well-tolerated, effective, and short-time direct acting antiviral (DAA) regimens have revolutionized therapy for hepatitis C virus (HCV)infection, achieving a high rate of sustained virological response (SVR). However, it has also been reported that despite achieving SVR, patients may still experience disease progression[3 ,4 ]. It is critical to follow up pathological changes in the liver after DAA therapy. A growing number of studies have focused on the use of non-invasive tests to substitute liver biopsy[5 -7 ]. However, there are few validated thresholds for longitudinal assessment that correspond to histologic changes in fibrosis, and there is no definite non-invasive method for diagnosing the stage changes in fibrosis after SVR.
Gadolinium-ethoxybenzyl-diethylenetriamine penta-acetic acid (Gd-EOB-DTPA; Promovist®in Europe and Eovist®in the United States, Bayer Healthcare, Berlin, Germany) is a liver-specific magnetic resonance imaging (MRI) contrast agent[8 ]. The hepatocyte uptake and biliary excretion of Gd-EOBDTPA mainly take placeviaorganic anion transporting polypeptides OATP1 B1 /3 on the sinusoidal membrane and multidrug resistance-associated proteins MRP2 on the canalicular membrane. Therefore,after intravenous injection, Gd-EOB-DTPA shows extracellular distribution in the dynamic phase and hepatocyte-specific transportation in the hepatobiliary phase (HBP). Decrease in the number of normal hepatocytes and impaired hepatocyte function may reduce the hepatic enhancement of the HBP[9 ]. It has been reported using Gd-EOB-DTPA-enhanced MRI to identify hepatocellular carcinoma[10 ],evaluate liver function[11 ,12 ], stage liver fibrosis[13 ,14 ], and predict liver failure after hepatectomy[15 ].
To the best of our knowledge, no studies have used Gd-EOB-DTPA-enhanced MRI to evaluate changes in fibrosis after SVR with paired liver biopsy. The primary aim of our study was to evaluate the diagnostic performance of Gd-EOB-DTPA-enhanced MRI in staging liver fibrosis. The secondary aim was to confirm whether this diagnostic test can be used for longitudinal assessment of liver fibrosis in patients with CHC after achieving SVR treated by DAA regimens.
MATERIALS AND METHODS
Study design
Patients with chronic HCV infection treated with DAAs in our hepatology center between January 2014 and December 2016 were prospectively invited to undergo Gd-EOB-DTPA-enhanced MRI and liver biopsy. Patients with qualified Gd-EOB-DTPA-enhanced MRI data and liver biopsy samples were enrolled. The selection of DAA regimens was based on the genotype and state of liver disease. The patients who achieved SVR after DAA therapy underwent the examinations a second time. Exclusion criterias were: (1 ) Non-HCV etiology-related chronic liver disease (such as chronic hepatitis B, drug-or alcohol-related liver disease, non-alcoholic steatohepatitis,etc.); (2 ) Clinical hepatic decompensation; (3 )Solid organ transplantation; (4 ) Malignancy; (5 ) Combined with other systemic disease (immune system disease, blood system disease,etc.) and (6 ) Contraindications for MRI and liver biopsy. SVR was defined as undetectable HCV RNA 24 wk after the end of treatment.
Liver biopsy was performed within 1 mo before treatment and 3 mo after SVR. MRI was performed prior to liver biopsy within 1 mo. MRI with marked motion artifacts and specimens of liver tissue with lengths < 10 mm or < six portal areas under the microscope were regarded as inappropriate[16 ].Demographic information, virologic data, and laboratory findings were collected.
MRI protocol
All liver MRI examinations were performed with a Discover 7503 .0 T MR scanner (GE Healthcare,Milwaukee, WI, United States) using a 32 -channel torso array coil. Patients were in the supine position during horizontal axis scanning and had received prior training on how to breathe. Gd-EOB-DTPA(Promovist®, Bayer Healthcare) was injected intravenously as a contrast agent at a dose of 0 .1 mL/kg body weight with a flow rate of 2 mL/s, followed by a 20 -mL 0 .09 % NaCl flush. Three-dimensional T1 -weighted contrast-enhanced MRI was conducted in the unenhanced phase (UEP), arterial phase (AP, 25 s), portal phase (60 s), and HBP (20 min).
Image analysis
The signal intensities (SIs) of the liver parenchyma and paraspinal muscle in the UEP (SIUEP-liverand SIUEP-muscle) and HBP (SIHBP-liverand SIHBP-muscle) were independently measured by two professional radiologists with nearly 4 and 6 years of experience in interpreting abdominal MRIs, using regions of interests (ROIs). The radiologists were blinded to the patients’ clinical data and pathological changes.
Four ROIs were manually circled (size: 100 -150 mm2 ) in the posterior and anterior segments of the right hepatic lobe and inner and lateral segments of the left hepatic lobe at the hepatic hilar level. The location of the ROIs had to be at the center of each segment, far from the abdominal wall, and avoiding visible blood vessels, bile ducts, and lesions. The ROI of the paraspinal muscle was mainly circled on the left side.
The contrast enhancement index (CEI) was calculated using the following formula[17 ]:
CEI = (SIHBP-liver/SIHBP-muscle)/( SIUEP-liver/SIUEP-muscle)
The change rate in the CEI (ΔCEI%) between pre-treatment (CEIpre) and post-SVR (CEIpost) was calculated as (CEIpost/CEIpre× 100 %).
Histopathological analysis
Specimens were fixed in formalin immediately after liver biopsy and embedded in paraffin; 4 -μm-thick sections were cut and stained with hematoxylin and eosin and Masson’s trichrome. Two professional hepato-pathologists, both with nearly 30 years of working experience, assessed the degree and stage of necroinflammation and fibrosis of the specimens using the Ishak scoring system [modified histological activity index (mHAI) and Ishak score][18 ]. The pathologists were blinded to the imaging results and patient clinical data. The stages of liver fibrosis were divided into three groups according to the Ishak score, 0 -2 , 3 -4 , and 5 -6 , respectively. Necro-inflammatory severity was graded according to the mHAI score as 0 -4 , 5 -8 , 9 -12 , and 13 -18 [19 ]. Fibrosis regression was defined as a decrease of at least one point in the Ishak score after SVR[20 ].
Non-invasive fibrosis measurements
Experienced technicians conducted liver stiffness measurements (LSMs) with FibroScan (Echosens,Paris, France). An effective result should have a successful rate > 60 % and interquartile range/median ratio ≤ 30 %.
With respect to serologic biomarkers of fibrosis, the aspartate aminotransferase (AST)-to-platelet ratio(APRI) and Fibrosis-4 (FIB-4 ) were calculated as following:
APRI = [(AST/ULN)/platelet count (× 109 /L)] × 100 [21 ]; FIB-4 = (age × AST)/[(platelet count) (× 109 /L) × ALT1 /2 ][22 ]
The change rates in APRI, FIB-4 , and LSM between pre-SVR (valuepre) and post-SVR (valuepost) were calculated similarly with the CEI calculation.
Statistical analyses
Descriptive analyses were performed for sociodemographic characteristics (age, sex), clinical data[alanine aminotransferase (ALT), AST, total bilirubin (TB), albumin (Alb), platelet (PLT) count, HCV RNA, genotype, FIB-4 , APRI, LSM, and CEI], histological grading, and staging.
Descriptive analyses were performed for sociodemographic characteristics, clinical data, histological characteristics, and the CEI. The value of HCV RNA was logarithmically transformed with 10 as the base. Continuous variables are expressed as median (interquartile range) (ALT, AST, TB, PLT, APRI,FIB-4 , and LSM) or mean ± SD [age, Alb, international normalized ratio (INR), HCV RNA, mHAI, and CEI]. Categorical variables (sex, numbers of patients in the different mHAI and Ishak score groups) are presented as counts and percentages. The absolute values of the interclass correlation coefficients (ICC)were measured for SIs to confirm the interobserver reliability between reviewers. Student’s t-test (age,Alb, INR, HCV RNA, mHAI, and CEI) and Mann-Whitney U test (ALT, AST, TB, and PLT) were used to compare continuous variables, and the chi-square test was used for classified variables (sex, HCV genotype). The comparison between pre-and post-SVR was performed with the Wilcoxon sign rank test(ALT, AST, TB, PLT, FIB-4 , APRI, and LSM) and paired sample t-test (Alb, INR, and CEI). Spearman’s correlation coefficient was calculated for the CEI, mHAI, and Ishak score. The predictive value of the CEI, APRI, FIB-4 , and LSM for liver fibrosis was assessed using the area under the receiver operating characteristic curve (AUROC). Sensitivity, specificity, positive predictive value, and negative predictive value were also calculated. An optimal cut-off value was chosen to maximize the Youden index, which is defined as (sensitivity + specificity-1 ). P values < 0 .05 were considered statistically significant.Statistical analyses were performed using IBM SPSS version 26 .0 (IBM Corp., Armonk, NY, United States).
RESULTS
Forty-five patients underwent Gd-EOB-DTPA-enhanced MRI and liver biopsy at baseline and six with unqualified samples were excluded. Among the enrolled patients (n= 39 ), six were recommended to receive treatment with DAA plus Peg-IFN, and three had virological breakthrough. Twenty-five patients underwent MRI and liver biopsy again after achieving SVR, and 21 pairs of data were eligible.Therefore, there were 60 qualified and pairable MRI images and liver tissue samples available for analyzing correlation between CEI and liver pathology. The study flow chart is shown in Figure 1 .
Intraclass correlation coefficients
Two radiologists interpreted the Gd-EOB-DTPA-enhanced MRI images. The ICC for the measured SI values were excellent (greater than 0 .9 ) for before and after achieving SVR. The ICC of the CEI was 0 .729 (0 .481 , 0 .858 ) and 0 .886 (0 .744 , 0 .952 ) pre and post SVR, respectively. Details of the inter-observer agreements of the ROI measurements and CEI are presented in Supplementary Table 1 .
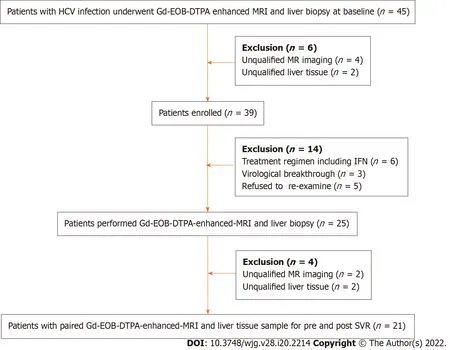
Figure 1 The study flow chart. HCV: Hepatitis C virus; Gd-EOD-DTPA: Gadolinium ethoxybenzyl diethylenetriamine penta-acetic acid; MRI: Magnetic resonance imaging; IFN: Interferon; SVR: Sustained virological response.
Patient characteristics
The 39 patients enrolled had a mean age of (42 .3 ± 14 .4 ) years, mean HCV RNA of (6 .4 ± 0 .7 ) log10 IU/mL, and 20 (51 .3 %) were male. The distribution of HCV genotypes (GT) was 1 , 2 , 3 , and 6 in 19 (48 .7 %), 4 (10 .3 %), 13 (33 .3 %), and 3 (7 .7 %) patients, respectively. Patients with Ishak score of 5 -6 were elder, had higher ALT and lower PLT levels than those with Ishak scores of 0 -2 (P < 0 .05 ) (Table 1 ).
Of the 21 patients who achieved SVR and had paired MRI and liver tissue samples, 13 (62 %) received sofosbuvir/ribavirin therapy, and the other eight (38 %) received daclatasvir/asunaprevir regimens. As expected, the values of ALT, AST (P <0 .001 ), and necroinflammation grade (P = 0 .023 ) significantly decreased post SVR (Table 2 ). No significant change in fibrosis stage was observed. Among the noninvasive measurements, the median of LSM, FIB-4 , and APRI decreased significantly, the mean of the CEI increased slightly without statistically significant (P= 0 .29 ) (Table 2 ). After achieving SVR, 7 (33 %) patients achieved fibrosis regression. No patient with Ishak 5 -6 (n = 7 ) achieved fibrosis regression.
The CEI decreased with the progression of liver fibrosis
In patients with CHC, the CEI was negatively correlated with the grade of inflammation (r= -0 .56 ,P<0 .001 ) and stage of fibrosis (r = -0 .69 , P < 0 .001 ). The CEI decreased significantly among patients with Ishak scores 0 -2 , 3 -4 , and 5 -6 (1 .78 ± 0 .11 , 1 .64 ± 0 .11 , and 1 .50 ± 0 .09 , respectively, P < 0 .001 )(Figure 2 A). To further analyze the relationship between the CEI and liver pathology, we stratified the patients according to the mHAI (0 -4 , 5 -8 , 9 -12 , and 13 -18 ) and Ishak score (0 -2 , 3 -4 , and 5 -6 ; the numbers of patients in each subgroup are shown in Table 3 ).
In patients with a mHAI of 0 -4 , the CEI in Group 2 (n = 11 ) was significantly lower than that in Group 1 (n = 14 ) [(1 .67 ± 0 .11 ) vs (1 .79 ± 0 .11 ), P = 0 .021 ] and the CEI of the only patient in Group 3 was 1 .52 (Figure 2 B). When the mHAI was 5 -8 , the CEI decreased in the order of fibrosis Group 1 (n = 3 ), 2 (n= 13 ), and 3 (n = 9 ) at 1 .75 ± 0 .06 , 1 .62 ± 0 .11 , and 1 .49 ± 0 .12 , respectively (P = 0 .032 ) (Figure 2 C). All patients with an mHAI of 13 -18 had liver cirrhosis (n = 9 ), and they were not grouped. In contrast, after subgrouping the patients based on the fibrosis grade, there were no significant differences in the CEI among the inflammation groups (allP> 0 .05 ) (Figure 2 D-F). Therefore, we believe that decrease in the CEI is mainly associated with the progression of fibrosis.
The CEI is more useful for liver fibrosis diagnosis than the LSM, APRI, and FIB-4
Table 4 shows a comparison of the predictive values between the CEI and other non-invasive methods.According to the AUROCs and cut-off values, we found that the diagnostic efficacy of the CEI, LSM,APRI, and FIB-4 before and after DAA treatment was similar for liver cirrhosis (Ishak score ≥ 5 ), whilethe cut-off values of serological markers such as the APRI and FIB-4 significantly decreased post SVR.The cut-off value of the LSM also showed a similar trend. For significant fibrosis (Ishak score ≥ 3 ), post SVR, the diagnostic efficacy of the LSM decreased, and the APRI and FIB-4 showed no diagnostic value.
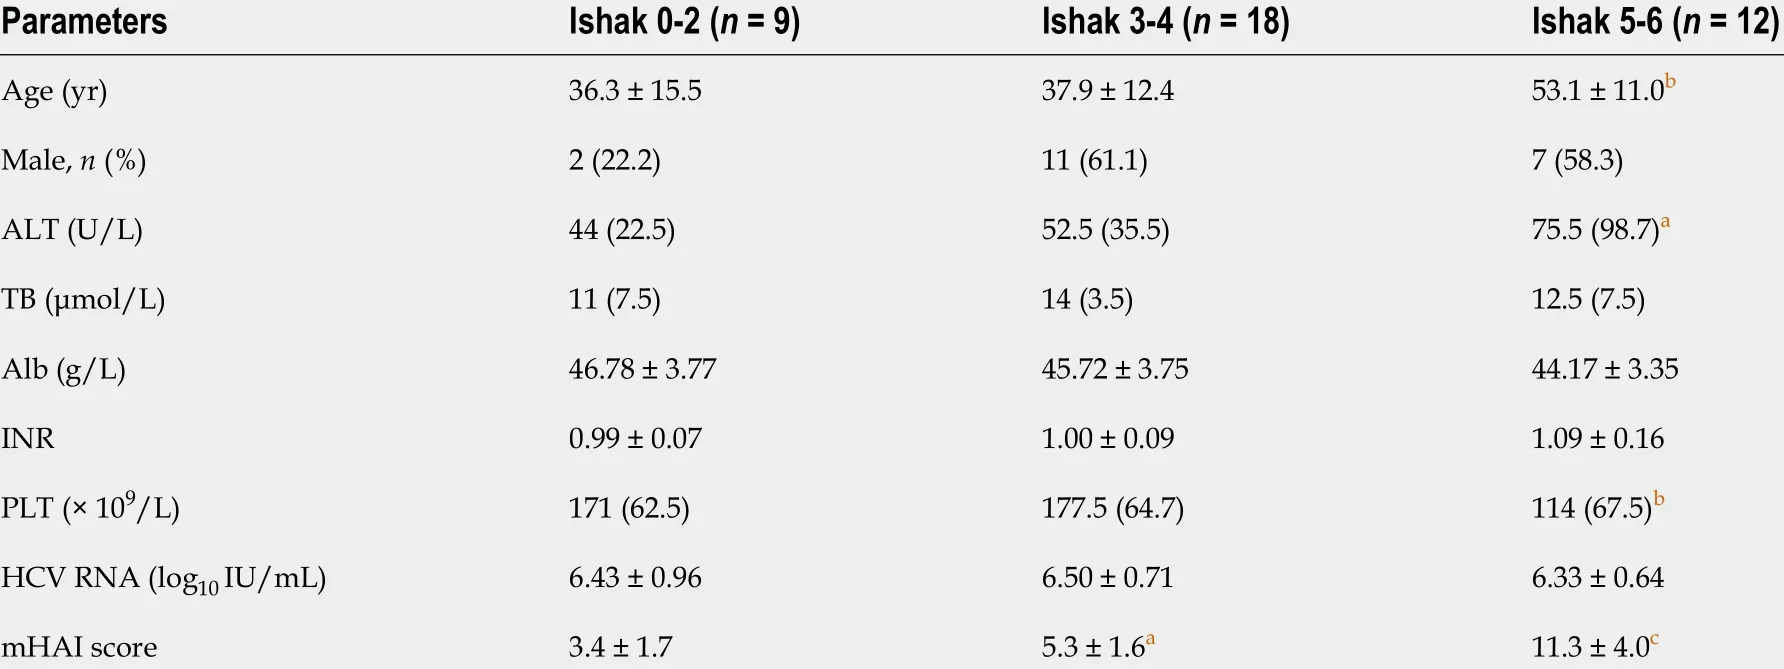
Table 1 Comparison of demographic and clinical data of patients
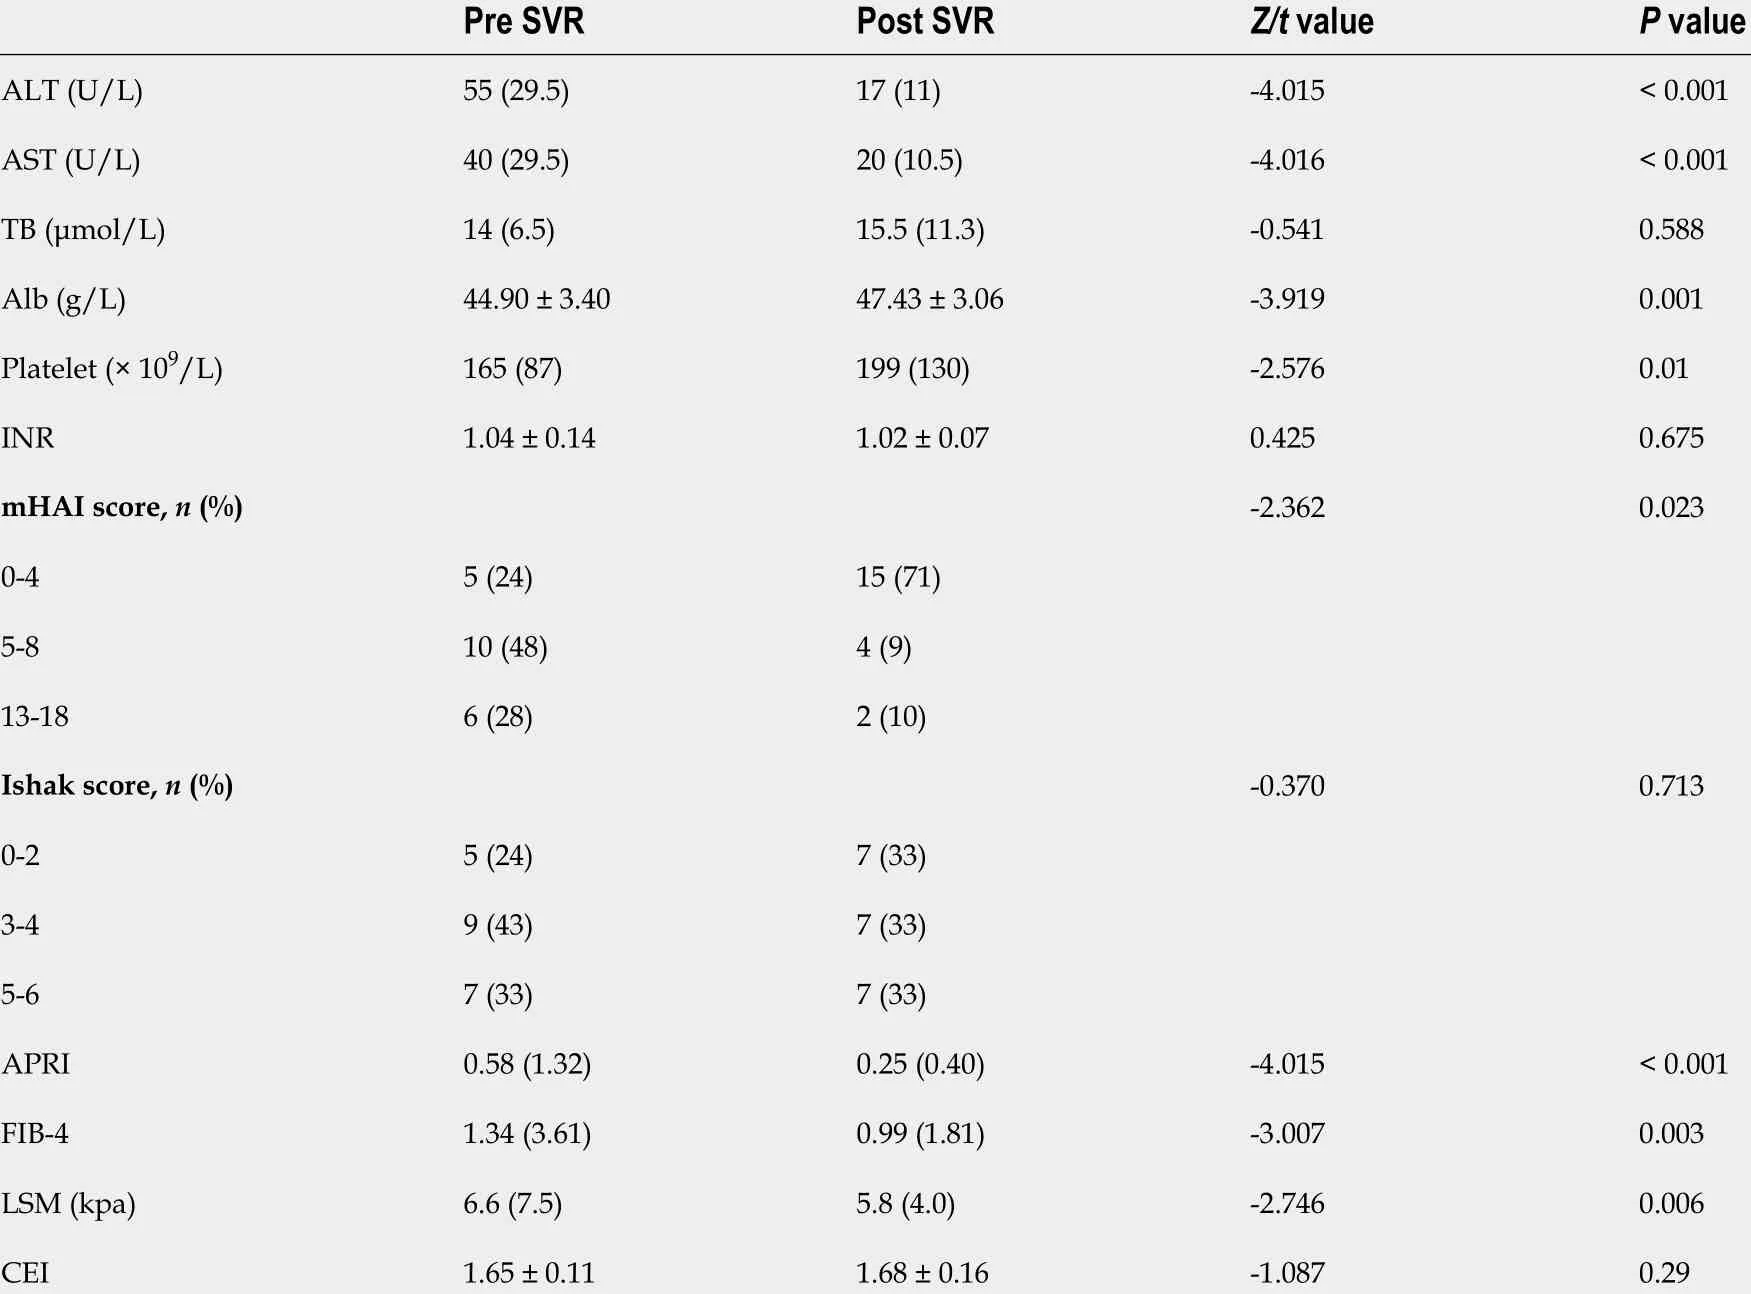
Table 2 Clinical characteristics of patients for pre and post sustained virological response
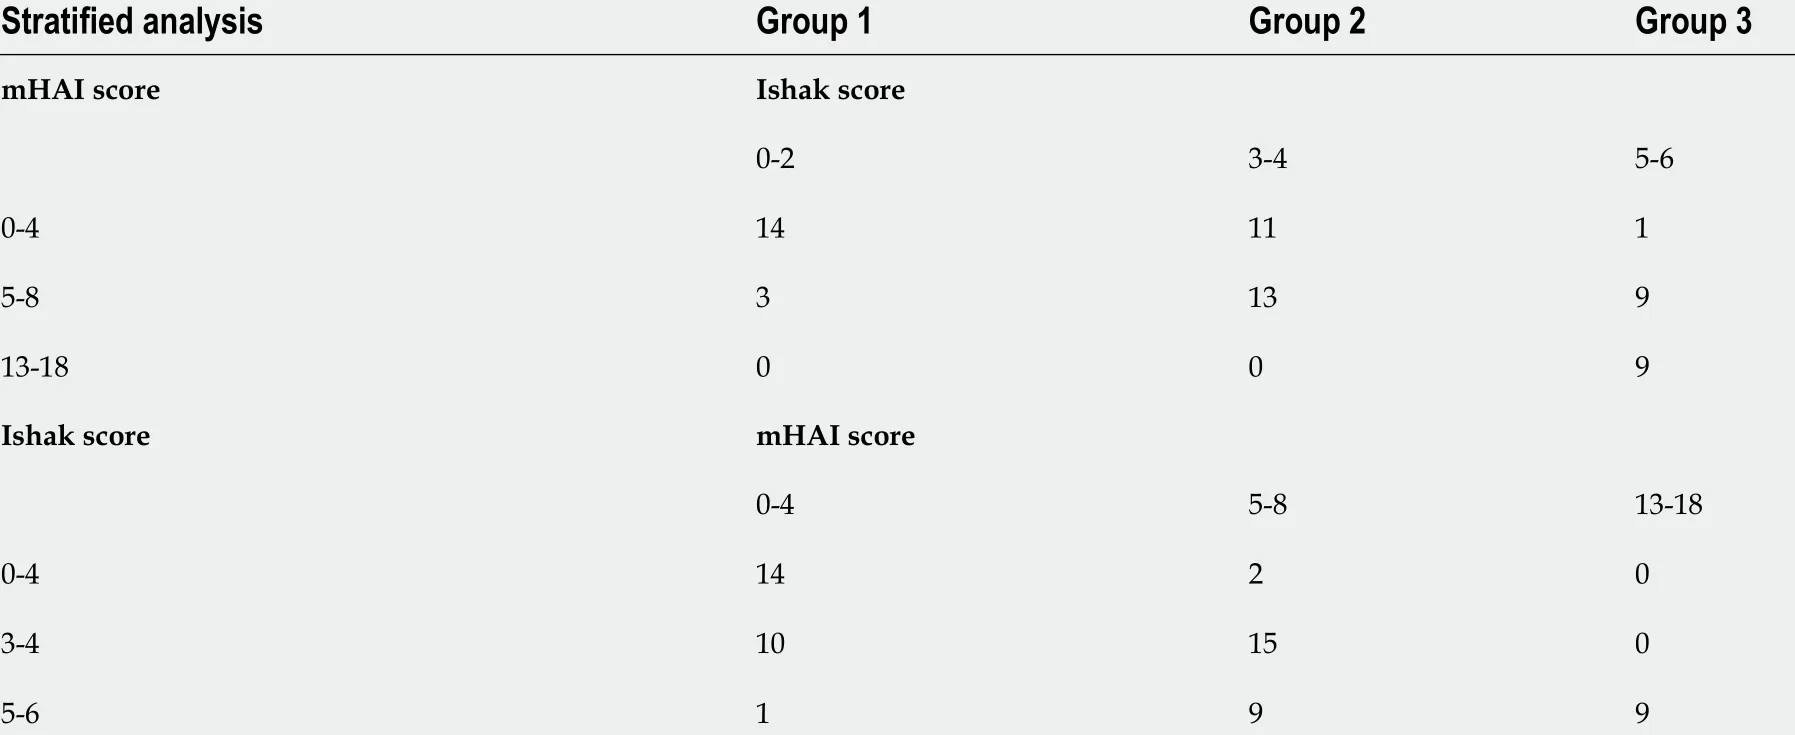
Table 3 Distribution of patients in stratified analysis
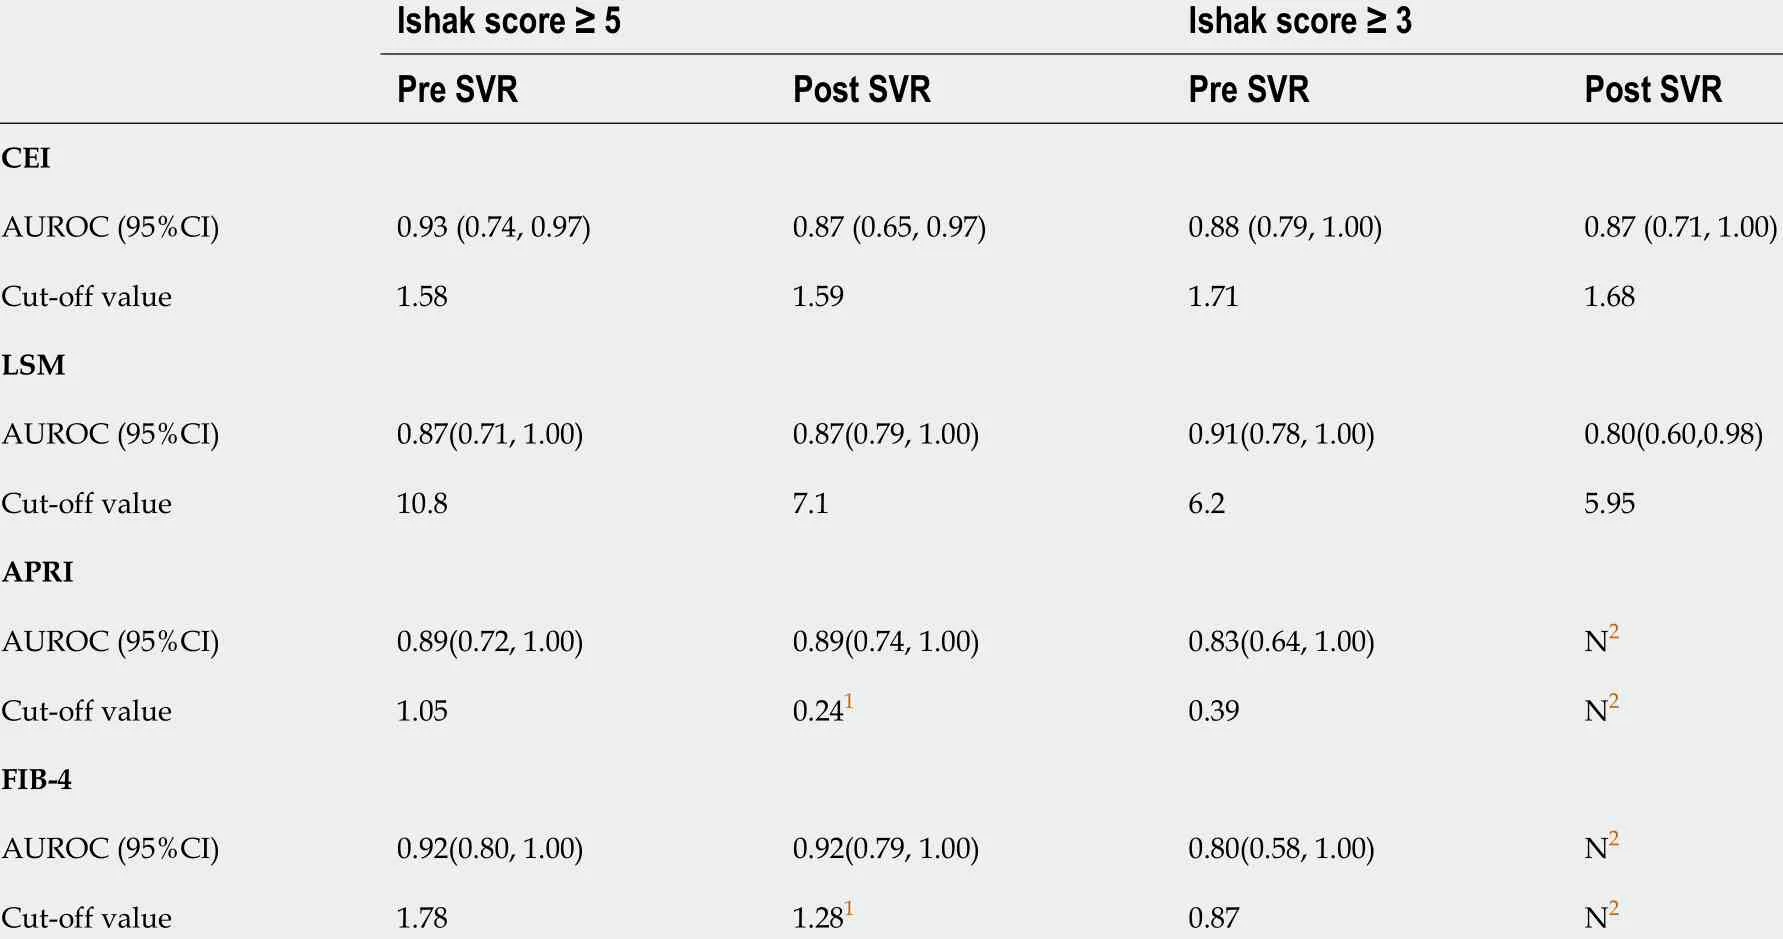
Table 4 The area under receiver operating curve and cut-off value for liver cirrhosis and significant liver fibrosis at pre-sustained virological response and post-sustained virological response with contrast enhancement index, aspartate aminotransferase-to-platelet ratio index, Fibrosis-4 and liver stiffness measurement
Only dynamic change in the CEI can be used to evaluate fibrosis regression after achieving SVR
Figure 3 shows the change of the CEI and other non-invasive methods in patients with (red column) and without (black column) fibrosis regression. Among the patients with fibrosis regression (n= 7 ), the CEI increased significantly (from 1 .68 ± 0 .09 to 1 .83 ± 0 .18 , P = 0 .043 ) after DAA treatment; similarly, the LSM [from 6 .6 (2 .6 ) to 4 .8 (1 .2 ), P = 0 .018 ] and APRI [from 0 .37 (0 .22 ) to 0 .20 (0 .08 ), P = 0 .018 ] values decreased significantly. For patients who did not achieve fibrosis regression (n= 14 ), only the CEI remained stable (P> 0 .05 ), while the LSM, APRI, and FIB-4 decreased significantly (P < 0 .05 ). It is suggested that the decrease in the latter three noninvasive measurements after treatment may not be related to fibrosis regression. By comparing the change ratios of the four noninvasive indexes before and after treatment, only CEI% changed significantly, and CEI% was moderately positively correlated with fibrosis regression (r= 0 .50 , P = 0 .021 ) (Table 5 ).

Figure 2 Contrast enhancement index decreased with the progression of liver fibrosis. A: Contrast enhancement index (CEI) decreased with the progression of fibrosis, and there was significant difference between patients with Ishak score 0 -2 , 3 -4 and 5 -6 ; B: In patients with modified histology activity index(mHAI) score of 0 -4 , CEI was lower in patients with Ishak score of 3 -4 compared with 0 -2 ; C: In patients with mHAI score of 5 -8 , CEI decreased with the progression of fibrosis stage; D-F: When the Ishak scores was fixed as 0 -2 , 3 -4 and 5 -6 respectively, the value of CEI was not related to the progression of inflammation. aP <0 .05 ; bP < 0 .001 . CEI: Contrast enhancement index; mHAI: Modified histology activity index.
DISCUSSION
In this study, paired liver biopsy and Gd-EOB-DTPA-enhanced MRI data of patients with CHC before and after SVR were reported for the first time. This study concluded that the CEI of Gd-EOB-DTPAenhanced MRI in the HBP decreased with the progression of liver fibrosis. For patients with CHC, the CEI can be used to distinguish among the different stages of liver fibrosis at baseline and after achieving SVR more effectively than the APRI, FIB-4 , and LSM. The change in the CEI between pre and post SVR was related to fibrosis regression. This result increased the options for dynamic assessment of liver fibrosis after achieving SVR.
In our study, patients treated with DAA plus interferon were excluded. Although the combination therapy may have no effect on the evaluation of liver pathology, based on the current situation of CHC treatment, majority of patients can be cured by simple DAAs. So, we pay more attention on correlation between CEI and pathology changes in patients cured by simple DAAs. It is worth mentioning that,HCV RNA was both detected at 12 - and 24 -wk after the end of treatment. The value of HCV RNA at 12 -wk were also undetectable in patients achieving SVR24 . Since patients were enrolled between 2014 -2016 ,SVR12 and SVR24 both could be used at that time, while the 24 -wk SVR last longer, it was used in our article. We specially agree that the current definition of SVR as an undetectable HCV RNA at 12 wk after the end of treatment.
In the correlation analysis, we found that the CEI was mild negative related to both grade of inflammation and stage of fibrosis. Further hierarchical analysis showed that the CEI mainly decreased with the progression of liver fibrosis, which was consistent with the results of a previous multiple regression analysis[23 ]. As mentioned above, after achieving SVR, the overall liver fibrosis status was not notably improved, and the CEI also did not change significantly. Therefore, we combined 60 pairs of CEI and liver pathology data before and after treatment for analysis. It should be mentioned that the overall mHAI decreased after treatment, which may have affected the results. However, in our pre-analysis, wefound that in the 21 paired MRI and liver biopsy samples after treatment, the correlation between the mHAI and Ishak score (r= 0 .74 , P < 0 .001 ) remained significant. This may be because the patients with a mHAI > 13 at baseline had liver cirrhosis. After achieving SVR, there was no significant improvement in fibrosis or in the inflammation status. It was also shown that the correlation between the CEI and fibrosis stage remained relatively stable and was not related to the treatment state.
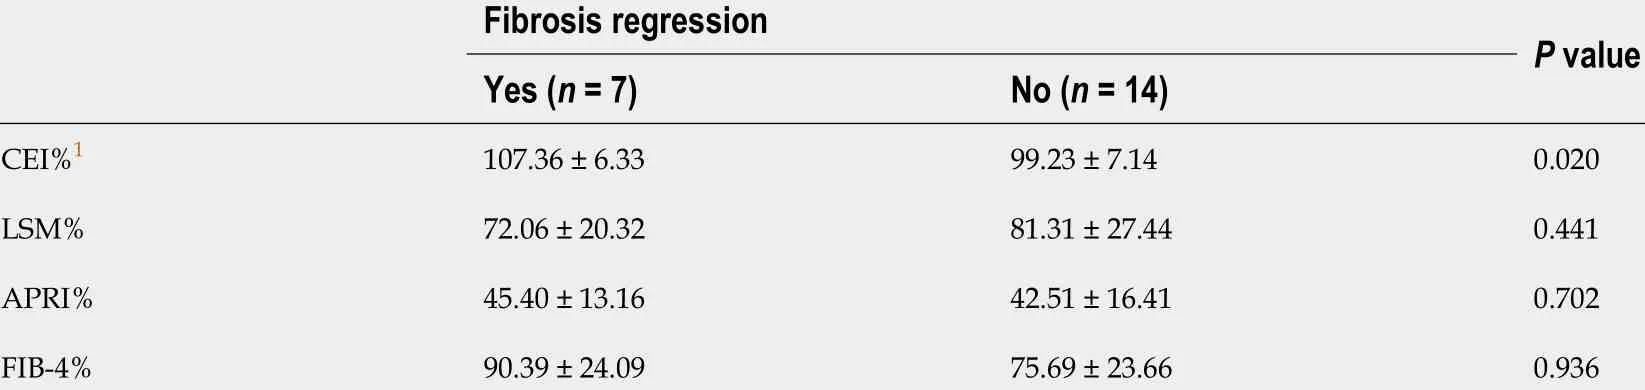
Table 5 Relationship between the changes of contrast enhancement index, aminotransferase-to-platelet ratio index, Fibrosis-4 , liver stiffness measurement and fibrosis regression
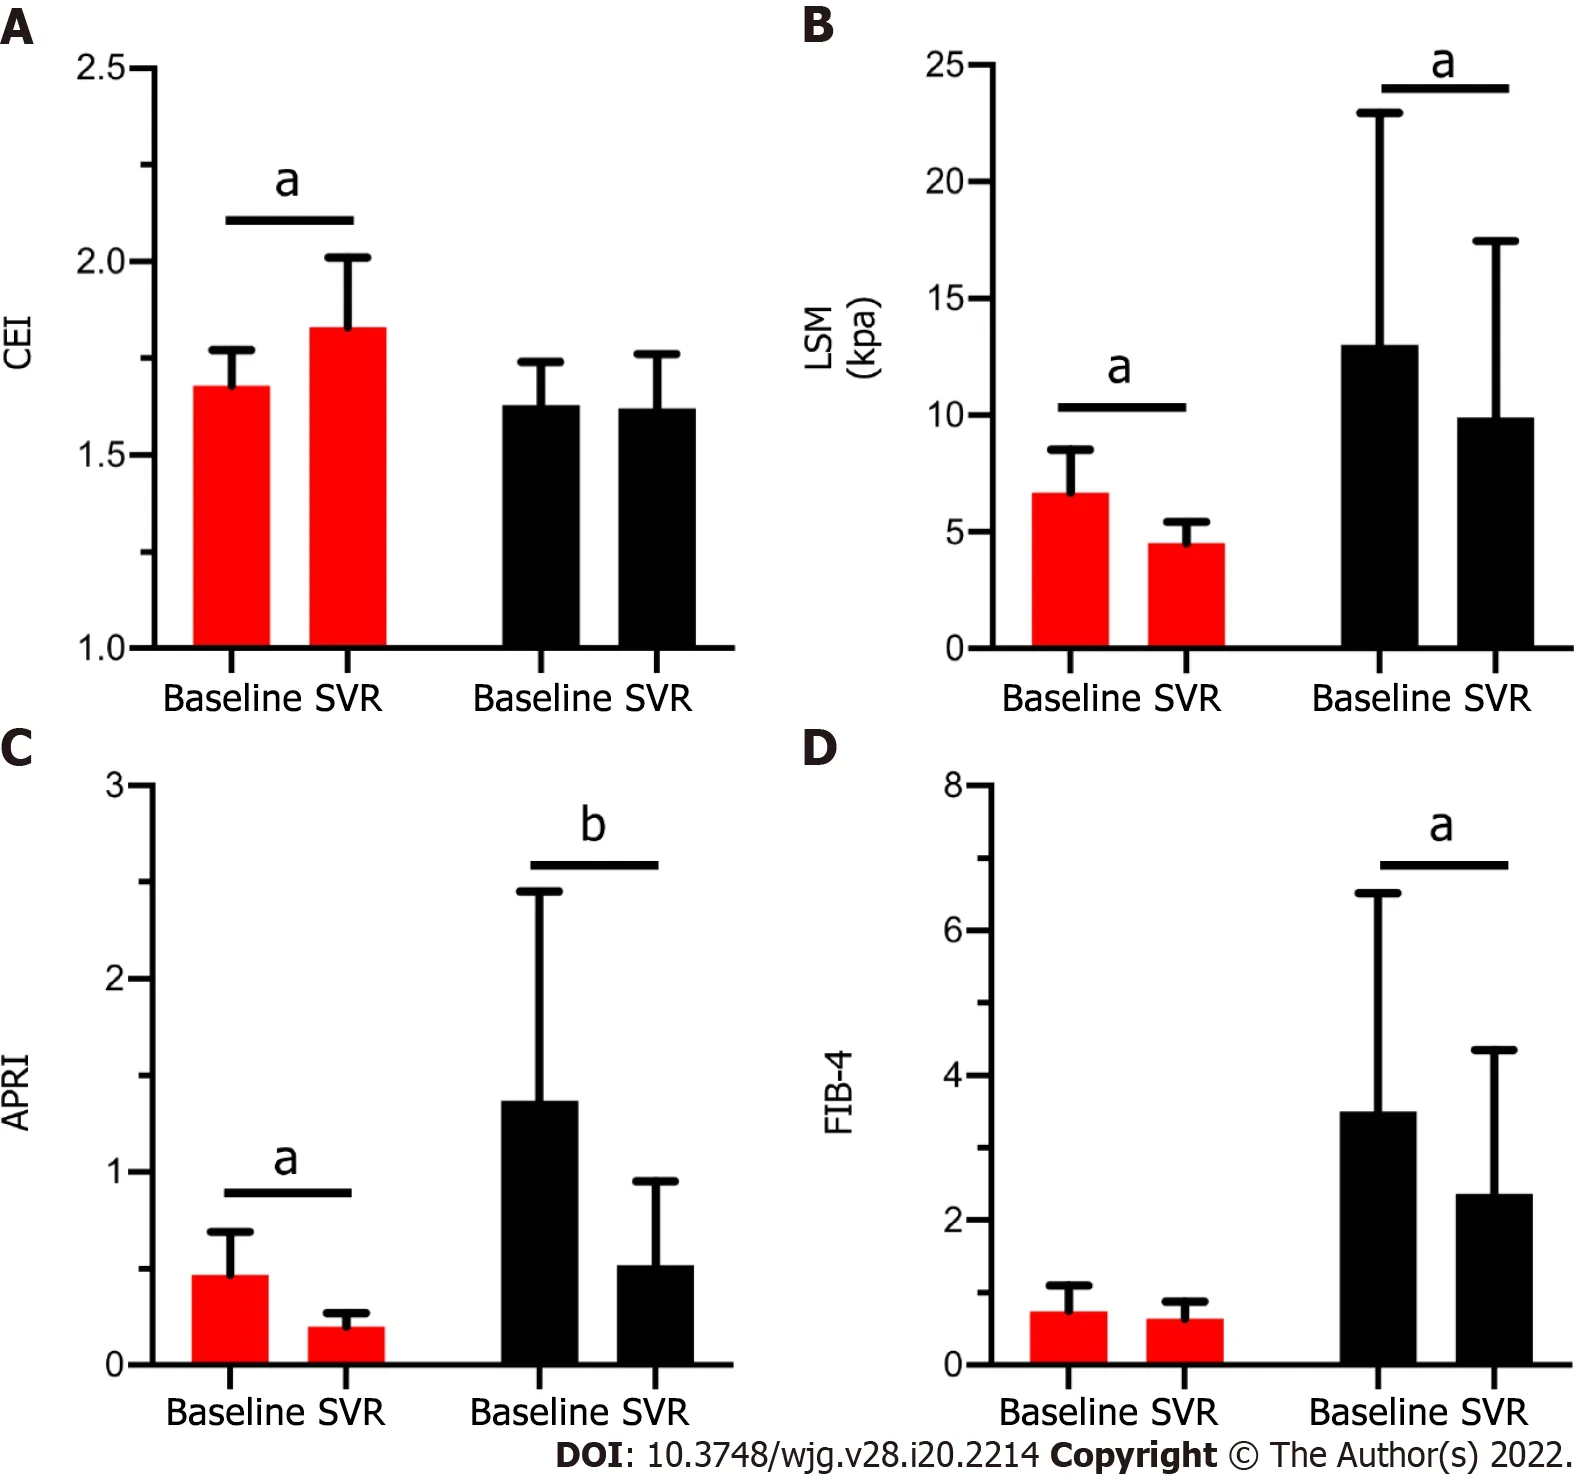
Figure 3 Comparison of four noninvasive methods before and after sustained virological response between patients with fibrosis regression or not. A: Value of contrast enhancement index; B: Value of liver stiffness measurement; C: Value of aspartate aminotransferase-to-platelet ratio index; D: Value or Fibrosis-4 in patients with (Red column) and without (Black column) fibrosis regression at baseline and after achieving sustained virological response (SVR). Red column: Patients had fibrosis regression after achieving SVR (n = 7 ). Black column: Patients didn’t have fibrosis regression after achieving SVR(n = 14 ). aP < 0 .05 ; bP < 0 .001 . CEI: Contrast enhancement index; SVR: Sustained virological response; LSM: Liver stiffness measurement; APRI: Aspartate aminotransferase-to-platelet ratio index; FIB-4 : Fibrosis-4 .
In patients with liver cirrhosis (Ishak score 5 -6 ), the diagnostic values of the CEI and of the other noninvasive methods were similar, which was also partly previously reported by a cross-sectional comparative analysis[23 ]. As the inflammatory status improved with antiviral treatment, the cut-off values of the APRI (from 1 .05 to 0 .24 ) and FIB-4 (from 1 .78 to 1 .28 ) both substantially decreased for the same fibrosis status. The serological biomarkers had no diagnostic value for significant fibrosis after HCV eradication, mainly because with the rapid regression of liver necroinflammation, the ALT and AST levels returned to normal, reducing the diagnostic accuracy of serological biomarkers. Although accessible and common, the APRI and FIB-4 may not be suitable for the surveillance of patients with CHC post SVR[21 ,24 ].
Other than the serological biomarkers, the LSM obtained with TE is currently considered useful for fibrosis monitoring[25 -27 ]. However, several studies have reported a rapid decrease in the LSM mainly related to inflammation regression, and its cut-off values are influenced by liver morphometry. Hence,the decrease in the LSM may be misinterpreted as change in the liver fibrosis stage[6 ,28 ]. A longitudinal study of 2 years showed that following SVR attainment, the improvements in the LSM were overstated compared to histologic staging[28 ]. Therefore, the follow-up value of liver fibrosis regression in patients with HCV SVR needs to be further verified. Our findings strengthened this notion in a relative short follow-up time (median of 6 .2 mo). The cut-off value of the LSM decreased slightly in patients with liver cirrhosis (from 10 .8 kPa to 7 .1 kPa), wherein an LSM value of 7 .1 kPa obtained with TE was defined as the threshold for absence of or minimal fibrosis in patients with CHC[29 ]. The comparative analysis also showed significant decrease in the LSM value in patients without fibrosis regression.
Apart from the CEI, several studies have reported multiple hepatobiliary liver enhancement indexes of Gd-EOB-DTPA-enhanced MRI, including RE (calculated as [SIHBP-SIUEP]/SIUEPof the liver parenchyma), liver-to-portal vein contrast ratio (calculated by dividing the liver parenchyma SI by the portal vein SI on HBP images), and liver-to-spleen contrast ratio (calculated by dividing the liver parenchyma SI by the spleen SI on HBP images)[30 -32 ]. In previous reports, the signals of the portal vein and spleen were integrated with plasma or extracellular extravascular space exposure to the contrast agent, thus showing that the liver-to-portal vein contrast ratio and liver-to-spleen contrast ratio were more strongly related to liver function than to liver fibrosis[12 ,33 ]. Adjustment of the signal of the paraspinal muscle for SIliveron the same slice was performed to normalize the shimming influences and correct for technical bias. Compared with other organs, SImusclewas more stable and less influenced by age and liver function. Janget al[23 ] also validated this view. A few articles have shown similar diagnostic accuracies for RE and the CEI. In our study, RE was mildly negatively associated with liver inflammation (r= -0 .57 , P = 0 .007 ) and fibrosis (r = -0 .44 , P = 0 .043 ) (unreported), possibly because the SI of the liver after injecting Gd-EOB-DTPA changes, as the window level and width differ in the images[34 ].
There were several limitations in our study. First, limited by the inclusion criteria, the sample size was small, and the CEI% of patients with fibrosis regression was close to 1 . We will explore further by expanding the sample size. Second, we did not use MR elastography (MRE) or T1 -mapping to predict liver fibrosis, which have a superior diagnostic value in predicting liver fibrosis than Gd-EOB-DTPAenhanced MRI[35 ,36 ]. However, except for the influence of body mass index and ascites on TE, the sequencing method in MRE is not unified, and the threshold value changes across different methods[26 ]. In recent years, MR relaxometry in the form of T1 mapping has been considered promising as a non-invasive method for characterizing hepatic fibrosis using the look-locker technique for measurement. Our patients were enrolled between 2014 and 2016 , when T1 mapping was not in use.Third, although histology is a gold standard procedure, the tissues used in our study were all from liver biopsies rather than from hepatectomy, and there may have been misjudgment regarding the histological changes. Fourth, the mean follow-up duration after achieving SVR was only 6 .2 mo, and a longer follow-up period is warranted.
CONCLUSION
In conclusion, the CEI of Gd-EOB-DTPA-enhanced MRI can be used to diagnose liver fibrosis in patients with CHC. The change of the CEI can be used to monitor fibrosis regression post SVR by DAA therapy.
ARTICLE HIGHLIGHTS

Research objectives
To investigated the diagnostic and follow-up values of Gd-EOB-DTPA-enhanced MRI for hepatic histology in patients with CHC. We further explore the value of Gd-EOB-DTPA enhanced MRI in evaluating fibrosis regression in patients with CHC after achieving sustained virological response (SVR)treated by DAAs.
Research methods
Chronic HCV infected patients with paired liver biopsy and Gd-EOB-DTPA enhanced MRI before and after DAA treated was included. Contrast enhancement index (CEI) was calculated according with signal intensityviaMRI, and the correlation between CEI and histology change was evaluated. Fibrosis regression was defined as a ≥ 1 -point decrease in the Ishak fibrosis score. The diagnostic and follow-up values of the CEI, liver stiffness measurements (LSM), aminotransferase (AST)-to-platelet ratio (APRI)and Fibrosis-4 (FIB-4 ) were compared.
Research results
Thirty-nine patients with CHC were enrolled, with average age of 42 .3 ± 14 .4 years and 20 /39 (51 .3 %)were male. Twenty-one enrolled patients had eligible paired Gd-EOB-DTPA-enhanced MRI and liver tissues after achieving SVR. According to correlation and the hierarchical analysis, the CEI mainly decreased with the progression of liver fibrosis. Compared with LSM, APRI and FIB-4 , the CEI is more useful for liver fibrosis diagnosis, the correlation between the CEI and fibrosis stage was relatively stable and was not related to the treatment state. In paired analysis using liver pathology and CEI before and after treatment, only the dynamic change in the CEI can be used to evaluate fibrosis regression after achieving SVR.
Research conclusions
The CEI of Gd-EOB-DTPA-enhanced MRI can be used as a non-invasive method to diagnose liver fibrosis in patients with CHC. The dynamic change of the CEI can be used to monitor fibrosis regression post SVR in patients with CHC after DAA therapy.
Research perspectives
Larger and longer-term prospective studies in patients with CHC should be performed in future studies.
ACKNOWLEDGEMENTS
We are sincerely grateful to the radiologists Dr. Xiao-Xuan Jia and Dr. Xin-Yu Zhang for their involvement in the MRI analysis. We also thank Prof. Aileen Wee and Guang-De Zhou for their involvement in the liver pathology confirmation. We also thank Hui-Xin Liu, MD, for help with the statistical review.
FOOTNOTES
Author contributions:Li XH, Rao HY and Wei L designed the protocol of this study; Li XH, Huang R, Yang M, Wang J, Gao YH, Jin Q and Ma DL collected the data; Li XH analyzed and interpreted the patient data and was major contributors in writing the manuscript; Wei L and Rao HY give advice in study design, statistical analysis and writing the manuscript; All authors read and approved the final manuscript.
Supported byNational Natural Science Foundation of China, No. 81870406 ; and Nature Science Foundation of Beijing Municipality, No. 7182174 .
Institutional review board statement:This study was reviewed and approved by the Institutional Review Board of Peking University People’s Hospital (2020 PHB039 -01 ), and the requirement for patient informed consent was waived.
Informed consent statement:Patients were not required to provide informed consent for this study, as the analysis used anonymous clinical data. The Institutional Review Board of Peking University People’s Hospital approved waiving the requirement for patient informed consent.
Conflict-of-interest statement:Prof. Rao reports grants from National Natural Science Foundation of China (NSFC),No. 81870406 , and Beijing Natural Science Foundation, No. 7182174 during the conduct of the study.
Data sharing statement:No additional data are available.
Open-Access:This article is an open-access article that was selected by an in-house editor and fully peer-reviewed by external reviewers. It is distributed in accordance with the Creative Commons Attribution NonCommercial (CC BYNC 4 .0 ) license, which permits others to distribute, remix, adapt, build upon this work non-commercially, and license their derivative works on different terms, provided the original work is properly cited and the use is noncommercial. See: https://creativecommons.org/Licenses/by-nc/4 .0 /
Country/Territory of origin:China
ORCID number:Xiao-He Li 0000 -0001 -6600 -6067 ; Rui Huang 0000 -0001 -5561 -8746 ; Ming Yang 0000 -0001 -5765 -3844 ; Jian Wang 0000 -0002 -9578 -8288 ; Ying-Hui Gao 0000 -0003 -4532 -3412 ; Qian Jin 0000 -0002 -5213 -8680 ; Dan-Li Ma 0000 -0002 -0936 -6792 ; Lai Wei 0000 -0003 -2326 -1257 ; Hui-Ying Rao 0000 -0003 -2431 -3872 .
S-Editor:Fan JR
L-Editor:A
P-Editor:Chen YX
杂志排行

World Journal of Gastroenterology的其它文章
- Advances in medical treatment for pancreatic neuroendocrine neoplasms
- Artificial intelligence: Emerging player in the diagnosis and treatment of digestive disease
- Endoscopic management of intramural spontaneous duodenal hematoma: A case report
- Radiomics for the detection of microvascular invasion in hepatocellular carcinoma
- Long noncoding RNA TNFRSF10 A-AS1 promotes colorectal cancer through upregulation of HuR
- Digital single-operator video cholangioscopy improves endoscopic management in patients with primary sclerosing cholangitis-a retrospective observational study