Flash Flood Risk Assessment and Driving Factors:A Case Study of the Yantanxi River Basin,Southeastern China
2022-06-07LiutongChenZhengtaoYanQianLiYingjunXu
Liutong Chen•Zhengtao Yan•Qian Li•Yingjun Xu,3
Abstract In the context of climate change,the impact of extreme precipitation and its chain effects has intensified in the southeastern coastal region of China,posing a serious threat to the socioeconomic development in the region.This study took tropical cyclones–extreme precipitation–flash floods as an example to carry out a risk assessment of flash floods under climate change in the Yantanxi River Basin,southeastern China.To obtain the flash flood inundation characteristics through hydrologic–hydrodynamic modeling,the study combined representative concentration pathway(RCP)and shared socioeconomic pathway(SSP)scenarios to examine the change of flash flood risk and used the geographical detector to explore the driving factors behind the change.The results show that flash flood risk in the Yantanxi River Basin will significantly increase,and that socioeconomic factors and precipitation are the main driving forces.Under the RCP4.5-SSP2 and RCP8.5-SSP5 scenarios,the risk of flash floods is expected to increase by 88.79%and 95.57%,respectively.The main drivers in the case study area are GDP density(q=0.85),process rainfall(q=0.74),asset density(q=0.68),and population density(q=0.67).The study highlights the influence of socioeconomic factors on the change of flash flood disaster risk in small river basins.Our findings also provide a reference for regional planning and construction of flood control facilities in flash flood-prone areas,which may help to reduce the risk of flash floods.
Keywords Asset values∙China∙Climate change∙Extreme precipitation∙Flash flood risk∙Geographical detector∙Tropical cyclones
1 Introduction
Flood disasters induced by extreme precipitation events have become a major challenge to regional security and development.The Intergovernmental Panel on Climate Change(IPCC)released a special report about managing the risks of extreme events and disasters in 2012,which indicates that the evolution of extreme disaster events such as floods has become an important issue to be addressed in climate change impact and adaptation research(Lavell et al.2012;Fang et al.2014).Climate change has increased the frequency and intensity of extreme precipitation events(Su et al.2015;Luo et al.2016).Hourly precipitation data from 1215 stations in China show that the precipitation intensity and maximum hourly precipitation increased by 0.7–1.1%and 0.9–2.8%on average per decade,respectively,during 1961-2012,mainly in central China and southeastern coastal areas(Jian et al.2020).Extreme precipitation events increase the risk of flood disasters(Su et al.2015;Luo et al.2016).With the rapid socioeconomic development in recent decades,about USD 70.6 billion in economic damages and 4354 casualties were caused by flooding in China’s coastal region during 1989-2014(Fang et al.2020).Therefore,understanding the spatial and temporal evolution characteristics of flood disasters and carrying out the risk assessment of flood disasters in coastal areas in the context of climate change is important for the sustainable development of the region.
Floods are classified as riverine floods,coastal floods,and flash floods depending on the area where the flood disaster occurs(Griffiths et al.2019).Flash floods have a major impact in China(Zhang et al.2006;Liu et al.2018).They have been distributed in 2058 counties,with a distribution area of 4.87 million km2,and flash flood disasters have affected a population of 570 million people before 2016,according to the State Flood Control and Drought Relief Office of China(Cui and Zou 2016).
The main methods of flood risk assessment include evaluation index and numerical model simulation.Common numerical simulation models include SWAT,CaMa-Flood,and FLO-2D(Hurkmans et al.2010).Hirabayashi et al.(2013)used the multiple General Circulation Models(GCMs)of CMIP5 coupled with the CaMa-Flood model to simulate the global 100a flood inundation characteristics,and they estimated that the population exposed to flood disasters will increase tenfold by the end of the 21st century.In the existing studies,flood risk assessment was mainly conducted for large-or medium-sized basins.One of the main reasons for the lack of flash flood risk assessment in small basins under climate change is the coarse accuracy of climate models in simulating rainfall conditions,which could not consider factors such as tropical cyclones(TCs),topography,and regional circulation that cause extreme rainfall within small areas(Lafon et al.2013).
Flood damage assessment is mostly conducted by considering direct economic damage(Armal et al.2020).Quantitative assessment of flood disaster risk is usually based on a damage model,which combines the characteristics of the inundation depth,inundation extent,flow velocity,or other hazard factors of flood events with socioeconomic elements(Dutta et al.2003;Merz et al.2010).But the existing flash flood risk assessments often focus on the characteristics of the hazard,with less attention paid to the joint effect of climate change and socioeconomic changes on the risk drivers of flash floods(Liu et al.2018).
In this study,we conducted a quantitative assessment of flash flood disaster risks.The study took the tropical cyclones–extreme precipitation–flash floods chain effects as an example,and had two main objectives.The first was to obtain the changes of flash flood risk under climate change,and the second was to explore the driving factors behind the changes of flash flood risk.We selected the Yantanxi River Basin in Yongjia County,Zhejiang Province as the study area,which is frequently affected by flash floods.We first constructed an index system of flash flood risk assessment and used the hydrologic-hydrodynamic model to determine the inundation characteristics with the same probability of flash flood disaster events.Second,we combined the result of the hazard identification with the regional asset value,and assessed the flash flood risk through the regional damage model considering climate change.Third,the geographical detector model was used to explore the driving factors of the flash flood disaster risk changes.
2 Data and Methods
In this section,first,the characteristics of the main geographical elements in the study area are described.Second,we describe the multi-source data used in this study.Finally,the risk assessment method of flash flood is described in detail.
2.1 Study Area
Yongjia County is in Wenzhou City,Zhejiang Province(Fig.1),with a land area of 2677 km2.Yongjia is located on the north bank of the lower reaches of the Oujiang River,and four mountainous rivers,including the Nanxi River,are distributed in the region.The area of rivers and lakes is 112.7 km2,accounting for 4.2%of the county’s area,and the landforms include mountains,hills,and plains,of which hills and mountains account for 85.6%of the county area.Yongjia is in the subtropical monsoon climate zone with a warm and humid climate.From 1949 to 2000,the county was affected by 60 tropical cyclones,accounting for approximately 35%of the total TCs that affected Zhejiang Province.During this time period,29 TCs caused flood disasters in Yongjia,and 71%of the flash flood disaster events were caused by tropical cyclone-induced extreme precipitation (Dai 2006;Liao 2009).Yongjia County has a history of more than 1,800 years,with rich natural and ecological resources.The county received 15.57 million tourists and achieved tourism revenues of CNY 17.97 billion11 CNY=0.158 USD.in 2019,which accounted for 40%of the county-level revenues(Yongjia County Bureau of Statistics 2020).The regional tourism resources and tourists are exposed to the risk of flash floods(Liao 2011).As a major upstream tributary of the Nanxi River,the Yantanxi River is originated in the northwest of the Dashijian Mountain(elevation of the highest peak is 1240 m),with a total length of 131.89 km.In the upstream tributaries of the Nanxi River,the Shizhu hydrological station manages the hydrological information.The Yantanxi River Basin is in the northern part of Yongjia County(120°24′E-120°48′E and 28°22′N-28°36′N).The total watershed area is 687.62 km2(Fig.1)and covers four administrative units in Yantan Town with a total population of 20 thousand according to the 2017 census.The area is famous for the dense distribution of ancient villages and the Sihai Mountain Forest Park.In July 2005,Super Typhoon Haitang made landfall in Wenzhou,and the Yantanxi River Basin experienced heavy rainfall from 0:00 on 19 July to 11:00 on 20 July.During the impact period,the flood level reached 8.55 m in Yongjia urban area,and the main roads were washed out,with direct economic damage amounting to CNY 3.48 billion(in 2019 prices),and the tropical cyclone-induced rainfall further triggered flash floods in the northern mountainous areas,including the Yantanxi River Basin (Liao 2009).The natural resources and socioeconomic elements of the Yantanxi River Basin are frequently exposed to flash floods,making it necessary to develop a study of the flash flood risk changes within the area.

Fig.1 Geographical location of the study area in southeastern China(the red boundary delineates the main study area)
2.2 Data
The data used in this study include meteorological data(the observed rainfall,tropical cyclone track,and climate model data),geographic information data(DEM,soil type,and land use),and socioeconomic data(GDP,population,and asset values).
2.2.1 Meteorological Data
Tropical cyclone track data were retrieved from the Shanghai Typhoon Institute of the China Meteorological Administration(CMA-STI)tropical cyclone best track dataset.2www.typhoon.org.cn.The dataset includes the typhoon time;the typhoon center latitude and longitude,minimum pressure,and maximum wind speed;and the typhoon scale elements(Ying et al.2014).
The observed rainfall data were derived from the hourly precipitation dataset of the ground climate data also provided by the CMA.There are six meteorological stations that contribute the rainfall data in the study area—Jinyun,Yueqing,Linhai,Qingtian,Yongjia,and Xianju.The weight of each meteorological station’s rainfall contribution to the rainfall of the study area is calculated by the ratio of the area between the river basin and the Thiessen polygon(Fig.1).The calculation result shows that Yongjia station has the largest contribution to the regional rainfall.The observed rainfall data from 1971–2019 were selected for each station to ensure the same rainfall time series length.
Climate model data were obtained from the NASA Earth Exchange Global Daily Downscaled Projections(NEXGDDP)high-resolution dataset released in 2015.3www.nccs.nasa.gov.This dataset downscales the 21 climate models participating in CMIP 5 by bias correction,including precipitation and temperature,with a spatial resolution of 0.25°×0.25°and a temporal resolution of daily(Chen et al.2017).The two representative concentration pathways (RCPs)were RCP4.5 and RCP8.5.The RCP4.5 scenario assumes a reduction of greenhouse gas emissions with government intervention as a medium concentration emission scenario that is similar to the current climate change scenario(Moss et al.2010;Hurtt et al.2011).The RCP8.5 scenario is without government intervention and with a predominantly fossil fuel energy source,which is a high concentration emission scenario.The use of RCP4.5 and RCP8.5 scenarios for flash flood risk assessment therefore allows us to visualize changes in flash flood risk at current levels of climate change and under extreme changes.The BCCCSM1.1 data,which exhibit a better rainfall simulation capability in China,were selected from the dataset to define future rainfall scenarios of the study area(Chen 2013;Jiang et al.2015).For this research,we retrieved both historical rainfall data(1950–2005)and forecast rainfall data(2052–2100)from the dataset.
2.2.2 Geographic Information Data
These data were mainly used for flash flood inundation simulation.A digital elevation model(DEM)was obtained from the Geospatial Data Cloud constructed by the Chinese Academy of Sciences,4www.gscloud.cn.with a spatial resolution of 30 m.The land use data are based on the Landsat 8 interpretation of the land surface characteristics of China in 2018,with a spatial resolution of 30 m,and were derived from the Resource and Environment Science and Data Center of China.5www.resdc.cn.Soil type distribution data were obtained from the Harmonized World Soil Database(HWSD)published by the Food and Agriculture Organization(FAO)and available at the National Cryosphere Desert Data Center of China.6www.ncdc.ac.cn.
2.2.3 Socioeconomic Data
The socioeconomic data analyzed in this study were derived from the Wenzhou Statistical Yearbook(Wenzhou Municipal Bureau of Statistics 2019),including population and GDP data for 2005–2019.Disaster data were mainly acquired from the Meteorological Disaster Yearbook,Zhejiang Volume(Wen et al.2006)and the Records of Water Conservancy in Yongjia(Dai 2006),and were used to verify the impact of tropical cyclones in the study area.
The asset value data were retrieved from previous studies.Wu et al.(2014)estimated the asset values of 344 prefecture-level cities in China with the perpetual inventory method.In addition,the researchers combined geographic information data such as lights,roads,and population density to achieve a spatialized dataset of county-level assets and updated this dataset based on 2019 prices(Wu et al.2017;Wu et al.2018).
The IPCC developed the shared socioeconomic pathways(SSPs)in 2011.To bring the dataset more in line with Chinese socioeconomic characteristics,Nanjing University of Information Science and Technology(NUIST)corrected the datasets based on parametric methods,with a spatial resolution of 0.5°×0.5°.7www.geography.nuist.edu.cn.The University used 2010 as the base year and data on key factors such as fertility,mortality,migration rate of the current population,capital stock of the economy,labor force participation rate,and total factor productivity in China were accumulated and form the population and GDP dataset before 2100.This dataset provides data support for studies related to climate change risks at regional and river basin scales,mainly in the areas of energy,water resources,and agriculture(Jiang et al.2018;Huang et al.2019).This study used the corrected dataset and combined the RCP and SSP scenarios(RCP4.5-SSP2,RCP8.5-SSP5)to develop the assessment of the flash flood risk changes in the study area.
2.3 Methods
Based on the regional disaster system theory,the flash flood risk refers to the possible damage in regional socioeconomic systems caused by flood disaster events triggered by heavy precipitation that occurs in mountainous and hilly and river valley areas(Zhang et al.2006;Shi 2016).The flash flood risk can be expressed as(Asian Disaster Reduction Center 2005):

In assessing the flash flood risk,the first step is to analyze the intensity and probability of historical flash flood events to derive the characteristics of flash flood inundation in a case area(Hazard).The second step is to obtain the asset value in areas affected by flash floods(Exposure).The third step is to combine the survey of the damage status caused by historical flood disaster events and obtain the economic damage rate in the region(Vulnerability).Finally,the economic damage under a certain probability of occurrence is determined,and the Risk indicates the variation of economic damage under different scenarios considering the capacity of disaster prevention.
2.3.1 Constructing an Indicator System for Flash Flood Risk Assessment
Considering the characteristics of flash flood hazards,regional exposure,and reference to existing studies(Hu et al.2018;Liu et al.2018;Ye et al.2019;Shi et al.2020),an indicator system of flash flood risk assessment was constructed in this study(Table 1).We chose eight indicators—process rainfall(PR),impact force(IF),flow velocity(FV),population density(PD),GDP density(GD),asset density(AD),per capita GDP(PG),and per capita asset value(PA)—to describe the hazard,exposure,and capacity of disaster prevention for the risk assessment of flash flood disasters.
2.3.2 Flash Flood Hazard Analysis
2.3.2.1 Regional Extreme Rainfall Characteristics Extreme rainfall events often occur along the southeastern coast of China due to the impact of tropical cyclones(TCs),which in turn induce floods in the region(Qiu et al.2019;Fang et al.2020).In this study,TCinduced rainfall is defined as extreme precipitation.Return period(RP)is usually used to predict the probability of the occurrence of extreme hydrometeorological events(Fang et al.2011),thus a RP was defined as the probability of a flash flood disaster event occurring.Based on this definition an analysis of flash flood hazard changes was developed.Existing assessments of the modeling capabilities of climate models indicate that there is a lack of consideration of extreme rainfall characteristics even though the models have been downscaled(Lafon et al.2013;Chen et al.2017).Therefore,it is necessary to extract the extreme rainfall characteristics in the region and take them into consideration in the rainfall model to obtain the flash flood hazard change under future scenarios(Zhang et al.2019).
In the southeastern coastal areas of China,TC-induced rainfall events occur from June to September(Qiu et al.2019),so we considered only the rainfall characteristics during this period of the year.Spatially,the geographic location of the six meteorological stations was adopted as the center,and if a TC moving center is located within 5°(approximately 500 km)from the longitude and latitude coordinates of the station position,the rainfall at the station can be considered a TC effect(Fang et al.2011).Temporally,the rainfall during TC impact periods can be defined as tropical cyclone-induced rainfall(Fang et al.2011).Accordingly,we obtained a set of 153 TCs that affected the Yantanxi River Basin in 1971-2019.In this study,we considered the beginning of a continuous rainfall event as the moment when the hourly rainfall surpasses 4 mm,and the end of the rainfall event occurs when the rainfall remains below 4 mm over the next 6 consecutive hours(Chen et al.2019).We compared the observed rainfall events and the impact TCs,and separated the rainfall into extreme precipitation and regular precipitation.Accordingly,the annual maximum(AM)sequences of observed(1971–2019)extreme rainfall events can be constructed,the Gumbel distribution function was adopted to fit the AM sequences of precipitation to obtain the RPs(Fang et al.2011),and the RPs of precipitation in the historical scenario were obtained.
As the climate model data are available as grid data,rainfall characteristics for the six meteorological stations under the RCP4.5 and RCP8.5 scenarios were obtained by linear interpolation.Thus,the AM sequences of precipitation under climate change scenarios(1950-2100)can be constructed.To include the extreme rainfall characteristics of case area in the climate model,the mean ratio between the rainfall and rainfall intensity of the extreme precipitation events and regular precipitation events at the sixmeteorological stations was used as the model rainfall correction factor.This correction coefficient was used as the starting point,with step sizes of 0.1 and 20 steps to determine the optimal correction factor.We multiplied the AM sequence of the historical scenario in the climate model(1950-2005)by the optimal correction coefficient to derive the corrected series.Comparing the observed(1971–2019)rainfall and model-corrected(1950-2005)rainfall of same RPs(100a,500a,1,000a,and 1,500a),the mean relative error between the two sequences was 0.67%,which occurred within the acceptable error range after considering the extreme characteristics of flood disaster events(Mishra et al.2018).Likewise,this method is appropriate for the future scenarios (2052-2100)correction.

Table 1 Indicator system of flash flood risk assessment
2.3.2.2 Flash Flood Inundation Characteristics To obtain the inundation characteristics of flash floods,this study coupled the semi-fractional Hydrologic Engineering Center-Hydrologic Modeling System (HEC-HMS)hydrologic model with the FLO-2D hydrodynamic model.The HEC-HMS model is used for the acquisition of numerical watershed parameters and the calculation of direct runoff.The HEC-HMS model can be used to simulate runoff processes in basins where hydrological data are lacking,similar to the Yantanxi River Basin.The FLO-2D model is a two-dimensional dynamic model based on continuity and motion equations and,combined with flood rheological characteristics(O’Brien et al.1993),the current model is mainly used to simulate surface flooding and debris flow inundation characteristics of plains,creeks,alluvial fans,rivers,or other artificial channels(Peng and Lu 2013;Mishra et al.2018).The inundation extent,inundation depth,flow velocity,and impact force characteristics of flash floods can be expressed in the defined grid through the FLO-2D.
The HEC-HMS and FLO-2D coupling steps are:(1)The digital elevation model(DEM)was applied on the Geo-HMS tool in the ArcGIS platform to analyze the filling,flow direction,confluence,and basin division aspects and obtained a basin digital model.(2)Through application of the basin digital model and substitution of the rainfall sequence into the HEC-HMS model,we defined simulation start and end times to obtain the hydrological characteristics of the basin.(3)Clear water flow process lines were input,as retrieved from the HEC-HMS model,flood outflow areas were defined in the FLO-2D model,and then we obtained the flood inundation area,inundation depth,impact force,and flood velocity after setting the simulation time and time step.
2.3.3 Exposure Assessment of the Yantanxi River Basin
Exposure analysis is an important basis for disaster risk assessment.First,the unit of analysis needs to be determined.Second,we need to determine the type and the amount of assets that are exposed to flash floods.Due to the limitations of the current data,this study analyzed the exposure characteristics of the study area based on countylevel statistics.The PD,GD,PG,and PA indicators can be obtained through spatial analysis in ArcGIS.The asset value was defined as total areal exposure value,which serves as a mixed economic indicator to maximize the portrayal of disaster damage.The spatial distribution of asset values in the future i-th year can be predicted by the coefficient M that indicates the relationship between GDP and asset value in 2019.In this study M=3.5.

Socioeconomic data(population and GDP)with a spatial resolution of 0.5°are still too coarse for the river basin scale analysis.Therefore,they need to be corrected.In this study,we used a linear correction process based on spatial analysis in ArcGIS and the county-level statistical data of 2005-2019,and keep the estimation error only within the county units(Zhao et al.2017).
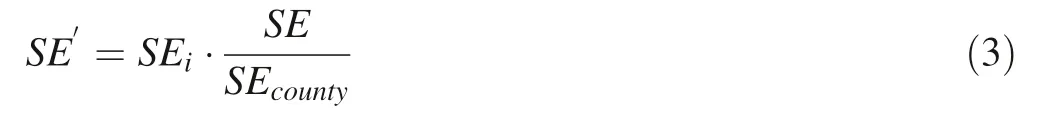
where SE′is the linearly corrected socioeconomic value,SEiis the predicted values for each grid,SE is the historical statistical values,and SEcountyis the predicted socioeconomic element at the county level.
2.3.4 Risk Assessment of Flash Floods
Vulnerability curves for the study area were obtained from the literature—the questionnaire survey data on natural hazards and disasters were generated by Liu(2011)for Shuitou Town(located to the southwest of Yongjia County),Wenzhou City,which has a similar location to Yantan Town.We screened the data to obtain 10 samples,and constructed a damage model based on the SPSS platform to predict economic losses from flash floods in the Yantanxi River Basin.The R2of the damage model is 0.52,and the expression is:

where L is the damage rate of flood disaster,0≤L≤100;and D is the inundation depth,D≥0.
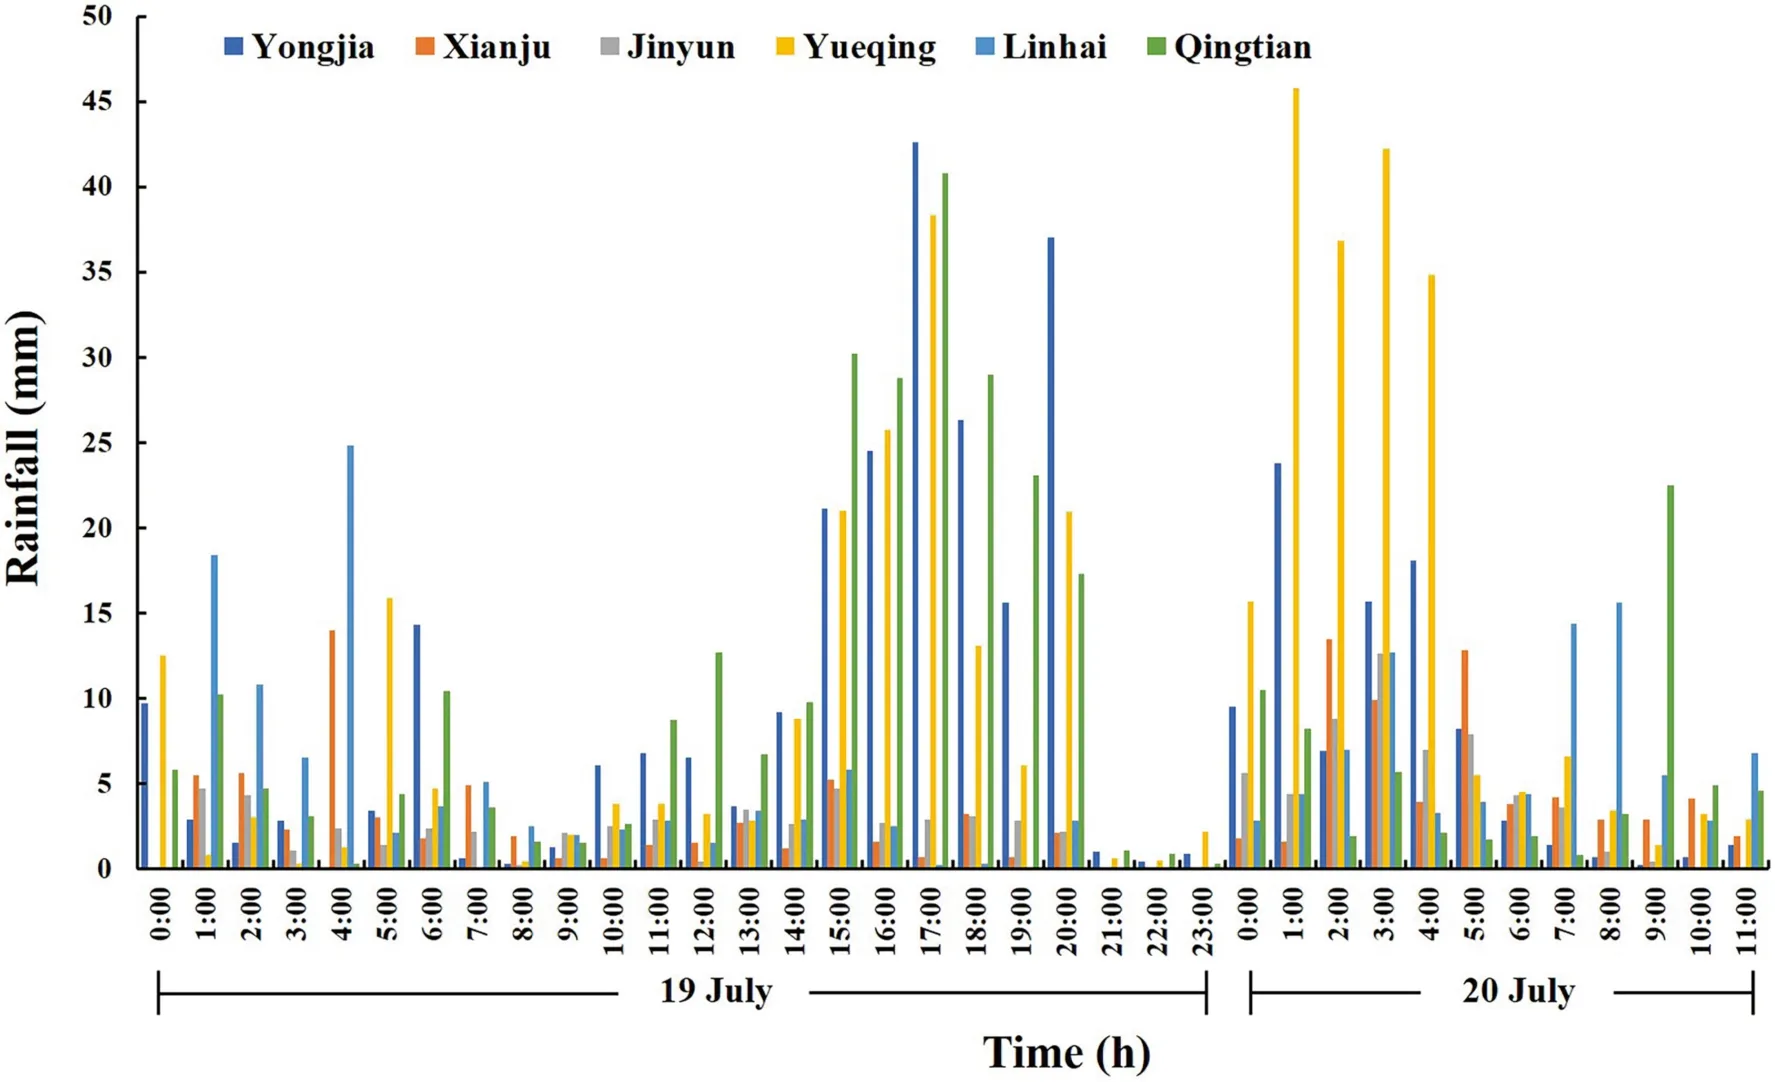
Fig.2 Rainfall process of the 2005 flash flood disaster in the Yantanxi River Basin,Southeastern China
2.3.5 Geographical Detector
The geographical detector provides the technical method for the spatial differentiation of geographic elements and reveals the driving forces behind regional risk changes(Wang et al.2010;Wang et al.2016;Wang and Xu 2017).Through the geographical detector we predicted the contribution of the flash flood impact factors(x)to the risk change(y),and the contribution rate is measured by q:

where h=1,2,...,L is the grading of the independent variable x,and Nhand N are the number of samples at level h and the entire area.Theσ2andindicate the variations in the entire area and level h,respectively.The value range of q is 0 to 1,and a larger value of q indicates a higher contribution rate of the x to the y(Wang et al.2010;Wang and Xu 2017).
The geographical detector requires the input independent variable to be a discrete type quantity,so the results of the study need to be discretized according to a defined hierarchy.The natural break method is often used in the process of disaster risk assessment(Shi 2016).The method considers the existence of breakpoints in the array,while maximizing the similarity within each group and maximizing the difference between the classes:
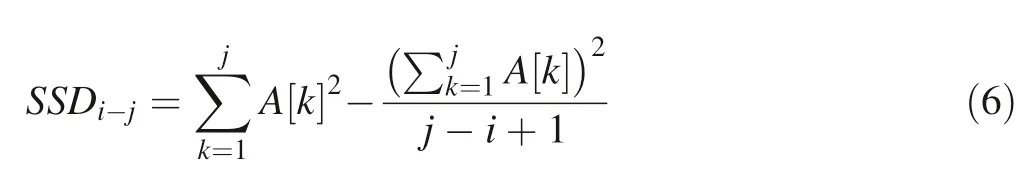
where SSD means variance,i and j refer to the i-th and j-th elements,A refers to an array of length N,K indicates the K-th element in group A,and the K value ranges between i to j.
3 Results
We used the hazard assessment model and vulnerability model presented in the previous section to predict the change in risk of flash floods with same probability of occurrence,and analyzed the driving factors of the risk change.
3.1 Risk Assessment of Flash Floods
As described in Sect.2.1,the Yantanxi River Basin experienced heavy rainfall from 0:00 on 19 July to 11:00 on 20 July 2005 through Super Typhoon Haitang,and the process rainfall records of the 2005 flash flood disaster event from the six meteorological stations are shown in Fig.2.In the 2005 flash flood disaster event,the process rainfall at Yongjia station was 328.76 mm(83a),and the rainfall at the Yueqing station was the most extreme,reaching 394.44 mm(120a).Considering the results of the meteorological station weighting and the definitions in 2.3,the return period of the 2005 flash flood was estimated at approximately 83 years.Under the RCP4.5 and RCP8.5 scenarios,the rainfall with the same RP at the Yongjia station is 405.11 mm and 483.96 mm,respectively,with an increase of 76.35 mm and 155.2 mm.The other five meteorological stations had an average increase of 23.94%and 49.46%in the same RP rainfall(Table 2).Then,the hourly rainfall assignments for future rainfall events were made based on historical rainfall processes.

Table 2 Variation of rainfall(mm)under different scenarios in the Yantanxi River Basin,Southeastern China
Based on the assumption that the surface characteristics remain unchanged,the flash flood hazard under different scenarios can be expressed through FLO-2D.The results show that the change in flash flood inundation extent is not significant,and the hazard is increasing with the same probability of the disaster event.The flash flood inundation area under the future scenario(2052-2100)increases over the historical scenario(2005),which attains an inundation area of 36.44 km2and increases by 3.41%and 7.10%under the RCP4.5 and RCP8.5 scenarios,respectively.The area with an inundation depth ranging from 2.00–3.00 m under the RCP4.5 scenario is 8.26 km2or 71.32%larger than that under the historical scenario.The area with an inundation depth ranging from 3.00–4.00 m also changes under the RCP8.5 scenario,and is larger than that under the historical scenario by about 87.78%.Moreover,considering an inundation depth greater than 4.00 m,the area under the future scenarios increases 0.11 km2and 3.35 km2,respectively.Under the historical,RCP4.5,and RCP8.5 scenarios,the percentages of areas with inundation depth>2.00 m are 8.59%,25.32%,and 38.36%respectively,while the percentages of areas with inundation depth<2.00 m are 91.14%,74.68%,and 61.64%,respectively(Fig.3).
Considering the regional exposure characteristics,the flash flood risk assessment results indicate that a total asset value of CNY 0.73 billion(2019 prices)was exposed to the 2005 flash flood disaster event.Based on the predicted recurrence time of the 2005 disaster event,the asset value can be calculated through the GDP in 2088,to obtain the damage caused by flash floods under future scenarios.Under the RCP4.5-SSP2 and RCP8.5-SSP5 scenarios,the exposed asset values are expected to reach CNY 7.36 billion and CNY 13.85 billion,respectively.We estimated the economic damage in the 2005 flash flood disaster event was CNY 0.13 billion.Under the RCP4.5-SSP2 and RCP8.5-SSP5 scenarios,the economic damage due to flash floods is expected to reach CNY 1.16 billion and CNY 2.94 billion,respectively,and the risk of flash flood increases by 88.79%and 95.57%,respectively.The proportion of economic damage in the areas with inundation depth>2.00 m under the historical,RCP4.5-SSP2,and RCP8.5-SSP5 scenarios is 9.37%,45.77%,and 70.03%,respectively,while the proportion of economic damage of inundation depth<2.00 m areas is 90.63%,54.23%,and 29.97%,respectively(Fig.4).
3.2 Analysis of the Driving Factors of Change in Flash Flood Risk
This study examined the variation of risk driving factors in different areas through a simple 100 random sampling,and the mean contribution of driving factors is shown in Fig.5.Among the hazard indicators,process rainfall(PR)has the largest contribution rate,with 0.59,0.79,and 0.85 under the historical,RCP4.5-SSP2,and RCP8.5-SSP5 scenarios,respectively,with an increasing trend in the contribution to flash flood risk.The contribution of impact force(IF)to risk shows a fluctuating decrease with an average contribution of 0.26.The contribution of flow velocity(FV)to changes in flash flood risk is the weakest,with an average contribution of 0.10.Impact force and flow velocity correlate with changes in surface features in the study area.Among the exposure indicators,the contributions of GDP density(GD)and asset density(AD)to risk are significantly prominent,with the contribution of GD being 0.84,0.82,and 0.89 under the three scenarios,respectively,which is better than the other indicators to explain the risk variation characteristics of flash floods in the Yantanxi River Basin.As the population decreases under the future scenario,the contribution of population density(PD)to risk tends to decrease to 0.74,0.72,and 0.56,respectively.The development of socioeconomic factors promotes the increase of regional inputs and the strengthening of regional protection capacity,thus the contribution of per capita asset value(PA)to risk shows a significant decreasing trend,and its contribution is 0.59,0.53,and 0.20 under the historical,RCP4.5-SSP2,and RCP8.5-SSP5 scenarios,respectively.The mean contribution of per capita GDP(PG)is 0.64.In general,the natural and socioeconomic factors combine to increase the risk of flash floods in the Yantanxi River Basin.According to the mean contribution rate of each indicator under the three scenarios,the main factors that affect the flash flood risk change in the basin are GD(q=0.85)>PR(q=0.74)>AD(q=0.68)>PD(q=0.67).
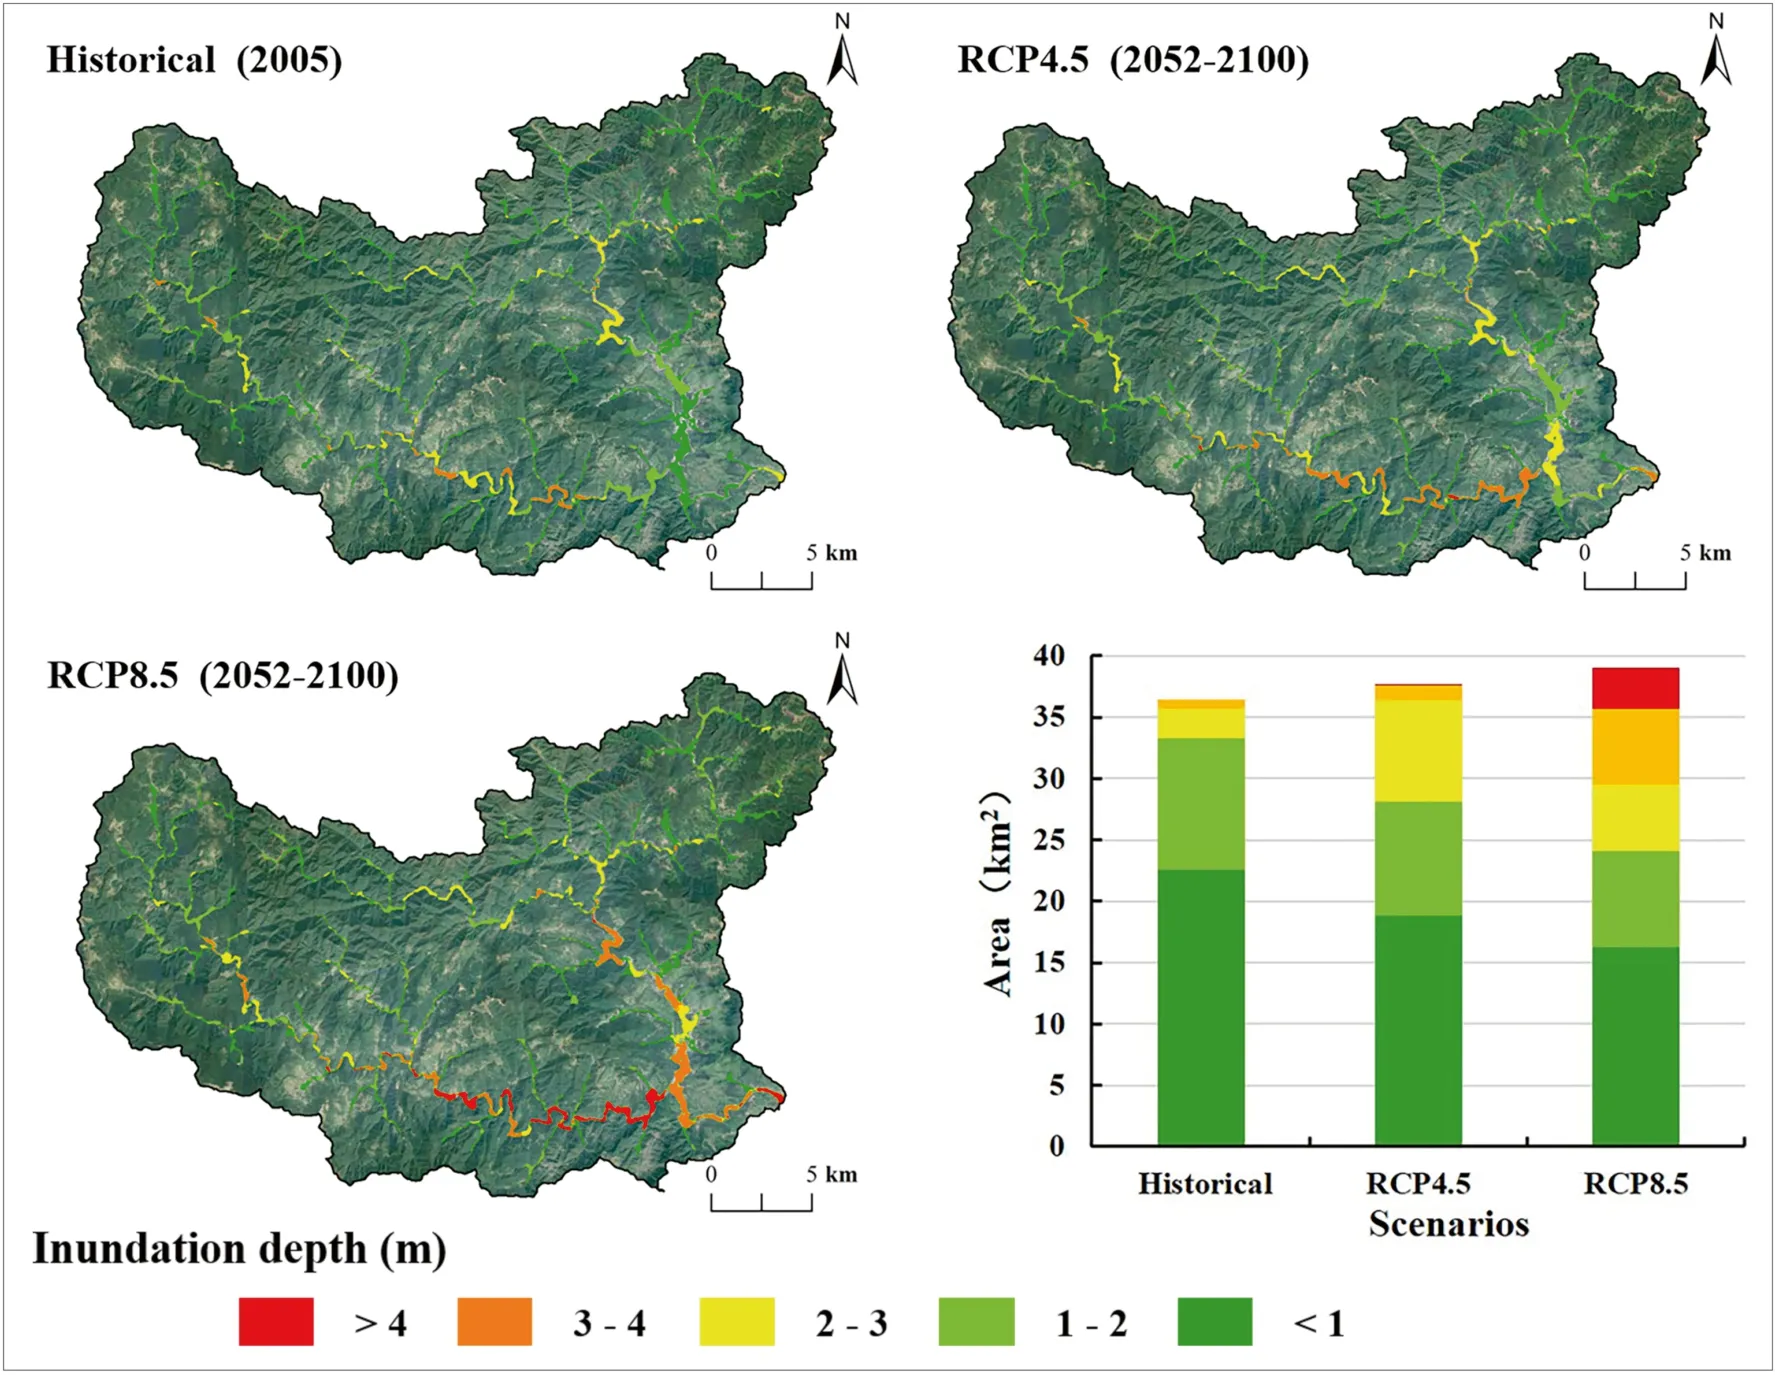
Fig.3 Flash flood inundation change under historical(2005)and future(2052-2100)scenarios in the Yantanxi River Basin,Southeastern China
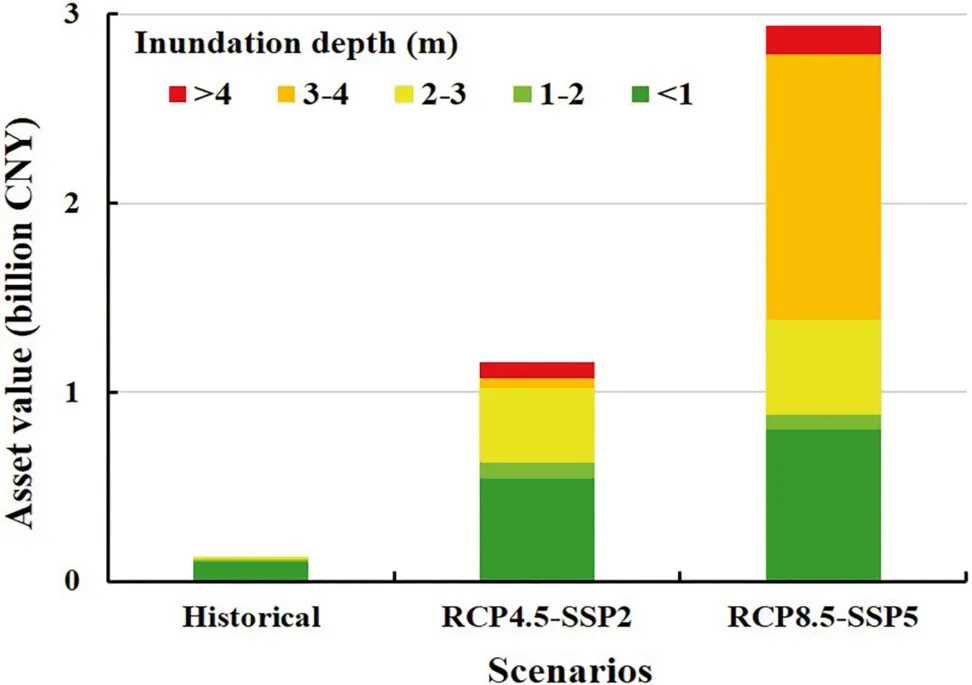
Fig.4 Change of flash flood disaster risk under the historical(2005),RCP4.5-SSP2(2052-2100),and RCP8.5-SSP5(2052-2100)scenarios in the Yantanxi River Basin,Southeastern China
4 Discussion
In this study,based on the principles of disaster risk assessment,we identified the flash flood risk assessment indicators and used them under a combination of the RCP and SSP scenarios to obtain the changes of flash flood risk in the Yantanxi River Basin in the context of climate change,and predicted the contributions of the driving factors behind the risk change.
Under the RCP4.5-SSP2 and RCP8.5-SSP5 scenarios,the area affected by flash floods is increasing in the Yantanxi River Basin,which is consistent with the characteristics of flash floods in other river basins(Chen et al.2019;Yang et al.2020).The NEX-GDDP dataset downscales the rainfall of future scenarios by means of bias correction,which better reflects the Chinese rainfall characteristics and can be better applied to the analysis of the rainfall characteristics at the river basin scale(Chen et al.2017;Zhang et al.2019;Li et al.2020).Inevitably,after downscaling,there are still internal errors in the choice of parameters within the climate model(Chen et al.2017).In addition,the effect of the elevated topography in the region is such that the climate model underestimates the extreme precipitation characteristics of the region(Lafon et al.2013).To this end,considering the impact of tropical cyclones on rainfall in the study area,this study used tropical cyclone-induced rainfall as a representative of extreme precipitation in the region,the rainfall characteristics of six meteorological stations were extracted through spatial and temporal element analysis(Fang et al.2011),and the impact of these characteristics were added for future scenarios.Because rainfall is the main trigger of flash floods,the corrected rainfall data provide the basis for flash flood risk assessment.To better reflect the changes of flash flood risk with the same disaster event probability,this study assigned future scenario rainfall according to the historical rainfall process.Due to the lack of data on hydrological elements,we coupled the HEC-HMS and FLO-2D models to obtain the characteristics of flash floods under different scenarios.Based on the assumption of constant subsurface characteristics,the impact areas of flash floods in the Yantanxi River Basin increased by 3.41%and 7.10%under the RCP4.5-SSP2 and RCP8.5-SSP5 scenarios(2052-2100),respectively,compared with the historical scenario(2005).Differences in characteristics—such as the location of the study area,the characteristics of regional rainfall,selection of climate model data,model downscaling methods,subsurface,and hydrological elements—can lead to different predicted risk results(Hurkmans et al.2010;Lafon et al.2013;Dahm et al.2016).
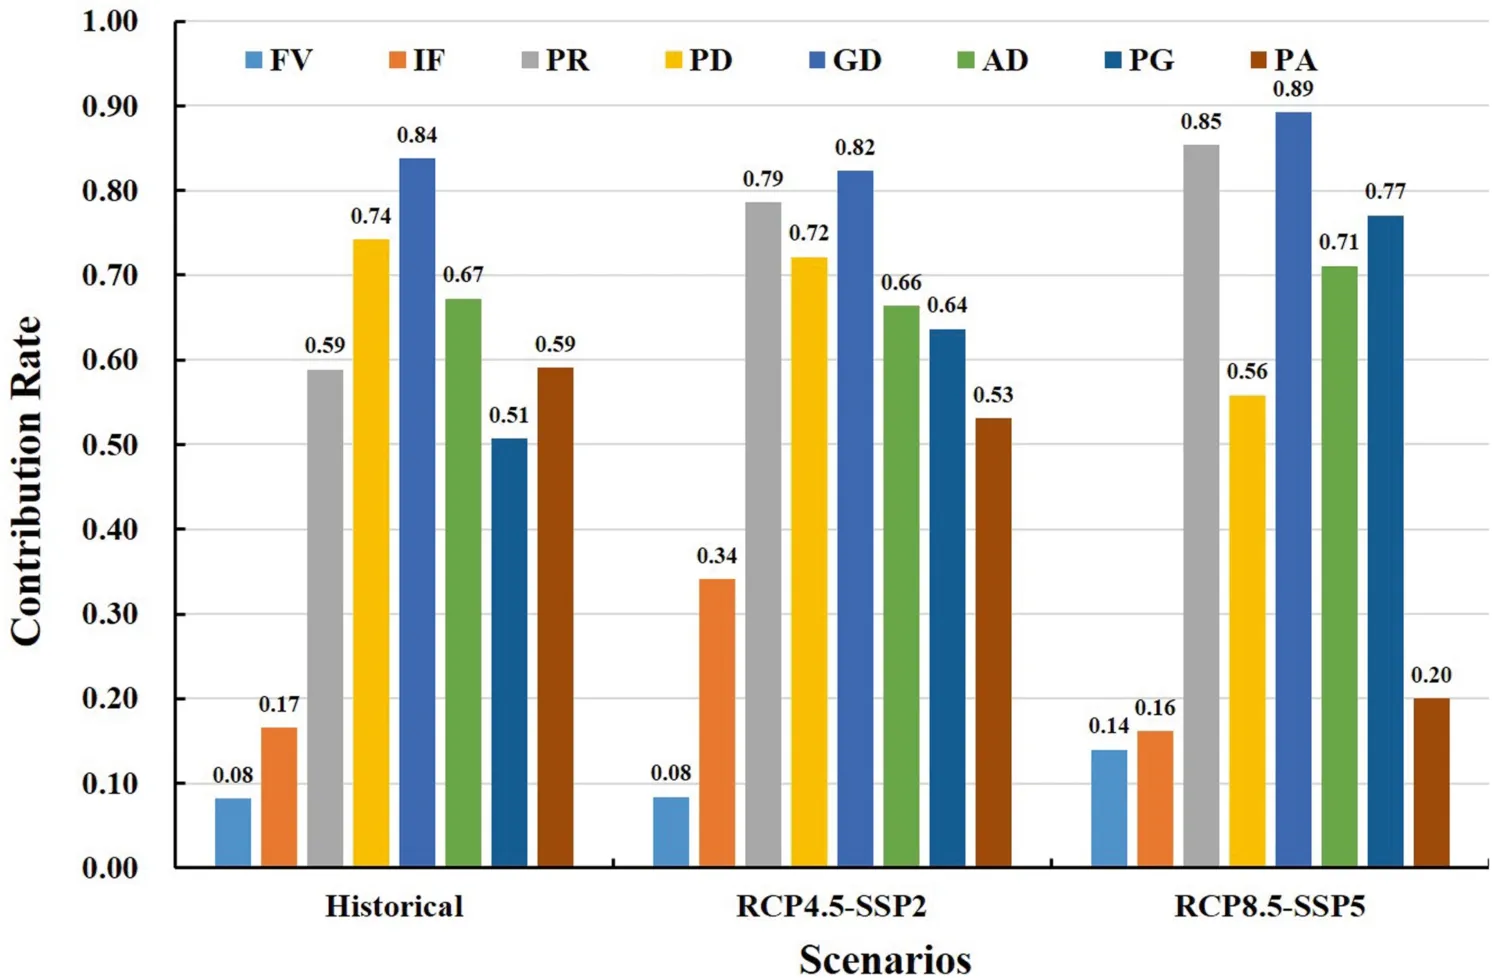
Fig.5 Contribution rate of the eight indicators to flash flood risk in the Yantanxi River Basin,Southeastern China.FV Flow velocity,IF Impact force,PR Process rainfall,PD Population density,GD GDP density,AD Asset density,PG Per capita GDP,PA Per capita asset value
Under the future scenarios(2052-2100),the risk of flash floods in the Yantanxi River Basin increases by 88.79%and 95.57%compared with the historical scenario(2005).According to the definition of flash flood risk,the change in its risk is expressed quantitatively in terms of economic damage(Shi 2016).First,considering the principle of similarity of location,we selected the disaster survey data and constructed the vulnerability curves of flash floods in the Yantanxi River Basin,while introducing the asset value to maximize the portrayal of economic damage caused by flash floods(UNDRR 2013;Wu et al.2014;Li et al.2017).Nanjing University of Information Science and Technology(NUIST)localized SSP data after considering the characteristics of Chinese socioeconomic elements,which provides data support for climate change risk studies at regional and river basin scales(Jiang et al.2018;Huang et al.2019).In order to reduce the variation in spatial resolution and keep the error in the results only within the region,the socioeconomic characteristics of the future scenarios were corrected for the relationship between the statistical data and the forecast data(Zhao et al.2017).Based on the corrected SSPs,we predicted the flash flood risk for future scenarios under the assumption of constant vulnerability of the exposed assets.Differences in disaster exposure values (such as GDP, housing replacement cost,and so on),the change of region vulnerability,and correction methods of socioeconomic data will lead to differences in the results of risk assessment(Dutta et al.2003;Pistrika et al.2014;Armal et al.2020).
Based on the constructed flash flood risk assessment indicator system,the driving factors for the change of flash flood risk are GD>PR>PD>AD.The risks in this study are expressed in terms of economic damage,the changes of which are closely related to the development of GDP.The geographical detector provides a reference for detecting the spatiotemporal heterogeneity of geographical things,and further reveals the characteristics of the driving factors behind the risk changes(Wang et al.2010;Wang et al.2016;Wang and Xu 2017).Geographical detector analysis requires discrete variables.The natural break method in disaster risk assessment was used to discretize the independent and dependent variables in this study.Liu et al.(2018)used the geographical detector to analyze the spatial distribution characteristics of flash flood disasters in China and pointed out that the main driving factor is precipitation.In their research,11 ecological zones in China were taken as the research area,and the indicators,including rainfall and human activities,were selected to detect their driving effects on historical flash flood events in China from 1951-2015(Liu et al.2018).One of the reasons why their findings differ from this study is that their variables were discretized by the centroid comparison method,and the system of indicators chosen also differed from this study.Thus,the resulting final detected impact factors are different from our research.Therefore,factors such as research scale,risk expression,and the choice of the factor discretization method can lead to differences in the detected impact factors(Wang and Xu 2017;Gusain et al.2020;Rong et al.2020).
There are limitations in our study and improvements can be made in three aspects:
(1)Considering more factors that affect the extreme rainfall to improve the assessment of hazard changes in the study area.Although based on the existing research,there are still errors with observed precipitation due to the large uncertainties in tropical cyclones and the difficulties in the simulation of TCs and their impacts by climate models(Sobel et al.2016;Ye et al.2019).In future studies,the factors that affect extreme rainfall such as topography and regional circulation should also be considered,in order to improve the accuracy of regional extreme rainfall prediction(Sun et al.2015).Based on the available data,this study used meteorological station data to analyze the rainfall characteristics in the study area,and the errors arising from the results would be greater than the results from gauge stations.Moreover,we selected only a single climate model with better simulation ability in China and carried out our analysis of precipitation characteristics under future scenarios using this model.Chen et al.(2020)used CMIP3 and CMIP5 data to investigate the changing characteristics of typhoon–rainfall–landslide features in Taiwan in the context of climate change.Their findings show that the ensemble scenarios method can minimize the uncertainty in the assessment results compared with each individual model,and the most extreme change features can be identified(Chen et al.2020).In future studies,the ensemble method can be used to simulate regional extreme rainfall and the effect on flash floods(Mishra et al.2018;Goodarzi et al.2019).
(2)Considering the impact of the surface characteristics on the flash flood risk assessment.In this study,we developed the simulation of flash flood hazard under the future scenarios based on the assumption that subsurface characteristics remain unchanged,which increases the uncertainty of flash flood risk assessment.Lin et al.(2020)elaborated on an approach that employs a future land-use simulation model(FLUS)for 100a coastal flood risk assessment,and the results indicate that there is a significant contribution of subsurface changes to flooding hazard.In future studies,we can predict the changes of surface features such as random forest by machine learning algorithms,so that the impact of surface features on flash flood risk can be incorporated(Deshmukh et al.2013;Wang et al.2021).
(3)The method of risk assessment needs to be improved.In this study,vulnerability curves were constructed based on the town-scale flood disaster survey of Wenzhou City in 2011,and correction of the vulnerability curve was lacking in the risk assessment of future scenarios.At the same time,the sample size of disaster data has an impact on the accuracy of damage predictions.In addition,this study used asset values as the characteristics of exposure and predicted asset value under future scenarios based on the relationship coefficient,without considering the changes of the area.In future studies,the vulnerability curve can be updated by means of a local survey,or improved by appropriate parameter correction(Pistrika et al.2014;Zhang et al.2021).With the improvement of disaster database construction and spatialization methods,the prediction of regional exposure value can be improved(Ma et al.2014;Chen and Nordhaus 2015;Wu et al.2018).Since this study focused on the application of natural hazard risk assessment methods in the context of climate change,the assessment results contain many uncertainties.The uncertainty in the assessment results can be quantified by probability theory in future studies(Yi et al.2014).
5 Conclusion
Using the publicly available data and based on existing research,this study conducted a flash flood risk assessment under climate change in the Yantanxi River Basin of southeastern China.The results show that compared to the historical scenario(2005),the areas affected by flash floods increased by 3.41%and 7.10%respectively under the RCP 4.5(2052-2100)and RCP 8.5(2052-2100)scenarios,which is not a very significant change.In addition,there is a decreasing trend for the areas with an inundation depth below 2 m,whereas the areas with inundation depth greater than 2 m exhibit an increasing trend.The risk of flash floods with the same probability of occurrence is increasing under climate change.This study constructed the vulnerability curves based on the 2011 flood disaster survey data.Under the assumption of constant vulnerability of the exposed assets,the risk of flash flood disaster increases by 88.79%and 95.57%respectively under the RCP 4.5-SSP2 and RCP 8.5-SSP5 scenarios,compared to the historical scenario.Socioeconomic factors are the main drivers of change in flash flood risks.The geographical detector analysis result shows that the main factors that affect the change of flash flood risk are GDP density,process rainfall,asset density,and population density.
The assessment results highlight that the changes in climatic and socioeconomic conditions increase the risk of flash floods.For people living in areas affected by flash floods,there is a need to increase education and awareness of flash flood precautions.Our findings suggest that socioeconomic development will boost regional disaster prevention capacity,but at the same time drive the increase in flash flood risk.Considering these impacts,balancing economic growth,risk management,and risk avoidance is an important issue that needs to be addressed in the longterm development of the area,which is strongly supported by tourism.
AcknowledgementsWe would like to thank the editors and reviewers for their comments.We also would like to express our gratitude to Professor Jidong Wu’s team at Beijing Normal University,and Professor Tong Jiang’s team at Nanjing University of Information Science and Technology for providing data support.This work was supported by the National Key Research and Development Program(2017YFA0604903,2017YFC1502505).
Open AccessThis article is licensed under a Creative Commons Attribution 4.0 International License,which permits use,sharing,adaptation,distribution and reproduction in any medium or format,as long as you give appropriate credit to the original author(s)and the source,provide a link to the Creative Commons licence,and indicate if changes were made.The images or other third party material in this article are included in the article’s Creative Commons licence,unless indicated otherwise in a credit line to the material.If material is not included in the article’s Creative Commons licence and your intended use is not permitted by statutory regulation or exceeds the permitted use,you will need to obtain permission directly from the copyright holder.To view a copy of this licence,visit http://creativecommons.org/licenses/by/4.0/.
杂志排行

International Journal of Disaster Risk Science的其它文章
- International Journal of Disaster Risk Science
- Machine Learning-Based Evaluation of Susceptibility to Geological Hazards in the Hengduan Mountains Region,China
- Risk Assessment of Tsunamis Along the Chinese Coast Due to Earthquakes
- Typhoon Risk Perception:A Case Study of Typhoon Lekima in China
- Carbon Emission Risk and Governance
- How Participatory is Participatory Flood Risk Mapping?Voices from the Flood Prone Dharavi Slum in Mumbai