Plasma edge density fluctuation measurements via lithium beam emission spectroscopy on EAST
2022-06-01DongguiWU吴东贵GuanghaiHU胡广海ZOLETNIKGuoshengXU徐国盛SiyeDING丁斯晔JianbinLIU刘建斌LinmingSHAO邵林明YifengWANG王一丰RanCHEN陈冉NingYAN颜宁YanCHAO晁燕PingWANG汪平DUNAIANDALiangCHEN陈良andLiangWANG王亮
Donggui WU (吴东贵), Guanghai HU (胡广海), S ZOLETNIK,Guosheng XU (徐国盛), Siye DING (丁斯晔), Jianbin LIU (刘建斌),Linming SHAO (邵林明), Yifeng WANG (王一丰), Ran CHEN (陈冉),Ning YAN (颜宁), Yan CHAO (晁燕), Ping WANG (汪平), D DUNAI,G ANDA, Liang CHEN (陈良) and Liang WANG (王亮),4,*
1 Institute of Plasma Physics, Hefei Institutes of Physical Science, Chinese Academy of Sciences, Hefei 230031, People’s Republic of China
2 University of Science and Technology of China, Hefei 230026, People’s Republic of China
3 Centre for Energy Research, Budapest 1121, Hungary
4 Institute of Energy, Hefei Comprehensive National Science Center, Hefei 230031, People’s Republic of China
Abstract Accurate and stable measurements of edge density fluctuation with high spatio-temporal resolution have been achieved by the lithium beam emission spectroscopy (Li-BES) diagnostic on experimental and advanced superconducting tokamak (EAST).The new narrower band interference filter exhibits good ability to suppress background emission signal even under strong lithium coating of the tokamak.The raw data measured by channels at different spatial locations in avalanche photo diode camera with high chopping frequency show good consistency.Based on the detected experimental data, detailed information of density profile and fluctuation structures is obtained.A clear edge coherent mode in the auto-power spectrum is observed in pedestal region, which is regarded as the dominant factor for the strong pedestal density fluctuation amplitude.The cross-power spectrum analysis further excludes the additional effects of common-mode noises and non-local perturbation,demonstrating that the detected fluctuation is only caused by local density fluctuation.The normalized radial and poloidal wave-number spectra can specify the quantitative changes of radial wavenumber(kr)and poloidal wavenumber(kθ) during the pedestal density fluctuation phase.This new Li-BES system, which can provide more accurate experimental data,allows further studies of edge density fluctuation and complex transport process on EAST.
Keywords: Li-BES, new filter, density fluctuation, 2D turbulence
1.Introduction
In magnetic fusion devices, the edge plasma behaviors play an important role in the confinement improvement,especially when the turbulence is suppressed by poloidal flow shear[1].Measurements of edge fluctuation properties are essential to understand edge plasma turbulence, since they could induce anomalous transport.Edge instabilities are often driven by gradients of density, temperature, pressure or other equilibrium inherent in the magnetically confined plasmas [2].To better understand the relations between density fluctuations and electron density profile, a new diagnostic technique, Li-BES system has been developed and widely utilized in magnetic confinement devices.The most utilization of the Li-BES system is to measure the edge electron density profiles,which is routinely used in ASDEX-U [3], COMPASS [4],DIII-D [5], EAST [6], JET [7], KSTAR [8], LHD [9],TEXTOR [10] and W7-X [11].
Li-BES system has been proven to be a powerful diagnostic technique of edge turbulence besides density profile measurement, since it can provide the measurements of fluctuation intensity and the propagation direction with excellent spatial resolution.The excitation and ionization cross-sections of hydrogen-like lithium atom are less sensitive to electron temperature.Consequently, the excited state population and the resulting emission(Li I(2s-2p),670.8 nm)are functions of the plasma density approximatively.Generally, the relationship is non-local and nonlinear due to the finite lifetime of the excited state and ionization beam attenuation.However, at low plasma density and/or low density fluctuations the beam light emission fluctuation is approximately a local function of density fluctuations and plasma turbulence measurement becomes possible with Libeam.The capability of density fluctuation measurement has been well demonstrated in the previous publication, such as blob [12], zonal flow [13] and turbulence evolution [14].
To improve the performance and extend the turbulence studies to two-dimensional structures, a 4×32 (poloidal ×radial) avalanche photodiode detector array is employed [6].Recently,a new band interference filter with 0.8 nm full width at half maxima (FWHM), narrower than 1.2 nm of the old one,is applied to suppress background light.The background unshifted Li-light emission signal at 670.8 nm is reduced by a factor of 2000, extending the studies to high frequency fluctuations in the 100 kHz range.Usually, the beam FWHM is about 2-3 cm with equivalent ion current 1.5-2.5 mA and the beam energy is 50 keV.Taken together, these advances provide a better Li-BES system than the old system with significantly enhanced turbulence measurement capabilities.In this article, the advantages and limitations of Li-BES turbulence measurement system are presented in detail,and the 2D turbulence information measured by Li-BES system on EAST is introduced for the first time.
This paper is organized as the following way: in section 2, the current Li-BES system and the ability of the new filter to suppress background Li line emission are introduced.The measured light emission intensity,calculated edge beam light fluctuations,error analysis of detected signals from each channel and radial and poloidal wave-number spectrum are presented in section 3.Finally,a brief summary of this paper is given in section 4.
2.Description of the apparatus and raw data
The detailed description of the EAST Li-BES system can be found in the previous publications [6, 15].Here we give a brief overview of the experimental setup of the diagnostic with details of the new interference filter.

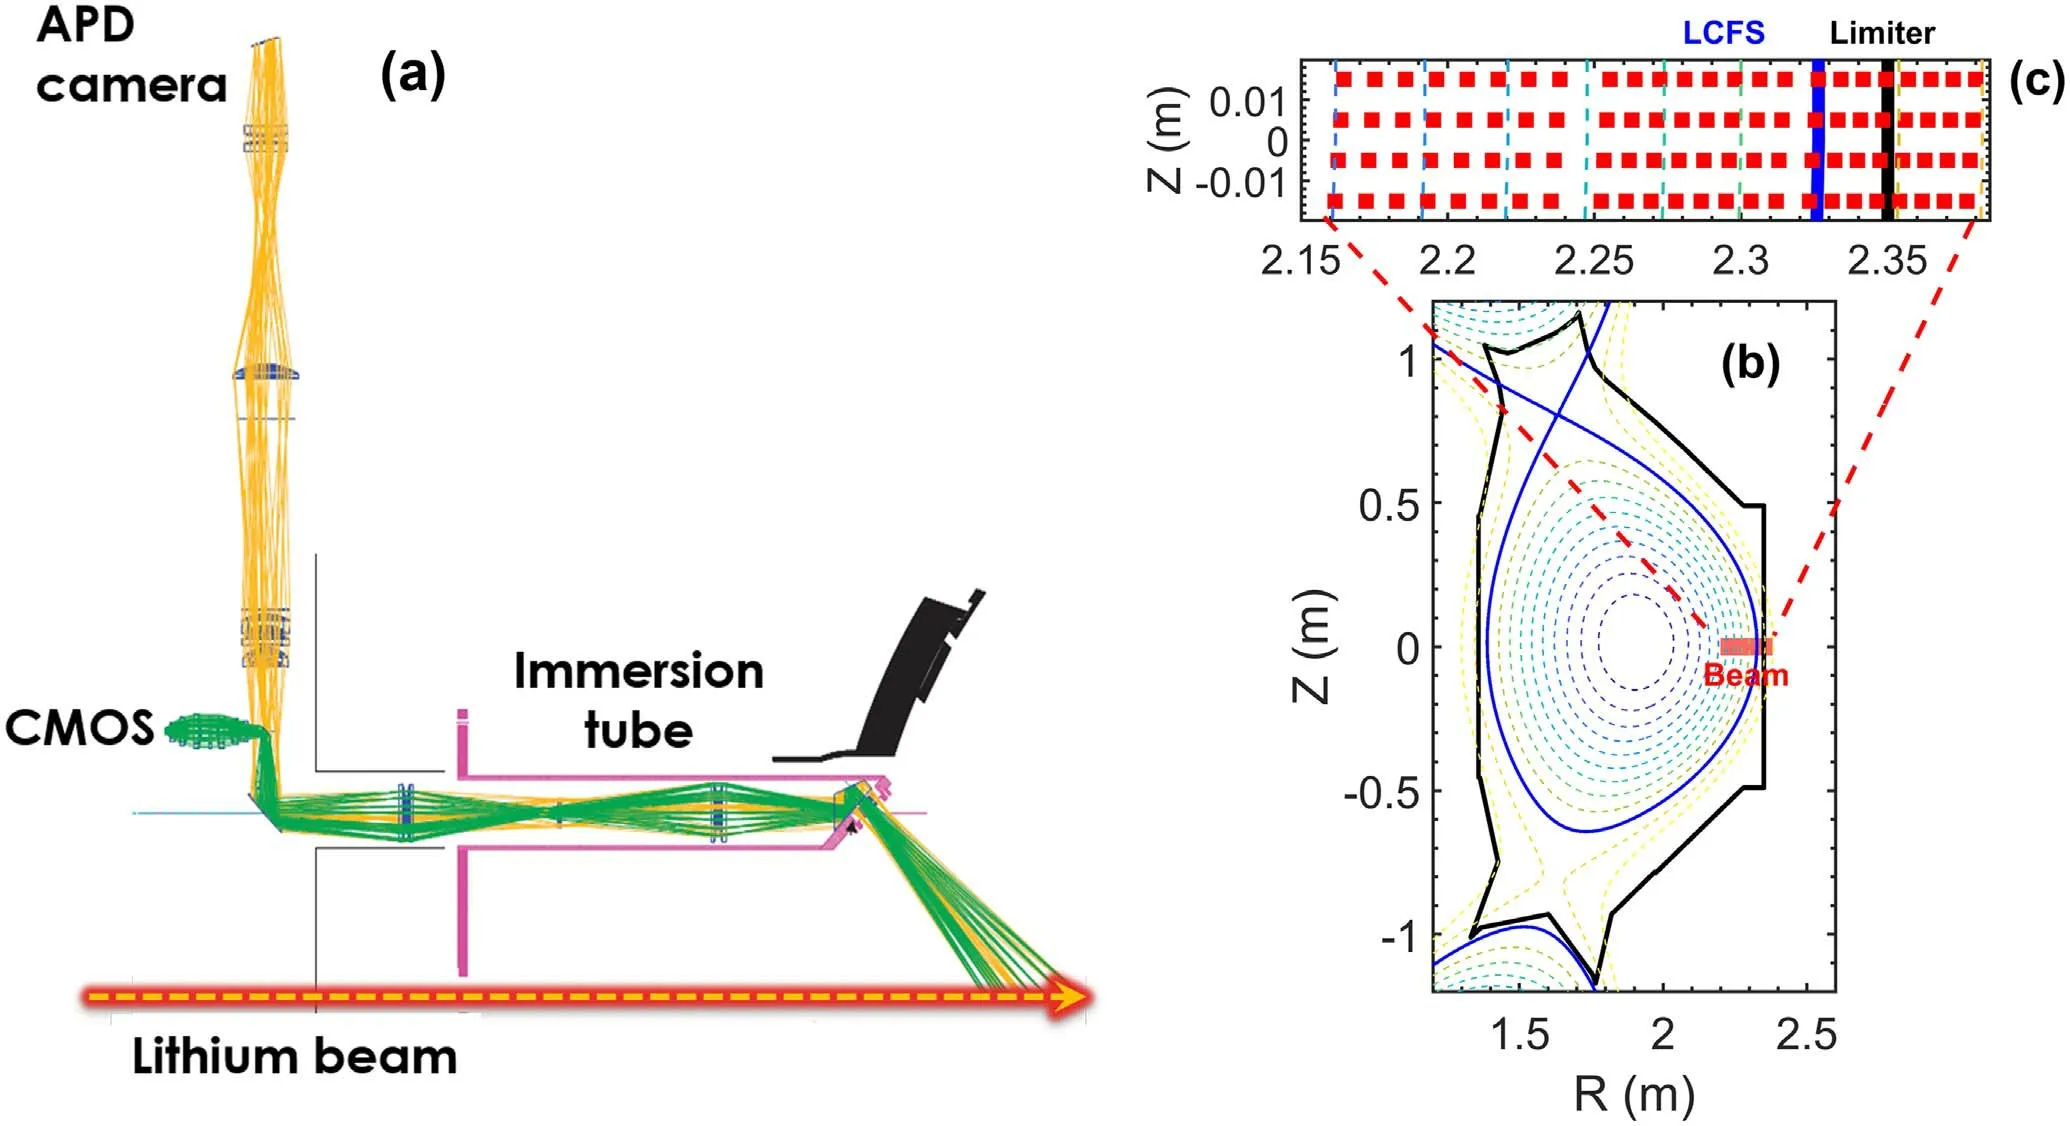
Figure 1.(a) The optical design of the current Li-BES system on EAST, (b) the observation area (red region) of Li-BES diagnostic in the plasma equilibrium flux contours reconstructed by the EFIT code,(c)diagram of the APD detector matrix.128 channels are deployed in a 4(poloidal)×32 (radial) arrangement on the outer radial midplane.

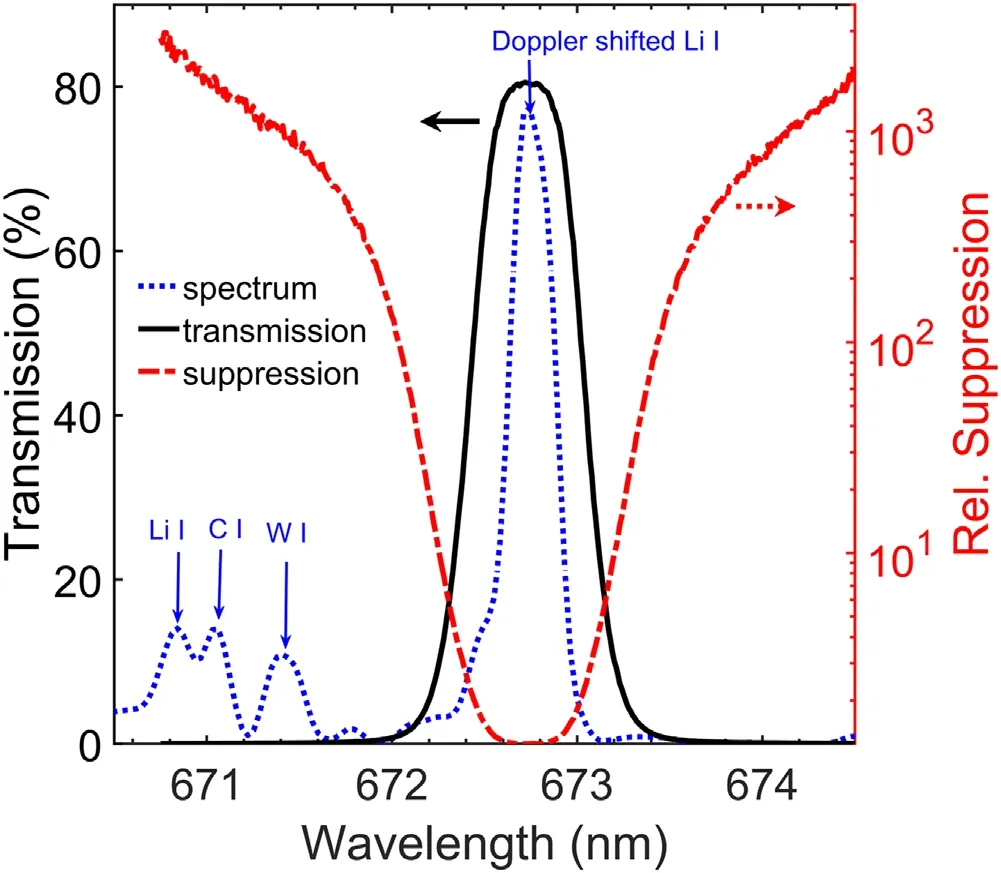
Figure 2.The transmission(right,black)and suppression(right axis,red) curves of new interference filter.The spectrum of an L mode plasma discharge observed by new filter near Ψp = 0.93 in the wavelength range of the shifted Li I line (blue).
The design of the vacuum vessel on EAST permits the beam and the observation window to be located close together on the outer midplane port.As shown in figure 1(a),a 2-3 cm FWHM diameter neutral lithium beam with a beam energy of 50 kV and ion equivalent current of 1.5-2.5 mA is injected into the plasma from the equatorial plane port.The immersion tube is located at the upper left of the beam injection port,resulting in tangential view for simultaneous radial and poloidal measurement.A 4 (poloidal)×32 (radial) APD detector array (APDCAM-10G-4 × 32 from Fusion Instruments) is employed for fluorescent intensity measurement.The pixel size and optical lens set the measured radial spatial resolution to 7 mm at the scrape-off layer (SOL) and about 10 mm at the pedestal top region.In view of the observation angle, there would be intersections of the viewing lines and beam, and usually the two adjacent intersections would have an approximate 50% overlap, so the spatial resolution is defined as the distance of the centers of two adjacent intersections.The ensemble of possible viewing range based on an in situ spatial calibrations is shown in figure 1(b).The enlarged view of Li-BES observation positions overlaid with a magnetic equilibrium reconstruction is shown in figure 1(c).The red squares correspond to the typical detector viewing positions.
EAST upper divertor and limiters are made of tungsten.The lower divertor is covered with graphite tiles and the first wall is mainly covered with molybdenum tiles.Especially,the fusion plasma is usually operated under extensive lithium coated wall conditions.To better suppress background light,a new 160 mm diameter, 0.8 nm bandwidth interference filter has been employed.As shown in figure 2, the peak transmission is over 80% with a central wavelength of 672.7 nm.The background line radiation spectrum is measured in standard L-mode discharge with a new filter and 50 keV lithium beam at around Ψp= 0.93.It reveals that the background light is dominated by Li I,C I,and W I,which could be found on the left side of Doppler shifted Li I peak in figure 2.The narrower bandwidth filter and sharp falling transmission curve provide deep suppression of background line radiation.The red line represents the relative suppression factor of background radiation which is defined by the reciprocal of filter transmission.As shown in figure 2, the unshifted Li I (670.8 nm) is decreased by a factor over 2000,which means that the background radiation has been fully suppressed, and this factor of the old filter is around 500.Consequently, higher quality data of Doppler shifted Li I resonance line emission, emitted by excited Li atoms at a certain spatial measurement point along the straight Li beam injection trajectory,could be obtained,which is beneficial for more accurate edge density profile reconstruction and fluctuation measurements.
Figure 3 shows the raw data detected by four measurement channels in the APD camera during a dedicated EAST shot #70757.This shot was operated at plasma current of 500 kA and line averaged density of 3.2×10¹⁹m-3.The total source power was 5.3-6.8 MW and the ELMs are type-I.These four channels are located at different positions but have the same Li-beam chopping period of 5 ms, and the duration time of the beam-on and beam-off phase is 4 ms and 1 ms,respectively.Chopping the beam periodically at 200 Hz makes it possible to correct the background emission, and sometimes we set the chopping frequency up to 10-100 kHz to follow the ELM events[6].The signals detected by the four channels have similar evolution but different relative light intensities.The prominent peaks shown in beam-on phase of the channel 5 and channel 7 and the bumps in beam-off phase are induced by ELM behaviors.After subtracting the background light intensity profile from beam-off phase,the desired edge electron density profile could be calculated based on the Schweinzer’s density profile reconstruction algorithm [16] or R Fischer’s Bayesian framework probabilistic data analysis method[3].The broad radial and polodial detection regions of APD array and the new interference filter demonstrate the enhanced capability of EAST Li-BES diagnostic system to measure plasma density fluctuation and turbulence in the whole SOL-edge region, which could help to understand the complicated edge plasma behavior and cross-field transport.

Figure 3.The raw data detected by four channels at different spatial locations in APD camera during EAST shot#70757.Blue and yellow shaded regions represent the beam-on phase and the beam-off phase, respectively.
3.Fluctuation and turbulence measurements
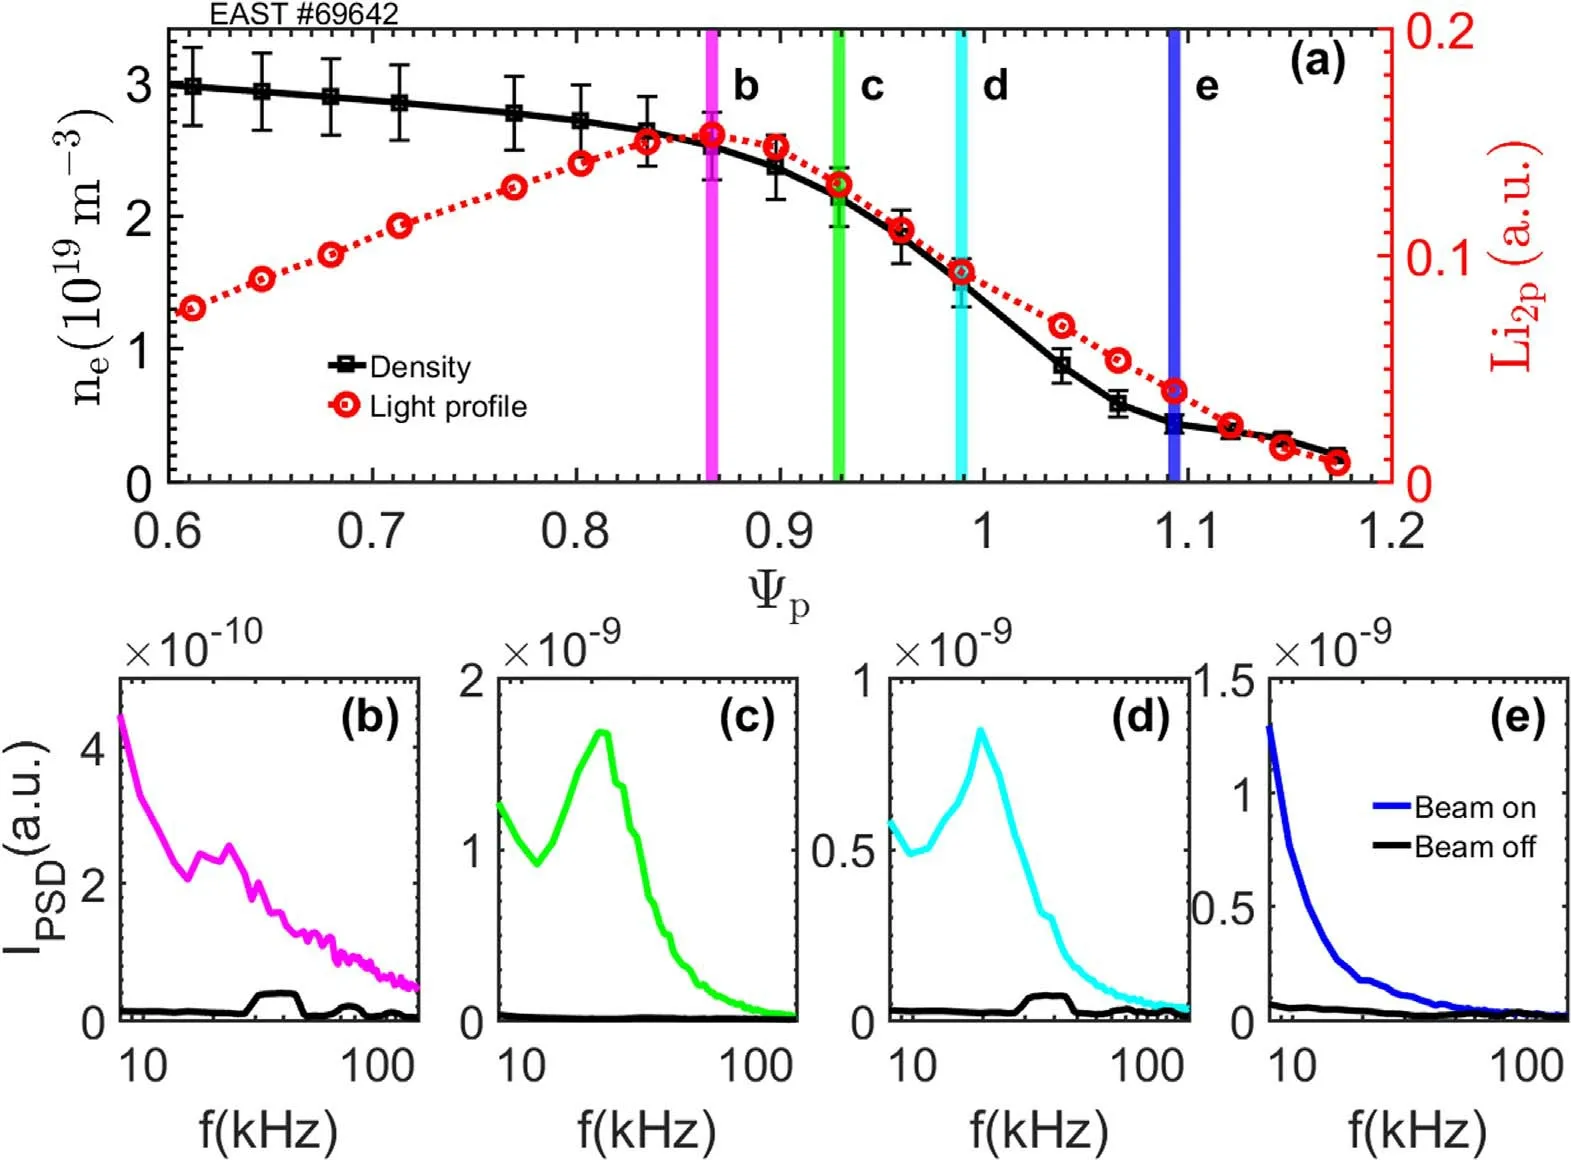
The utilization of the new filter makes it possible to study the abundant density fluctuation and turbulence phenomena on EAST from experimental data.The auto-power spectral density spectra offers a further capability to investigate the fluctuations.Figure 4(a) shows the measured relative light emission profile after the light intensity calibration (red dashed line with circles) and the reconstructed edge electron density profile (black solid line with squares) of EAST H-mode discharge #69642.Besides, the auto-power spectral densities of beam-on phase(colored line)and beam-off phase(black line), measured in the four colored shaded areas corresponding to different normalized poloidal magnetic flux coordinates, are respectively presented in figures 4(b)-(e).This shot was operated at plasma current of 400 kA and the line averaged density was 4.2×10¹⁹m-3.The total source power was 4.5 MW and during 5-7 s, the ELMs were almost fully suppressed using resonant magnetic perturbations with toroidal mode number n = 3 by a 2.7 kA coil.Obviously,signals of beam-on phase have a significantly higher amplitude than those of beam-off phase.Only the signals in 10-100 kHz range are shown because higher frequency part is close to the background noise level.It is worth noting that,in figure 4,the label e represents the SOL region located at Ψp= 1.09 and the labels b,c and d represent the areas inside the last closed flux surface.As shown in these figures, the mode structure is clear in SOL and edge area.They have almost same background noise for beamoff phase which could be negligible but with different signal distributions for beam-on phase.In detail, the single turbulence peak appears at a few tens kHz in figures 4(b)-(d) is edge coherent mode (ECM), which is often observed in the H-mode pedestal steep pressure gradient region and has proven to be driven by steep pedestal gradient [17], but for figure 4(e), the spectral power of the observed fluctuation decreases almost monotonously in the whole frequency range.These results reflect that the Li-BES system on EAST can distinctly detect the ECM in the whole pedestal region.As for SOL region,the ECM is too weak to be measured by the Li-BES system.

Figure 4.(a)Light emission profile(right axis,red)and electron density profile(left axis,black).The multi-colored shaded areas correspond to the radial channels for the analysis.The auto-power spectra for beam-on phase (color line) and beam-off phase (black line) at (b)Ψp = 0.87, (c) Ψp = 0.93, (d) Ψp = 0.98, (e) Ψp = 1.09.
To better evaluate the capacity of Li-BES fluctuation measurement, the total fluctuation amplitude ratio of beam-on and beam-off periods at different locations is shown in figure 5(black line).The fluctuation amplitude is calculated by integrating auto-power spectral over 1-100 kHz frequency range.After fresh lithium wall conditioning, the SOL background intensity level is about 10-30 mV, and the maximum Li-BES signal is several times higher than the background light level.The fluctuation amplitude signal-to-background ratio Aon/Aoffis around 40-100 at the SOL region and over 100 at the inner region.This excellent SNR shows that the new filter could meet the needs of actual measurement, and it is very beneficial for edge density fluctuation measurements.The fluctuation noises are mainly induced by background light and detectors’electronic noise.The electronic noise can be measured by APD camera without any light at torus hall.The fluctuation amplitudes ratio of background light and electronic noise Aoff/Ael(red line) is shown in figure 5 too.Due to higher background light,the ratio value at the SOL region is 3-6.The background light decreases with the beam penetration, Aoff/Aeldecreses linearly and the value is about 2 at the pedestal top.It means that background light fluctuation amplitude and electronic noise fluctuation amplitude are at the same level,which shows that the new filter design target is fulfilled in turbulence measurement.

Figure 5.The total fluctuation amplitude ratios of beam-on and beam-off phases Aon/Aoff (left axis, black), beam-off phase and electronic noise Aoff/Ael (right axis, red) as a function of normalized poloidal magnetic flux coordinate.
The detailed information of edge electron density profile and normalized integrated beam light fluctuation amplitude profile of the same shot is shown in figure 6.According to the reconstructed electron density profile (blue dashed line with squares), the electron density gradient profile is also calculated (red dashed line with circles), and these density distributions are very common in standard H-mode edge and SOL areas.The central frequency of ECM is around 20 kHz.The normalized beam light fluctuation amplitude can be obtained by integrating over the 10-30 kHz frequency range.As shown in figure 6, the fluctuation amplitude has a sharp peak in the pedestal steep gradient area around Ψp= 0.92 and decreases dramatically into the SOL area with a tiny peak around Ψp= 1.08, as the well-known fact in tokamak researches that the density fluctuations have apparent distinctions in edge and SOL plasma[18].According to figure 4,we can judge that the strong fluctuations in the pedestal are dominated by the ECM.Both results from figures 4 and 6 show the ability to provide beam light fluctuation amplitude across pedestal and SOL regions and to judge the specific spatial position of the fluctuation occurrence.Thus, we can obtain approximative density fluctuation amplitude information, although the beam light fluctuation is not always proportional to the density fluctuation and the sensitivity to density fluctuation reduces as the beam goes deeper into the plasma [19].

Figure 6.Electron density profile (left axis, blue), normalized integrated beam light fluctuation amplitude profile (10-30 kHz, left axis, black) and density gradient (right axis, red).
Furthermore, the fluctuation levels in the far-core nearedge region, sometimes dubbed the ‘No Man’s Land’, which is difficult to understand its dynamics but important to coreedge interplay[20],also needs to be diagnosed.However,this region covers the pedestal top area and Li I light intensity decrease accompanies with electron density increase [19].Before the maximum of the Li I light profile, the population via electron excitation from Li 2s state to Li 2p state is the dominant process and electron fluctuations are well reflected.After the maximum of the emission profile, the Li 2p ionization plays the dominant role and the emission lights become less sensitive in the subsequent channels [19].Figure 7(a)shows the auto-power spectra in different radial locations(colored solid line)in shot#71682.This shot was operated at plasma current of 350 kA and line averaged density of 4.5×10¹⁹m-3.The total source power was 9.25 MW and the ELMs were very small with high frequency of 500 Hz.As we can see, all the auto-power spectral signals except the signal measured at Ψp= 0.75 have almost the same distribution,all of them decrease quickly with frequency,but for the signal at Ψp= 0.75, a clear peak appears at around 26 kHz, which is a coherent mode.In this shot,the 9.25 MW source heating power is higher than that in the other two shots and thus the pedestal electron temperature would be higher,therefore the pedestal collisionality would be lower than that in the other two shots,which maybe exceed the collisionality range of ECM, so ECM and pedestal fluctuations are very weak.

Figure 7.(a) Power spectra for different radial locations, (b) normalized integrated beam light fluctuation amplitude profile (red line) from 20 to 40 kHz and correlation coeffient between the fluctuation results from channel at Ψp = 0.75 and other channels (black line).
However, the detection of density fluctuation at the pedestal top region is rather challenging.As mentioned before, the beam is insensitive to small perturbation in this region.Moreover,the measured fluctuations appear non-local and the beam may be influenced by the pedestal or SOL fluctuations via beam attenuation [19].The neutral beam intensity can be modulated by the strong edge fluctuations and the fluctuations are presented in the power spectra at the subsequent channels.Sometimes, a similar phenomenon may be induced from ion source,which is usually called commonmode noise [21].Although this noise usually appears in H-BES, we still need to dispel this possible perturbation for data accuracy.To remove this interference and ensure the validity of the final results, the cross-power spectra (cyan dashed line) of two channels at Ψp= 0.9 and Ψp= 0.75 are shown in figure 7(a).It is obvious from the figure that the cross-power spectra density is very weak and flat in the frequency range of 20-100 kHz.If the fluctuation is induced from the edge fluctuation or ion source, a peak should be detected at around 26 kHz in the cross-power spectra.In other words, this means that the two signals have a very weak correlation and this peak is caused by the local density fluctuation only.To further confirm this, we choose the fluctuation result at 26 kHz from the channel at Ψp= 0.75, and calculate the correlation coeffients between this result and fluctuation results from other channels at the same frequency.As shown in the figure,the coeffient inside Ψp= 0.85 is close to 1 and decreases sharply in the pedestal gradient region,which proves that the fluctuation is localized.Figure 7(b)also shows the normalized integrated beam light fluctuation amplitude profile integrated from 20 to 40 kHz.The fluctuation amplitude increases slowly before it reaches a peak exceeding 2% at Ψp= 0.75, then the fluctuation intensity decreases sharply below 1%.In fact, the normalized fluctuation intensity of the edge-induced fluctuations is approximately independent of the separation.This result means that the Li-BES system on EAST has the capability to deliver density fluctuation measurement at the pedestal top region reliably when plasma edge fluctuations are suppressed.
The above results reveal the excellent performance and sufficient spatial resolution of the EAST Li-BES diagnostic measuring turbulence intensity.Nevertheless, it is more important to know the turbulence properties, such as propagation directions and eddy size.The main detector of the Li-BES system is a 4×32 (poloidal×radial) pixel APD detector array.It provides the chance to study two-dimensional turbulence behaviors.The spatial resolution is about 6 to 10 mm at the edge area, so the k-resolution is less than 3 cm-1.Figure 8(a) shows the time evolution of the fluctuation spectrum at the pedestal gradient region, which is normalized to the induced light intensity separately.As we can see, both the fluctuation intensity and spectral bandwidth are modulated during t = 5.2-5.8 s.In the experiments,using the radial and poloidal spaced channels, the wavenumber-frequency spectral density has been measured by the two-point correlation method for different time slices.By integrating the frequency components on the measured wavenumber-frequency spectral density, we can get the radial and poloidal wave-number spectral density S(kr) and S(kθ).Figures 8(b)and (c) show the wavenumber evolution of the magnitude of the S(kr)and S(kθ),which are normalized by the total values of the corresponding time respectively.The white line shows the peak value of krand kθ.To dispel the noise, we take three beam-on phase fluctuation results and smooth the spectrum in time and wavenumber dimension, respectively.As we can see, during the turbulence broadening phase (t = 5.4-5.6 s),the estimated values of the radial wavenumbers decrease from 2 to 0.4 cm-1quickly, while the poloidal wavenumbers increase slightly from-0.3 to-0.75 cm-1.Here,the positive krmeans propagating radially outwards and the negative kθmeans rotating in the electron diamagnetic drift direction in the lab frame.The decrease of kris consistent with the broadening of turbulence frequency spectra.This change means that the turbulence radial eddy size increases with turbulence broadening, which maybe correlate with the decreases of E×B velocity[22].All measurements of both the radial and poloidal wavenumber spectra with enough spatial and temporal resolution show the ability of the current Li-BES system, and it is very helpful for further density turbulence behaviors research.

Figure 8.(a) The spectrogram of pedestal fluctuation.Contour plot of the radial (b) and poloidal (c) wavenumber measured in pedestal gradient region.The magnitude of the wave-number spectrum is normalized by the corresponding total value.
4.Summary
In conclusion, the current Li-BES diagnostic system on EAST provides the unique capacity for a comprehensive characterization of the edge turbulence measurement.The variations of fluctuation spectra, fluctuation intensity and wavenumber spectrum have been observed and analyzed.The new narrower band interference filter shows enhanced ability to suppress background Li I light emission by a factor over 2000.The detected raw data with high chopping frequency are self-consistent between different channels and sensitive to electron density fluctuations.The high SNR level further demonstrates the good performance of the new filter.
Based on the measured data and referenced algorithm, the density reconstruction is clearly presented.Signals detected in different radial positions show the existence of ECM in the pedestal steep gradient region.The integrated beam light fluctuation amplitude profile is also calculated to get detailed fluctuation information in the pedestal-SOL area,and the fluctuation in pedestal steep gradient region is the strongest.To further exam the quality of measured data, the auto-power spectra of different channels and cross-power spectra are calculated and presented in figure 6(a), the similar distribution of auto-power density tells that the measured fluctuation peak is not influenced by the common-mode noises.Besides, the cross-power spectra and correlation coeffient curve confirm that this signal is caused by the local density fluctuation only, rather than beam modulations that happened in other spatial positions.
Finally, to further investigate the complicated turbulence behavior, the radial and poloidal wavenumber spectra are calculated by the two-point model.The apparent changes of radial wave-number could be observed,although the physical mechanism of the strong pedestal fluctuation occurrence needs further study.
All the results show the excellent ability and sufficient confidence of the current Li-BES system on EAST, thus this system can provide detailed experimental fluctuation information and make it possible to investigate the complicated fluctuation and turbulence behaviors on EAST.
Acknowledgments
The authors would like to acknowledge the support and contributions of the EAST team.The work is supported by the National Key R&D Program of China (Nos.2017YFA0301300, 2019YFE03030000), National Natural Science Foundation of China (Nos.11805238, 11775264,11922513, U19A20113, 11905255, 12005004), Anhui Provincial Natural Science Foundation (No.2008085QA38),Institute of Energy, Hefei Comprehensive National Science Center (No.GXXT-2020-004).
Data availability statement
The data that support the findings of this study are available from the corresponding authors upon reasonable request.
杂志排行
Plasma Science and Technology的其它文章
- Synthesis of Ag-decorated vertical graphene nanosheets and their electrocatalytic efficiencies
- Upgrade of an integrated Langmuir probe system on the closed divertor target plates in the HL-2A tokamak
- Numerical study of atmospheric-pressure argon plasma jet propagating into ambient nitrogen
- Effects of O2 addition on the plasma uniformity and reactivity of Ar DBD excited by ns pulsed and AC power supplies
- Design and first result of combined Langmuir-magnetic probe on J-TEXT tokamak
- Selective catalytic reduction of NOx with NH3 assisted by non-thermal plasma over CeMnZrOx@TiO2 core-shell catalyst
