Multi‐gradient‐direction based deep learning model for arecanut disease identification
2022-05-28MallikarjunaPalaiahnakoteShivakumaraVijetaKhareBasavannaUmapadaPalPoornima
S.B.Mallikarjuna|Palaiahnakote Shivakumara|Vijeta Khare|M.Basavanna|Umapada Pal|B.Poornima
1Department of Computer Science and Engineering,Bapuji Institute of Engineering and Technology,Davanagere,Affiliated to Visvesvaraya Theological University,Belagavi,Karnataka,India
2Faculty of Computer Science and Information Technology,University of Malaya,Kuala Lumpur,Malaysia
3Adani Institute of Infrastructure Engineering,Ahmedabad,India
4Department of Computer Science,Davanagere University,Davanagere,Karnataka,India
5Computer Vision and Pattern Recognition Unit,Indian Statistical Institute,Kolkata,West Bengal,India
Abstract Arecanut disease identification is a challenging problem in the field of image processing.In this work,we present a new combination of multi-gradient-direction and deep convolutional neural networks for arecanut disease identification,namely,rot,split and rotsplit.Due to the effect of the disease,there are chances of losing vital details in the images.To enhance the fine details in the images affected by diseases,we explore multi-Sobel directional masks for convolving with the input image,which results in enhanced images.The proposed method extracts arecanut as foreground from the enhanced images using Otsu thresholding.Further,the features are extracted for foreground information for disease identification by exploring the ResNet architecture.The advantage of the proposed approach is that it identifies the diseased images from the healthy arecanut images.Experimental results on the dataset of four classes(healthy,rot,split and rot-split)show that the proposed model is superior in terms of classification rate.
KEYWORDS deep learning,image analysis,pattern recognition
1|INTRODUCTION
From the ancient times arecanuts (also known as betel nuts)are traditionally used in cultural events as the symbol of auspicious nuts.Many countries like India,Pakistan,Maldives,Nepal,Sri Lanka,Bhutan,Bangladesh,Burma (Myanmar),China,Laos,Thailand,Brunei,Malaysia,Indonesia,Cambodia,Vietnam,Taiwan,and Philippines,and other Asian countries use them in many of their cultural and social activities.The arecanut is basically the seed of the areca palm tree,which grows in much of the tropical Pacific,South-East and South Asia,and parts of East Africa [1].Chewing the mixture of arecanut and betel leaf is a tradition,custom,or ritual,which dates back thousands of years in much of the geographical areas from South Asia eastward to the Pacific.There are many medical benefits of arecanuts which can be noted from ancient literature.It can also be used as ingredients for making tea,soaps,diabetes formulations,tooth powder,wines and ayurvedic medicine [2,3].
As the demand is huge for arecanut,it is important to provide the high-quality nuts for consumption.At the same time,production of nuts should be increased to meet the requirement of high demand for high-quality products.However,the main cause for not yielding expected productions and maintaining high-quality nuts is the presence of common diseases,such as,rot,split and rot-split diseases.These diseases make the nut substandard in quality and affect production of high-quality nuts for consumption.Manually sorting them into good quality results is waste of time and energy and generates huge loss to the farmers.Therefore,to increase production,and to prevent spreading of disease and grading,there is a need of for an automated system to identify the arecanut affected by diseases.Manual grading and classifying are a troublesome task and it is costly due to a large number of labors required.Also,if we separate the infected nuts,the market price of the good nuts could increase.Therefore,classification of the diseased arecanuts from the healthy nuts is necessary.In this work,we consider the following four classes.
1.1|Rot disease
Distinguishing symptoms of rotting is the widespread shedding of the immature nuts which lie scattered near the base of the tree.Initial symptoms appear as dark green/yellowish watersoaked scratches on the nut surface near the perianth.The infected nuts lose their natural green luster,quality and hence have low market value.
1.2|Split disease
Improper drainage will cause nuts to split and fall.Areca palms of 10-25 years old are more are prone to this disorder.This is common in paddy converted fields as well as high water table gardens.It's severe in rainy season.Sudden flush of water after a prolonged period of drought leads to this disorder.Initial symptom appears as premature yellowing of nuts when they are half to three fourths mature.This is followed by splitting of nuts from either sides or the tips which expand longitudinally towards the calyx exposing the kernel.
1.3|Rot split disease
This occurs mainly during rainy seasons.The drainage causes nut splitting while lack of sunlight causes rotting.All these diseases cause huge differences in the quality of nuts and their market price.
The reason to consider these diseases is that they are very common and dangerous diseases compared to other diseases.Sample arecanut images of the four classes can be seen in Figure 1.There are methods for classifying different types of arecanut images affected by the disease in the literature [4-6]but most of the methods use geometrical features,shape-based features,texture-based features of the images and conventional classifiers,such as SVM for classification.As a result,these methods are not robust to variations in the image affected by multiple diseases.Thus,the proposed work introduces the combination of multi-gradient directional and Residual Network.The motivation to explore gradient direction information is that the gradient suppresses distortion by sharpening edge information in the images [7,8].In the same way,it is noted that the deep learning models have strong ability to classify the images in complex situations.These aids have motivated us to explore the deep learning approach for arecanut disease identification in this work.
2|RELATED WORK
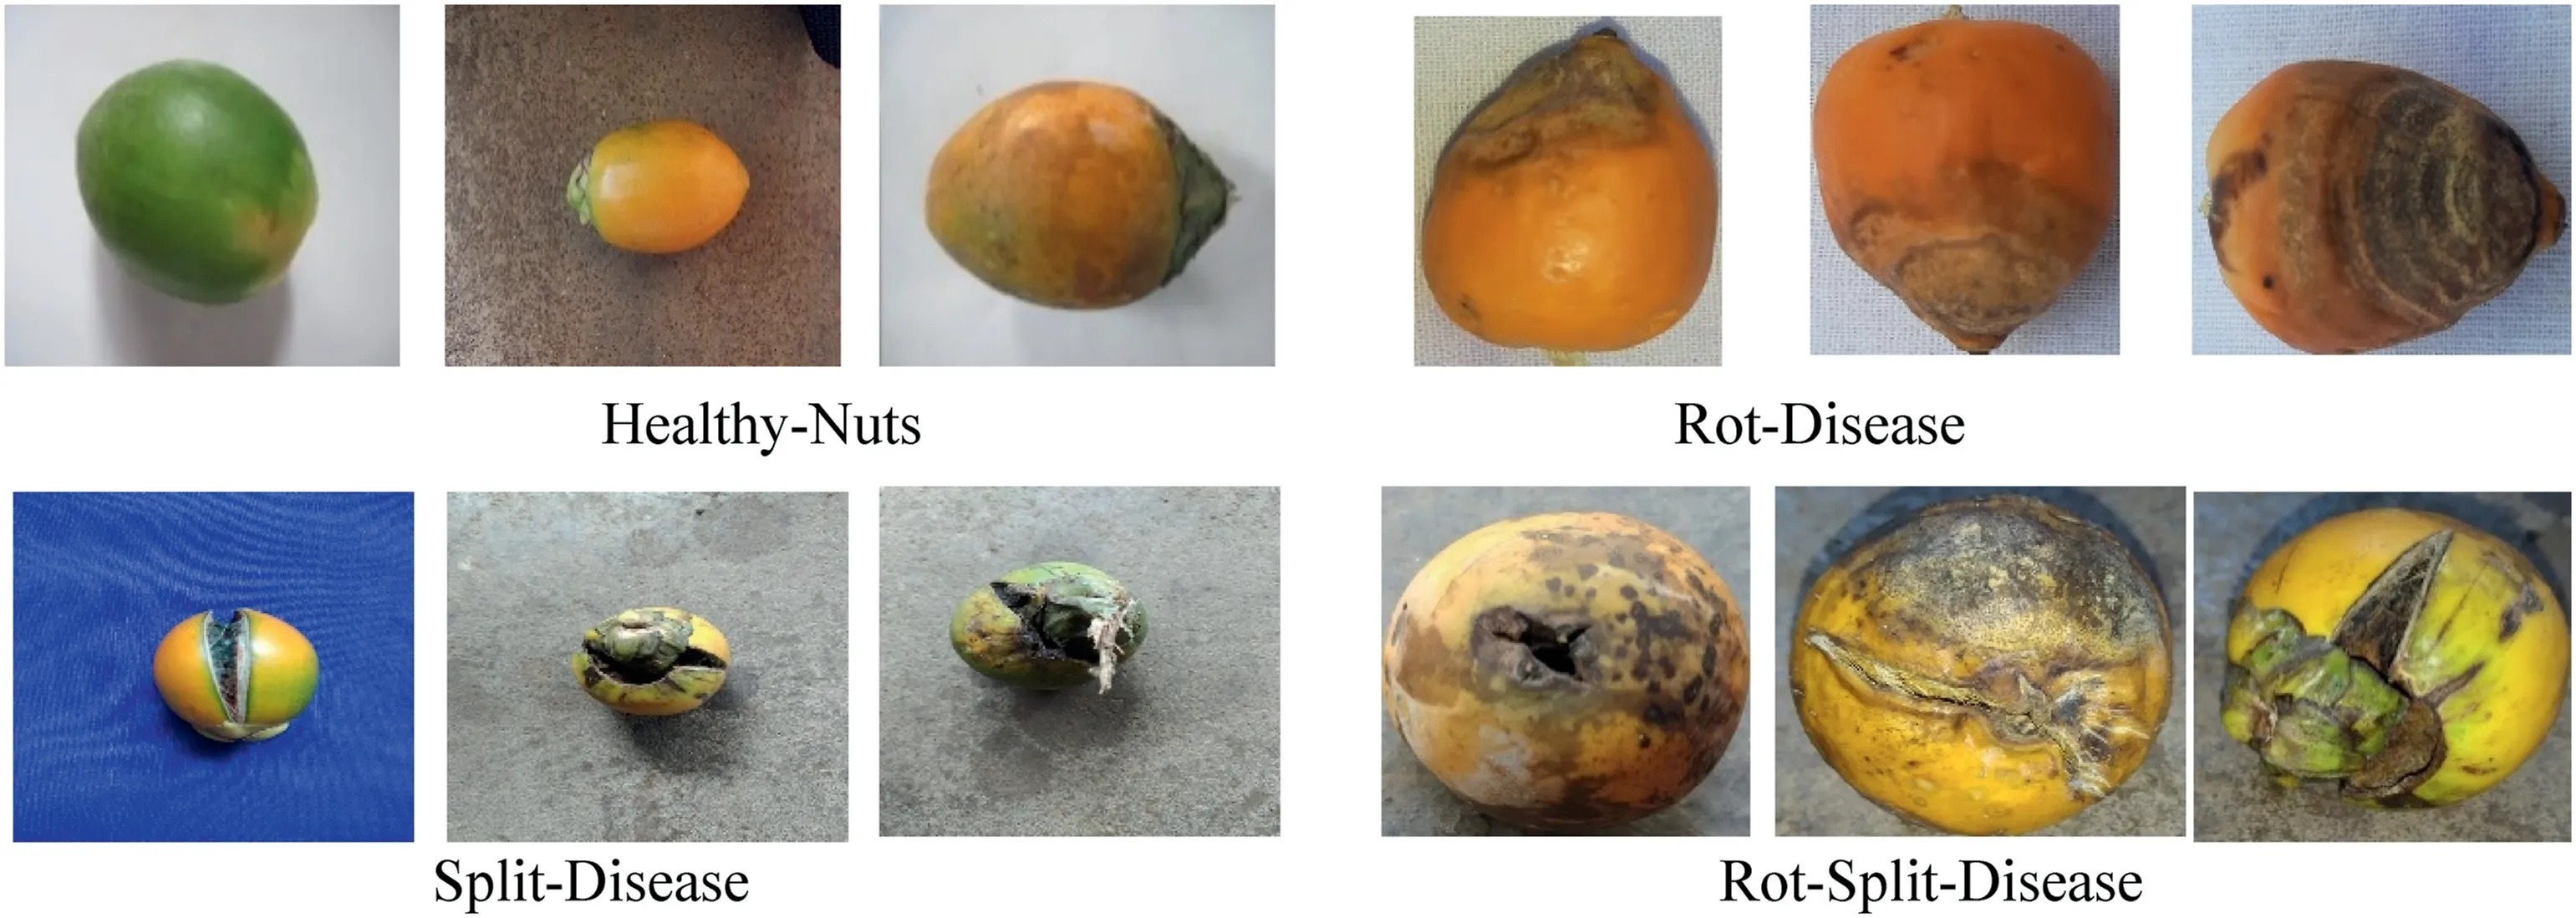
FIGURE 1 Sample arecanut images for disease identification and classification from healthy images
Arecanut segmentation and classification is an existing problem that has been addressed by many researchers but if we investigate the literature very few work targets for disease identification can be observed.Therefore,we consider the existing methods of segmentation and classification for reviewing in this work.The YCR colour model is adopted by Dhanesha et al.[2]for segmentation of arecanut bunches.The method uses volumetric overlap error and dice similarity coefficient for assessing the similarity between the input image and ground truth for segmenting bunches.The focus of this method is segmenting bunches of arecanut but not arecanut disease identification.Similar idea has been explored in the later work where the same method is extended for the purpose of segmentation of bunches using the HSV colour model[3].A robotic plucking system has been developed by Gowda et al.[9].In this work,the robot is designed to cut the branches of arecanut.The scope of the method is developing a system for chopping the branches but not the method to identify the disease.The system is not fully automatic for cutting the branches as it requires human intervention to separate arecanut branches from other branches in the tree.In totality one could say that the segmentation methods use colour and similarity measures for segmenting branches of arecanut from the tree.But it is not clear what would be the input and how the methods separate the branches of arecanut when there is a partial occlusion and arecanuts are degraded due to diseases in open environment.Therefore,these features cannot be used for identification.
For classification,a few methods are presented in literature.This shows that classification of different types of arecanut images is at an elementary stage.Colour features and KNN classifier are proposed by Siddesha et al.[10] for classification of arecanut images.The method proposes the arrangement of colour features and colour moments and uses histogram operation for feature extraction.For classification,the feature matrix is fed into a KNN classifier.This method works well for the images that have good quality but not for the images with degradations,poor quality,or colour bleeding caused by diseases.The AlexNet architecture is adopted by Cai et al.[11]for betel nut classification based on transfer learning.However,since the method considers arecanut after removing the skin,therefore,the shape of this nut is observed to be different from the raw images.This method focuses only on peeled arecanut images.In addition,the performance of the method heavily depends on the number of samples and parameter tuning.Suresha et al.[6] utilises texture features such as local binary pattern-based,Haar wavelet-based,colour-based GLCM and texture-based features for classification of diseased arecanut images.The KNN classifier is used for classification and the input is the feature matrix.The scope of the method is limited to two-class classification,and it requires peeled arecanut images but not unprocessed arecanut images considered in the proposed work.Danti et al.[12] proposed a method for segmentation and classification of arecanut images based on three sigma control limits.This method also uses the combination of colour and three sigma control limits for classification.The upper and lower limits of the colour components are used to segment the arecanut effectively.However,the method does not consider the images affected by diseases.Puneetha and Nethravathi [13] present a survey on arecanut disease identification using machine learning-based methods.This method discusses merits and demerits of different machine learning based methods.However,the method does not discuss much about concepts and techniques for disease identification.
In summary,most of the methods either focus on two class classification or classification of peeled arecanut images.None of the methods consider the classification of the images affected by different diseases from healthy arecanut images.Hence,classification of such images remains an unresolved and open issue for the researchers.Thus,this work proposes a new model for identifying the images affected by three types of diseases by exploring multi-gradient directional images and ResNet.It is noted that convolving multi-Sobel directional kernels with the input images enhances fine details in the images irrespective of distortion caused by different diseases [7].Therefore,we can expect that such fine details provide unique edge representation for each disease class.Motivated by this observation,the proposed method obtains four multi-gradient directional images for each input image of different classes.In the same way,inspired by the special property of the CNN model that has a very strong discriminating power [8],the proposed method adapts ResNet for disease identification by considering multi-gradient directional images as input.The main contribution of the proposed work is as follows.To begin,to the best of our knowledge,this is the very first work for three types of disease identification.Second,the combination of multi-gradient directional information and ResNet model is new compared to the state-of-the-art methods.
3|THE PROPOSED METHODOLOGY
In this work,we consider the four classes,namely,Healthy,which contains arecanut images without any disease,Rrot,which contains images affected by immature nuts with colour bleeding,Split,which contains the images affected by cracks on the images,and Rot-Split,which contains the images affected by both Rot and Split diseases for disease identification.It is noted that images of each class have unique edge representation because of the effect of different diseases.However,due to disease effects,there are high chances of losing such a unique edge pattern in the images.To restore those details in the images,the proposed work introduces multi-gradient directional images obtained by multi-Sobel directional kernels.This is because gradient in different direction helps us to enhance the fine details by suppressing distortion effects [7,14,15].To extract such observations,we propose the combination of ResNet as it has the ability to extract deep features for disease identification[16].Figure 2 shown is the block diagram of the proposed method,which shows various steps for disease identification.Before passing the multi-gradient directional images,the proposed method reduces the size of the input image to a standard size and employs augmentation techniques to increase the number of samples,thereby avoiding the causes of overfitting and underfitting[17-19].
3.1|Generating multi‐gradient directional image (MGD)
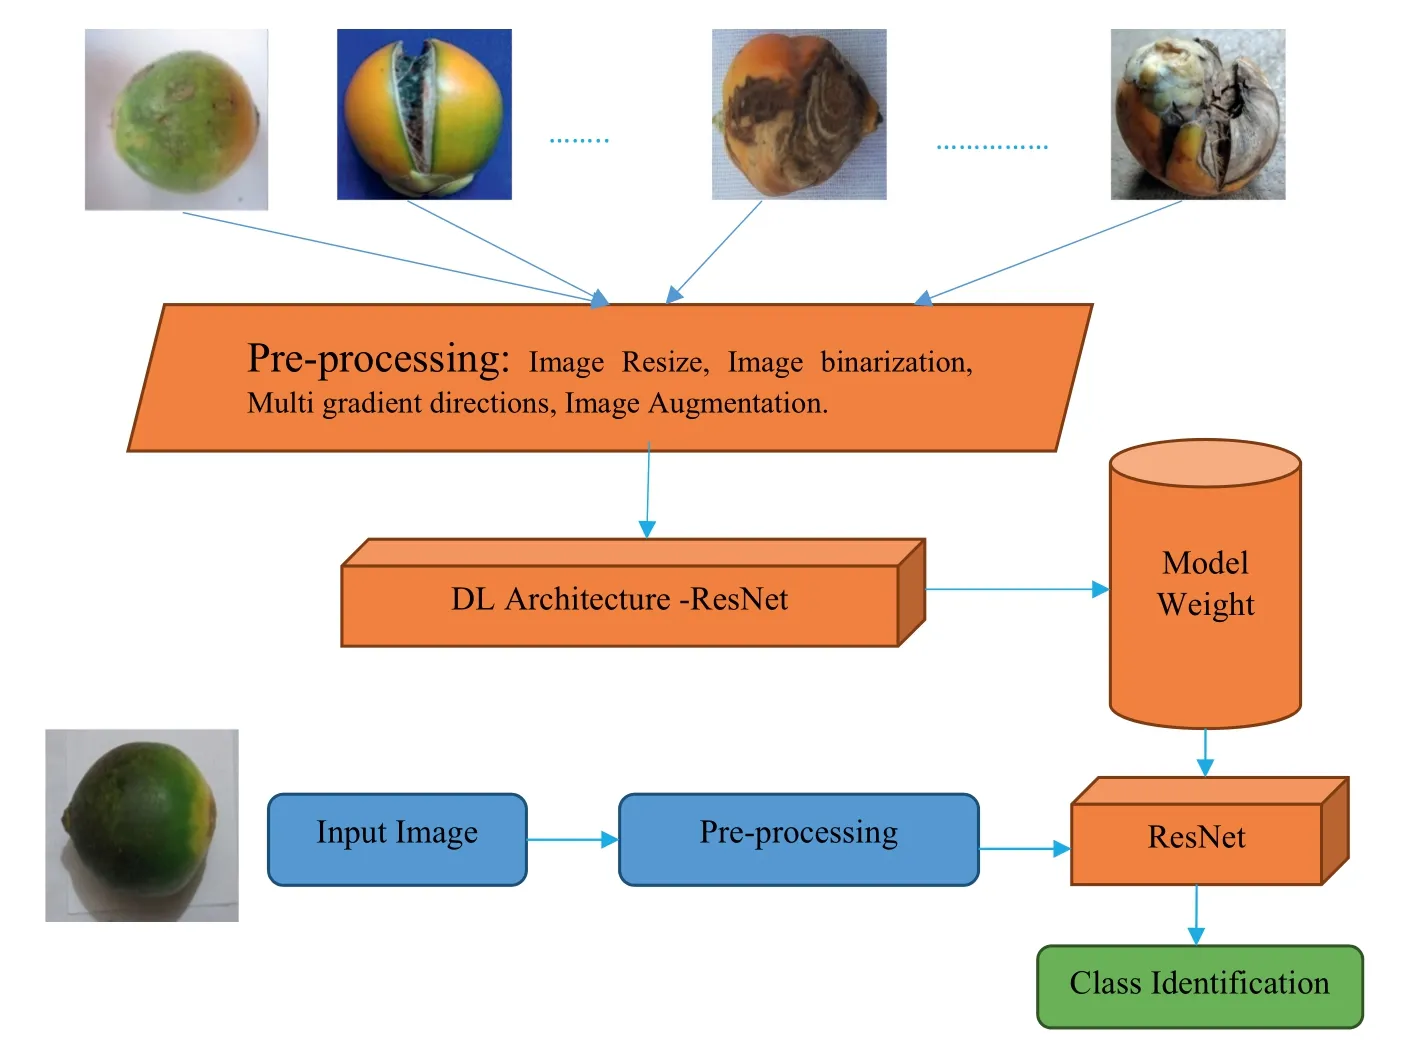
FIGURE 2 Proposed architecture for identification
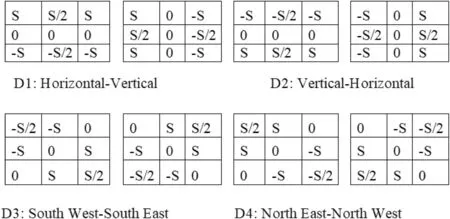
FIGURE 3 Adaptive Multi-Sobel kernels for generating multi-gradient directional images
The proposed method generates multi-gradient directional images from each input image by employing the multi-Sobel directional kernels shown in Figure 3.In order to deal with the variations caused by different diseases,we propose to determine automatic values for the kernels rather than using fixed values.Equations(1)and(2)can be used to calculate the value of S,which uses neighbor information for calculating kernel values automatically.It is shown in [7] that multi-gradient images can withstand variations of handwriting for classification of gender using handwriting analysis.It has motivated us to explore the same for generating multi-gradient directional images for enhancing fine details in the arecanut images affected by different diseases.The Sum of Absolute Difference (SAD) for eight neighbor pixels is defined in Equation (2).This supports the investigation of variations in image content.In Equation (1),the weight value Tscale is determined dynamically.It is observed from the arecanut images shown in Figure 1 that the background appears homogeneous while the foreground (arecanut area) appears heterogeneous compared to background due to distortion caused by diseases and the rough texture surface of arecanut.Based on this observation,to widen the gap between the background and foreground,the proposed method defines the hypothesis that if mean and median of the window is almost same,the Tscale value is 0.1,which is close to zero.Otherwise,the value of Tscale is 2,which enhances the pixel values in the arecanut area.The values 0.1 and 2 are determined experimentally by conducting experiments on samples chosen randomly from our dataset.This enhancement process helps for subsequent steps of Otsu threshold to separate the background and foreground accurately irrespective of distortion caused by the disease.The advantage of obtaining multigradient directional images is that it gives rich information about the content of the images in different directions.
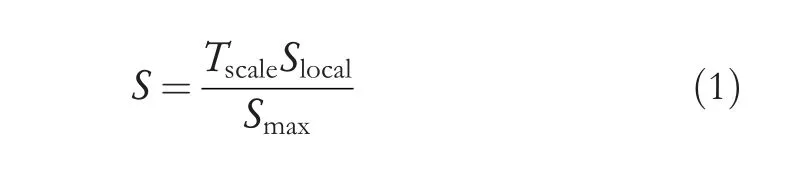
where,Slocalrepresents the Sum of Absolute Difference(SAD),andSmaxrepresents the maximum SAD value.
whereF(i,j) is the middle pixel 3 × 3 window in the grey image.
Before feature extraction for disease identification,the proposed method extracts foreground information (arecanut)from the input images using Otsu thresholding as shown in Figure 4,where we can see the information of arecanut is separated from the background information.For disease identification,we need to extract the arecanut region from the background rather than considering the whole image.If we use the whole image for feature extraction,it can be represented as classification but not disease identification[20-23].In this way,the disease identification is different from image classification.The motivation to use Otsu thresholding is that the background information arecanut images are not complex and we can expect a homogenous region.As a result,arecanut images contain two kinds of regions,namely,the homogeneous region for background and the heterogeneous region for foreground.It is true that Otsu works well and fast for the image containing two distinct pixel values.For the corresponding pixels of foreground information,we extract gradient directional information from the enhanced images given by multi-gradient directional Sobel masks.
Sometimes,the shadow of the arecanut may be included in the results of the Otsu threshold.However,this may not affect for the overall performance of the proposed method.This is because the proposed method does not depend on the shape of the arecanut for disease identification.Rather,the proposed method extracts features from the content of the arecanut.In addition,usually the pixels of shadow do not have high values compared to the pixel values of arecanut,which may be almost similar to background pixels.Therefore,the shadow pixels,which are part of the arecanut area may not contribute for disease identification and hence it does not affect the overall performance of the proposed method.
3.2|ResNet‐based model for disease identification
After segmenting the arecanut area from background of the images,the proposed method obtains gradient information from the multi-gradient directional images corresponding to pixels of segmented arecanut area.This results in four gradient images of foreground information.These four gradient images are fed to ResNet for disease identification.The reason to consider gradient values to feed to ResNet is that binary information loses the vital information of each disease while gradient information preserves the fine details of each disease.Therefore,the multi-gradient directional information extracted from the enhanced images corresponding to foreground information is the input for ResNet architecture for disease identification.The details of the proposed ResNet [16,24] is used for feature extraction and disease identification in this work.
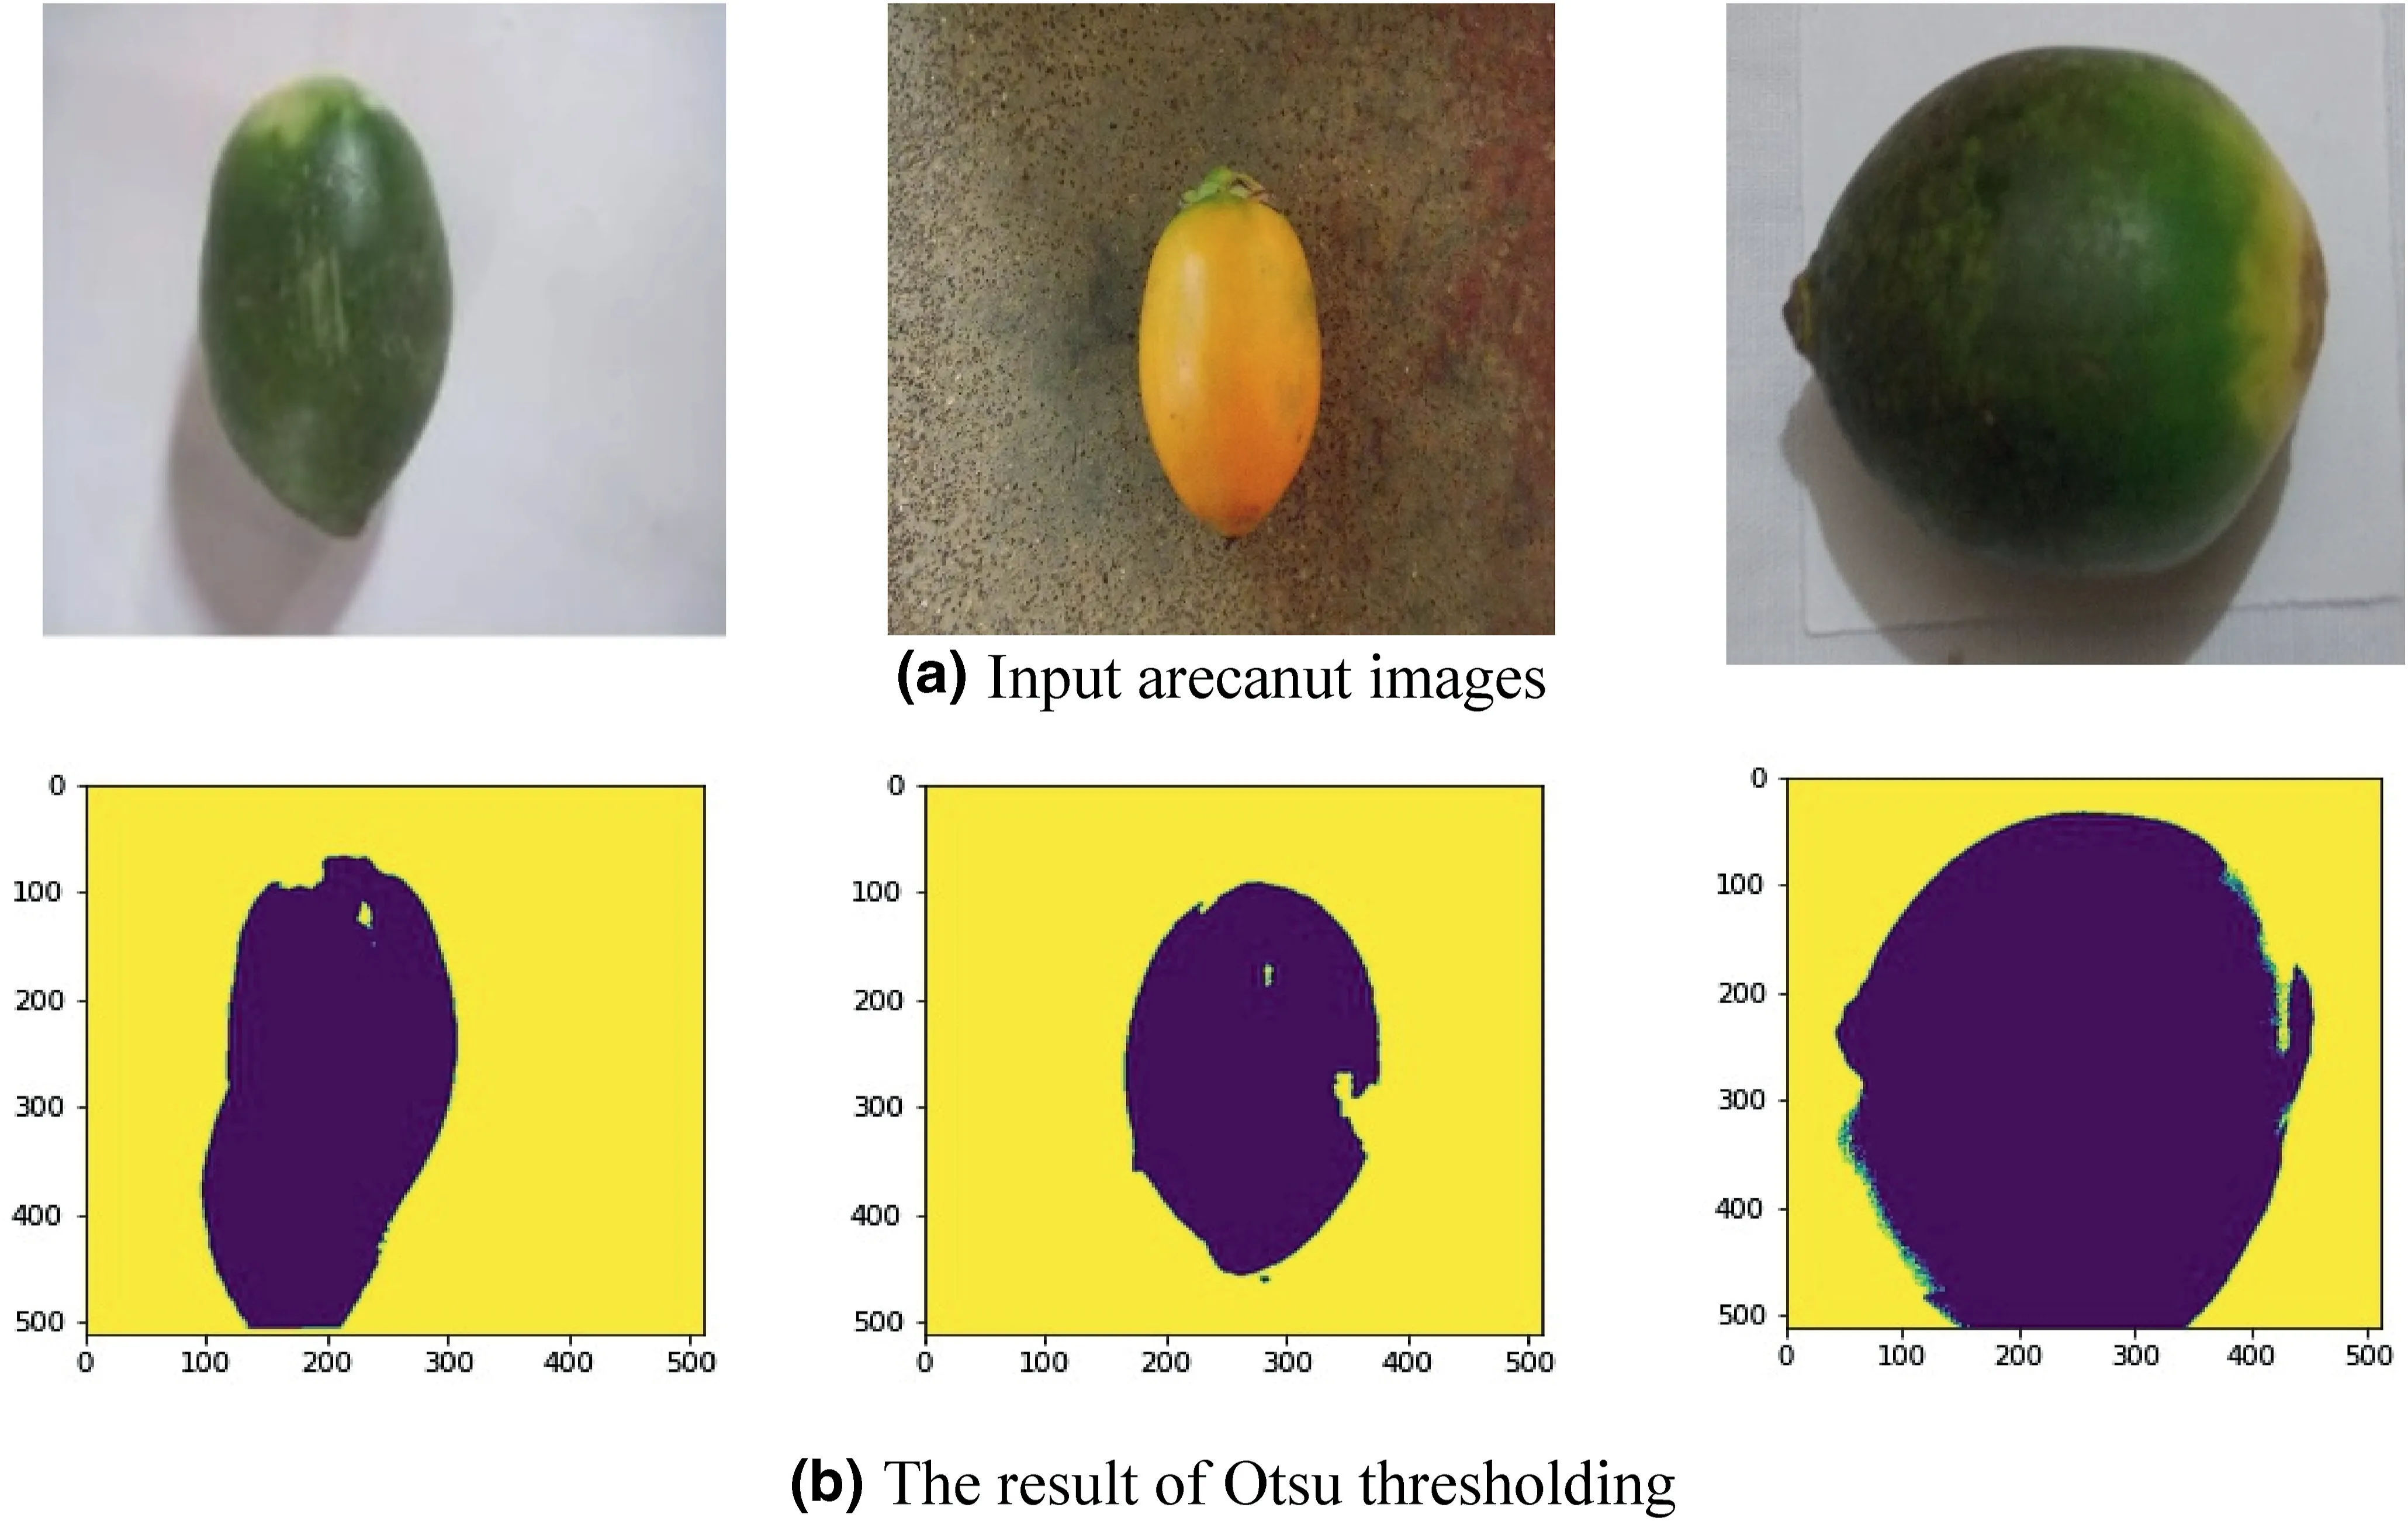
FIGURE 4 Foreground separation from background.Yellow colour indicates background and dark colour indicates foreground (arecanut)
AlexNet and other basic CNN [8] deep learning architectures employ deep neural network with more number of layers in order to reduce error rates.With time,more layers have been added by various researchers to improve the accuracy,but gradually accuracy became saturated.The ResNet architecture operates on even more number of layers.With this large number of operative layers,the vanishing/exploding gradient becomes a common problem which causes the gradient to become zero or too high.Thus,the training and test error rate also increase due to increase in the number of layers.In order to solve the problem of the vanishing/exploding gradient,the Residual Network has been introduced.ResNet uses skipbased connection network,which skips a few layers and connects directly to the output layer.The technique following this network is to learn the original mapping instead of using layers,which allows the network to fit the residual mapping.So,instead of sayH(x),initial mapping,let the network fit,F(x):=H(x) -xwhich givesH(x):=F(x) +xas shown in Figure 5.The benefit of adding up this skip connection is that if the performance of the architecture is reduced due to any layers,then it will be skipped by regularisation.As a result,deep neural networks can be trained without the issue of vanishing/exploding gradients.The proposed network employs a 34-layer plain ResNet architecture as illustrated in Figure 6.
In Figure 6,the ResNet comprises one convolution and pooling step followed by four layers of the same action.Each one of the layers adhere to the similar pattern.They execute 3 × 3 convolution with a static feature map dimension of 64,128,256 and 512,respectively,avoiding the input at every two convolutions.Furthermore,the width (W) and height (H) dimensions of the layer remain unchanged throughout.The dimensional change in the input volume is indicated by dotted lines.Note that in this layer reduction is achieved by increasing the stride window from 1 to 2 at the first convolution of each layer instead of using a pooling operation,which is nothing more than down sampling.Dimension of the convolutional kernels at each point in the structure and the output size at every layer is also shown in Figure 6.
To demonstrate the effectiveness of the proposed architecture for classification of different diseased arecanut images,we have provided activation maps with Grad Cam visualization of layer-1,layer-3,layer-5,layer-13 and pre-final layers for sample images of four classes in Figure 7.The figure demonstrates that as the training progresses,layer by layer,the weights are updated and at the pre-final layer it is accurately focussed on the region of interest (dominant region in the images which can distinguish different diseases)for an accurate identification.This observation is same for all the four classes.Therefore,we can infer from the activation maps of intermediate layers on sample images of four classes that the proposed method is capable of discriminating images affected by different arecanut diseases.Thus,the proposed method is robust to identify different diseases of arecanut images.
4|EXPERIMENTAL RESULTS
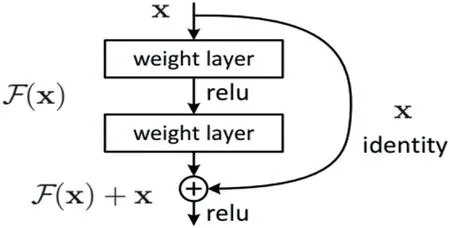
FIGURE 5 Skip connection of ResNet
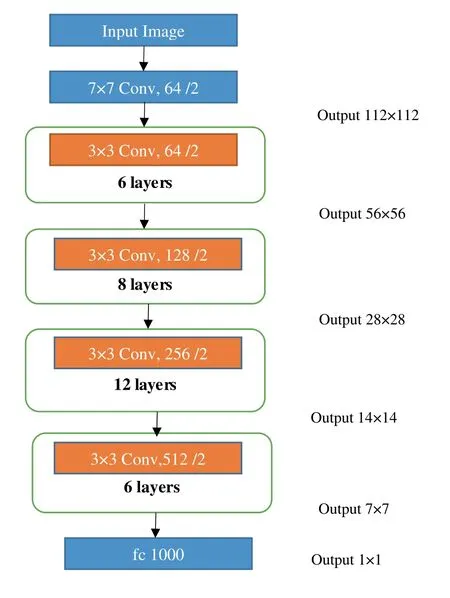
FIGURE 6 ResNet architecture for disease identification
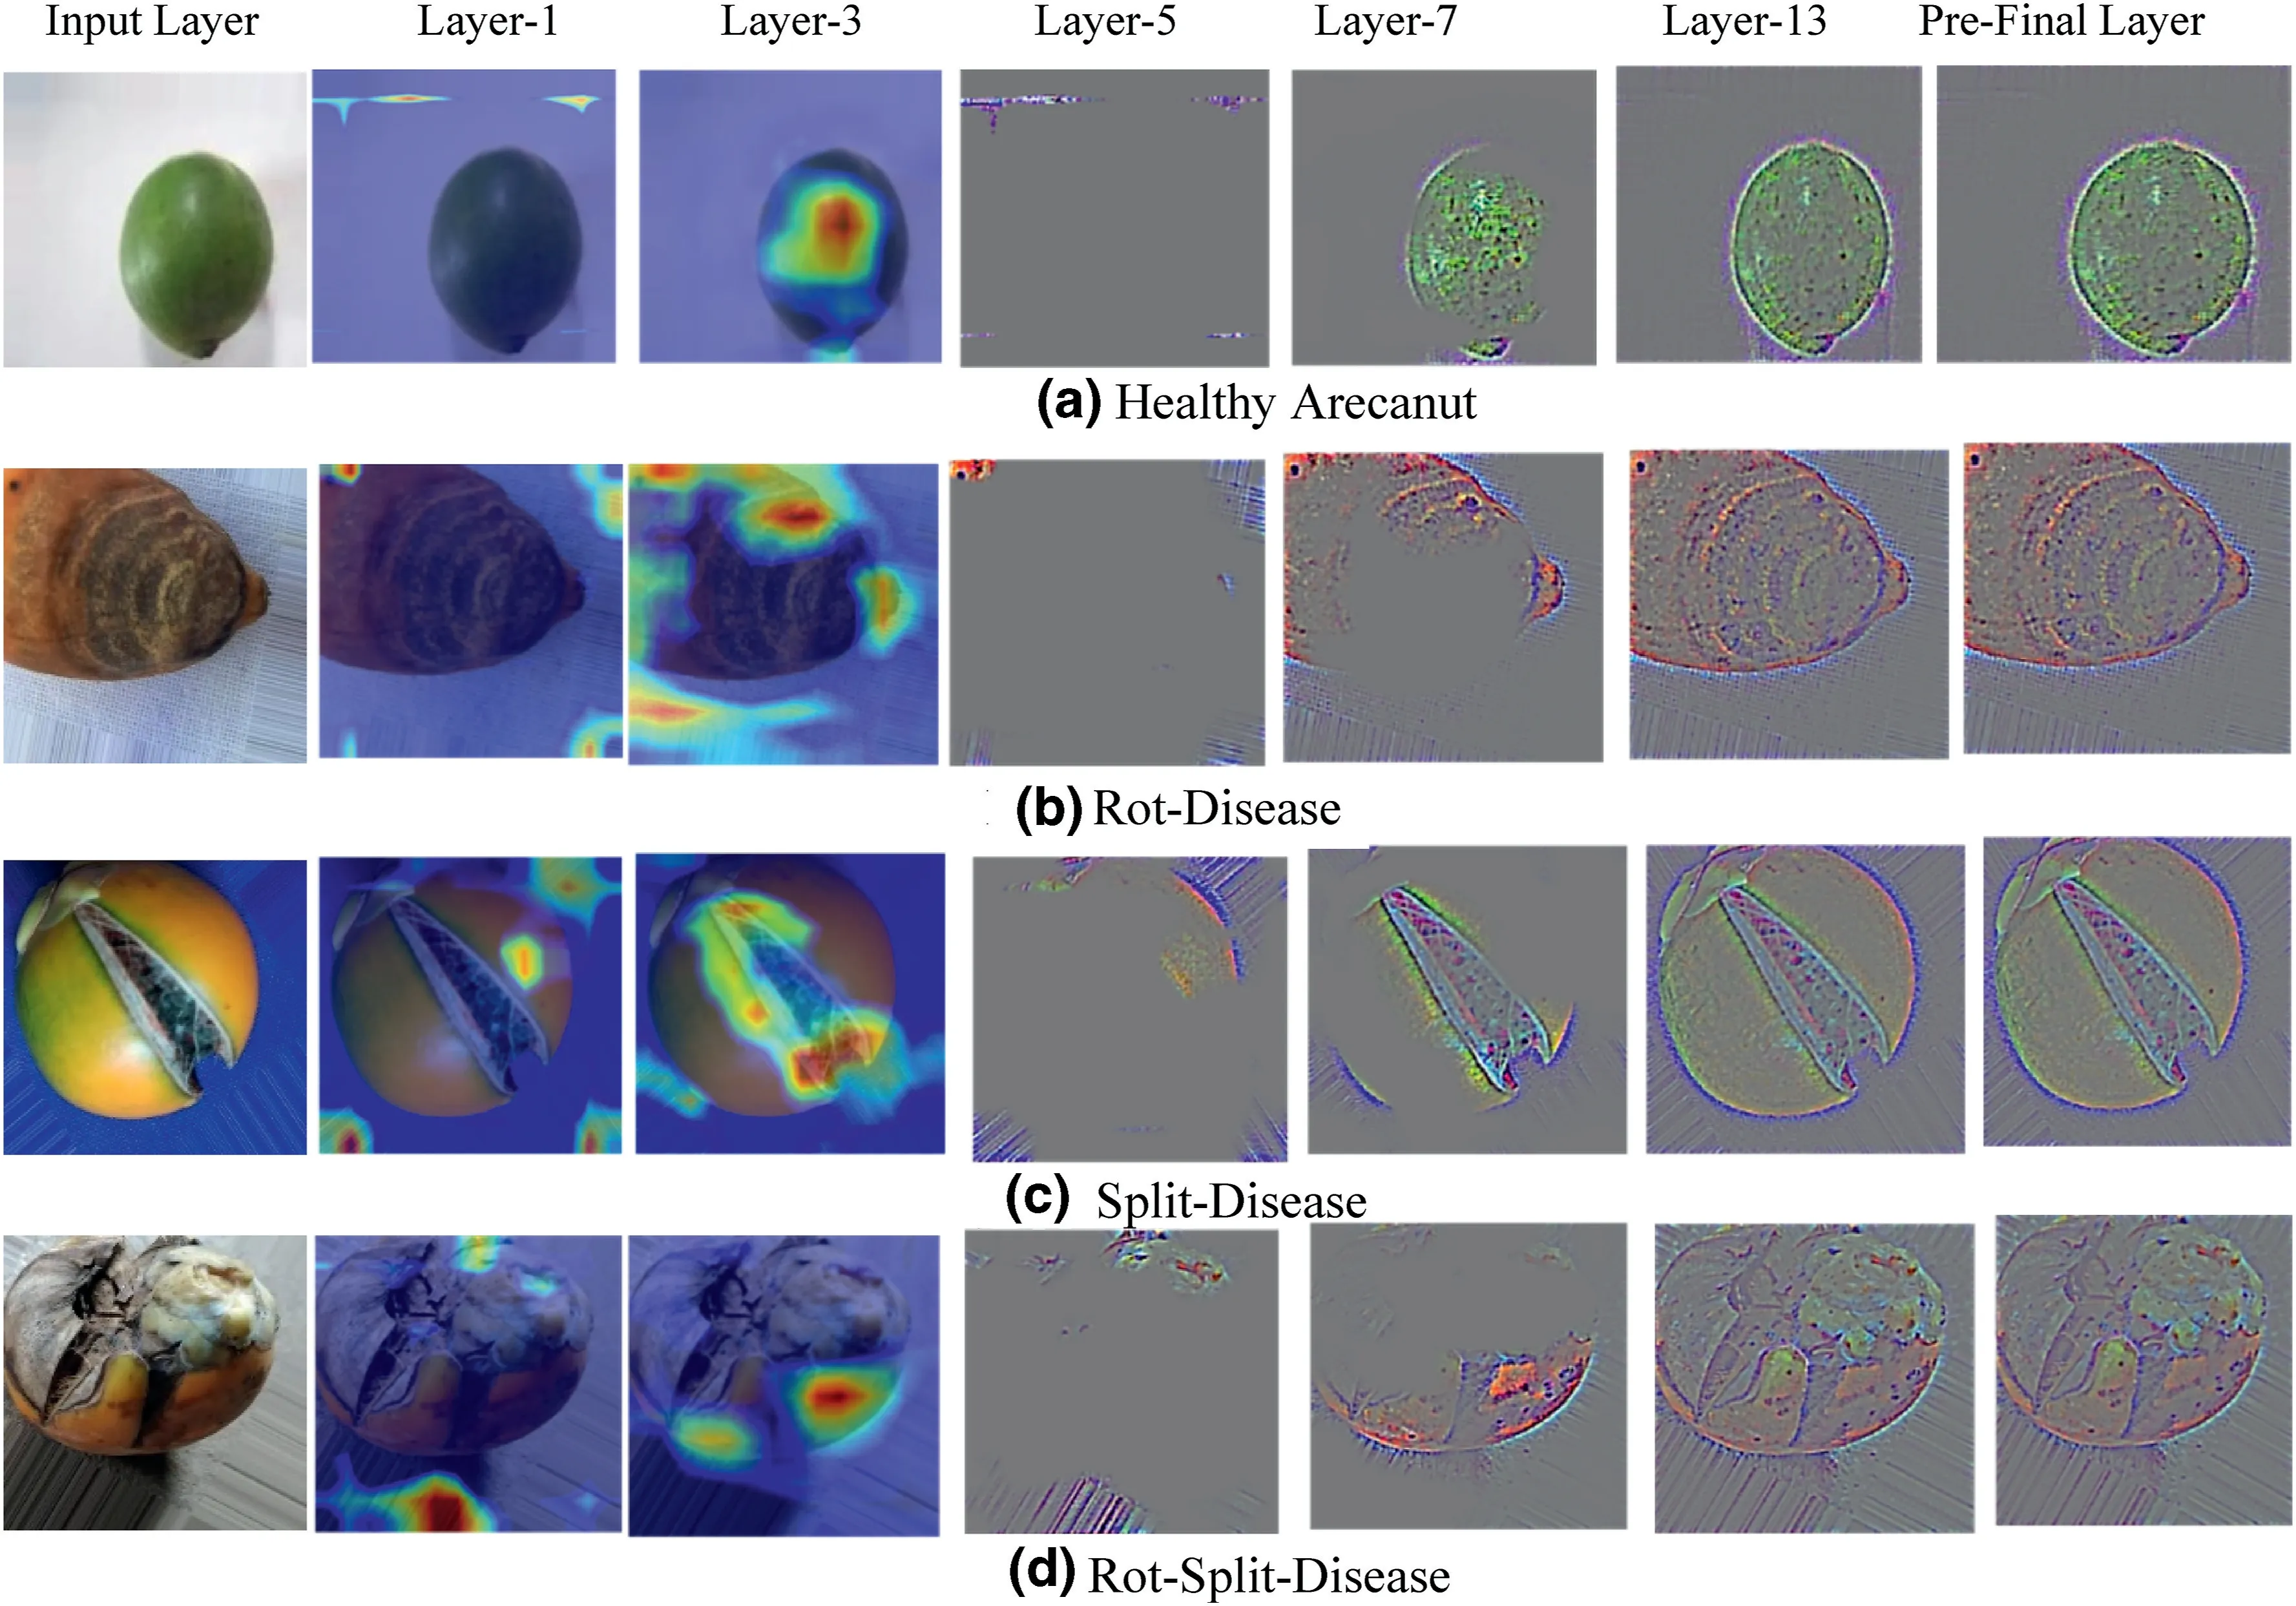
FIGURE 7 Activation maps of intermediate layers of the proposed architecture for four classes
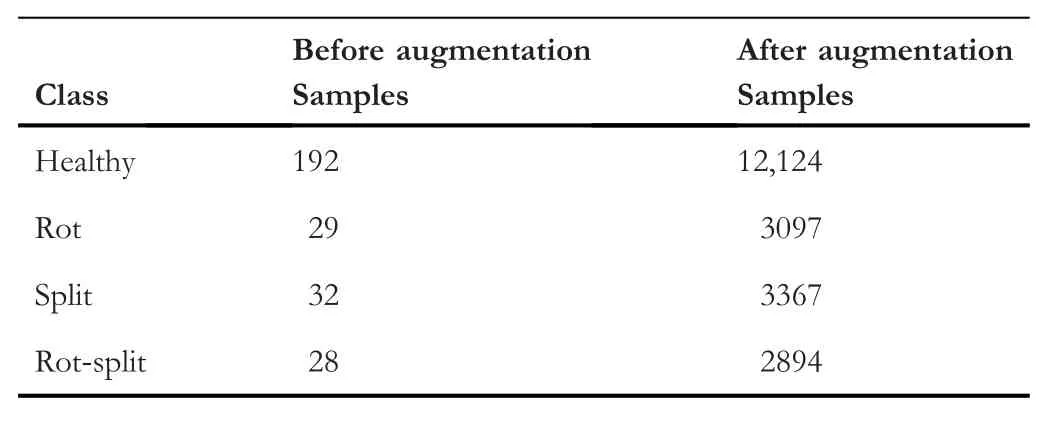
TABLE 1 The number of samples for learning the propsoed architecure before and after augmentation
At present the standard dataset is not available for arecanut images for experimentation.As a result,we created our own dataset,which contains images of various shapes,colour,and degradations.In addition,our dataset includes arecanut of different seasons and time.The process of creating the dataset involves capturing the arecanuts images from the field in the day light.Nighttime image capturing is not considered in this work.After the acquisition of images,they are labelled into corresponding four classes.The number of images chosen for each is reported in Table 1,where we can see the number of samples before and after augmentation.It is true that the deep learning models require more samples for achieving better results.In addition,it is stated in [25] that augmentation techniques improve scene classification performance significantly compared to the results of the baseline method.Since the actual size of the dataset is not sufficient for training the proposed model,we use the following standard augmentation techniques,namely,rotation,flip,noise,shear,blur and changing the brightness level using gamma function to increase the number of samples for each class as reported in Table 1 after augmentation.The details of each augmentation technique is as follows:rotation takes place with rotation range of 40,width,height,zoom and shear range set as 0.2,horizontal and vertical flips are set to be true with full mode set to‘nearest’,Gaussian noise has been added with mean=0,var=0.1 and sigma=var**0.5,for brightness,gamma value is set to be 0.5 (darker) and 3.0 (brighter).The main objective of increasing number of samples with the help of the abovementioned different augmentation techniques is to avoid overfitting such that performance of the proposed identification method improves [25].Since our dataset includes images of any rotations,scaling,shapes for disease identification,augmentation techniques,namely,geometrical transformationand flipping are more effective to enhance the performance of the proposed method.This is because these techniques increase the number of samples affected by geometrical transformation and flipping,which are common in the case of our dataset.In total,the process provides 21,482 samples from augmentation and overall,21,763 for experiments.Since the augmentation techniques use original images for generating more number of samples,the created dataset does not lose the quality of the dataset for evaluating the proposed and existing methods.The size of the input images is changed to a common size of 224×224 dimensions for all the tests to ensure consistency and to reduce the processing time.Since the actual input image is not very large and does not contain a complex background,converting the size of the input images to 224 × 224 does not affect much the content of the images and hence the overall performance of the proposed method does not change much.At the same time,a simple normalisation operation is carried out on the arecanut dataset.
To study the effectiveness of the proportion of the number of training and testing samples for disease identification,we consider different proportions as mentioned in Table 2,where we use 60-40,70-30 and 80-20 of training and testing samples,respectively.It is expected that the performance of the method improves as the number of training samples increases.
For the purpose of implementation,TensorFlow (Version 2.8.0) deep learning environment is used for training and testing on NVIDIA GeForce RTX 2080 Ti GPU.Before the training of the network model,the parameters of ResNet are loaded into TensorFlow.Weights are initialised by random initialisation (0,0.01).Batch Size is kept 256 for training.For the proposed work,the learning rate starts from 0.1 and is divided by 10 when the error plateaus,and the models are trained for up to 60 × 100 iterations.
To demonstrate the robustness of the suggested model,we use the following well-known existing methods for comparative study.This is because to the best of our knowledge,there are not many methods developed recently for arecanut disease identification.Therefore,the following methods are considered as relevant existing methods for comparative study.Siddesha et al.[10] proposes color features and KNN classifier for classification of raw arecanut images.Suresh et al.[6] uses texture features for classification of diseased peeled arecanut images.Cai and Liu [11] propose transfer learning for classification of different types of betel nut images.The motivation to choose the above-mentioned methods for comparative study is that Siddesha et al.also developed for raw arecanut images classification,which is similar to the objective of the proposed work.Cai and Liu,also work in the same line of betel nut classification using deep learning that also matches with the proposed method line of sight.In addition,to show that the existing techniques are not satisfactory to identify the diseased arecanut images,the methods are implemented to compare with the proposed model.
We employ standard metrics [26] to evaluate the performance of the proposed and current approaches,namely Recall(R),Precision(P),and F-measure(F),which can be defined in Equations (3)-(5).We also use confusion matrix and average classification rate (ACR),which is the mean of diagonalelements of confusion matrix for measuring diseased image identification.

TABLE 2 Dataset distribution for different training and testing proportions (60:40;70:30 and 80:20)
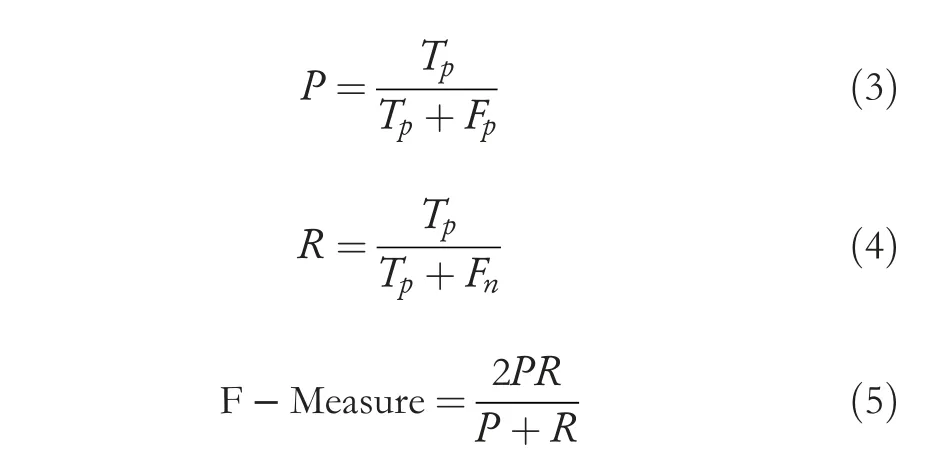
Here,Tpsignifies the total number of correctly classified images,Fpsignifies the total number of the original images mistakenly classified as others,andFnis the total number of images.
4.1|Experiment on disease identification of arecanut images
The quantitative results of the proposed method in terms of confusion matrix and ACR for our dataset are reported in Table 3.It is observed from Table 3 that as the number of training samples increases,the performance of the proposed disease identification improves in terms of ACR.This shows that dividing data into the number of training and testing samples plays a significant role in achieving better results.It also indicates that when more samples are available for training one can achieve better accuracy.Similar conclusions can be drawn from the outcomes reported in Table 4,where we can see the reported recall,precision,and F-measure for each class for various training and testing sample ratios.When we look atF-measure of each class,it increases as the ratio increases.Overall,the proposed method achieves promising results for three types of disease identification and healthy image classification.Sample images for successful and unsuccessful identification of diseases of the proposed method are shown in Figure 8,where one can observe that sometimes,the extracted features fail to identify the disease correctly.This demonstrates that there is space for improvement in order to make the proposed method more resilient.
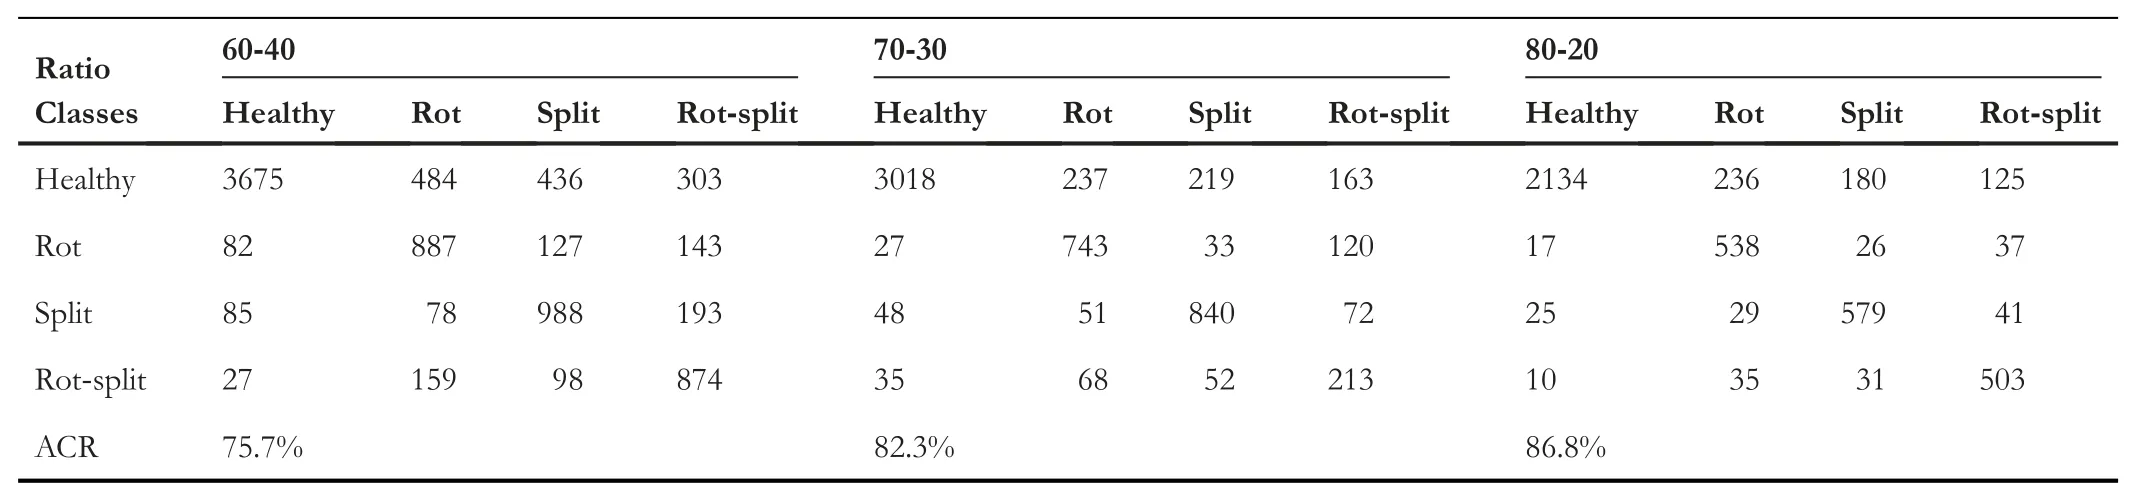
TABLE 3 Confusion matrix of proposed method for disease identification of arecanut images on different distribution of data

TABLE 4 Class-Wise Precision,Recall,and F-Measure for disease identification of arecanut images on different distribution of data
To show effectiveness of the proposed method,we conduct experiments by feeding input images directly to ResNet without enhancement (MGD) for classification.The results are reported in Table 5,where it can be noted that the result of the proposed method is higher than the results of ResNet with original images.Therefore,with this experiment,one can infer that the enhancement images obtained by multigradient direction is significant to achieve improved results.
In Table 6 and Table 7,classification rate,recall,precision,F-measures and accuracy of the proposed and existing methods are reported.For both the experiments,the proposed method achieves the highest classification rate,recall,precision,F-measure and accuracy compared to the existing methods.Siddesha et al.[10] (color features) report lowest results compared to the proposed and other existing methods.The main reason for this weak performance for our dataset is that the method is not robust to handle the images affected by diseases.Additionally,the method is developed for common and healthy arecanut images but not diseased images.Therefore,the features used in the method are sensitive to degradations caused by different diseases.In similar context,Suresh et al.[6](LBP,HAAR,GLCM,GABOR,Texture features)and Cai and Liu[11](Transfer learning)methods are developed for peeled arecanuts(after removing the skin of the nuts seeds)but not for raw arecanut images.Therefore,the shape and pattern of the content of the images are different from the raw arecanut image considered in this work.The features and model used in the methods[6,11]may not work well for our dataset.On the other hand,the combination of multi-gradient directional image and ResNet deep learning model has strong discriminative ability and hence the proposed model outperforms the existing methods.
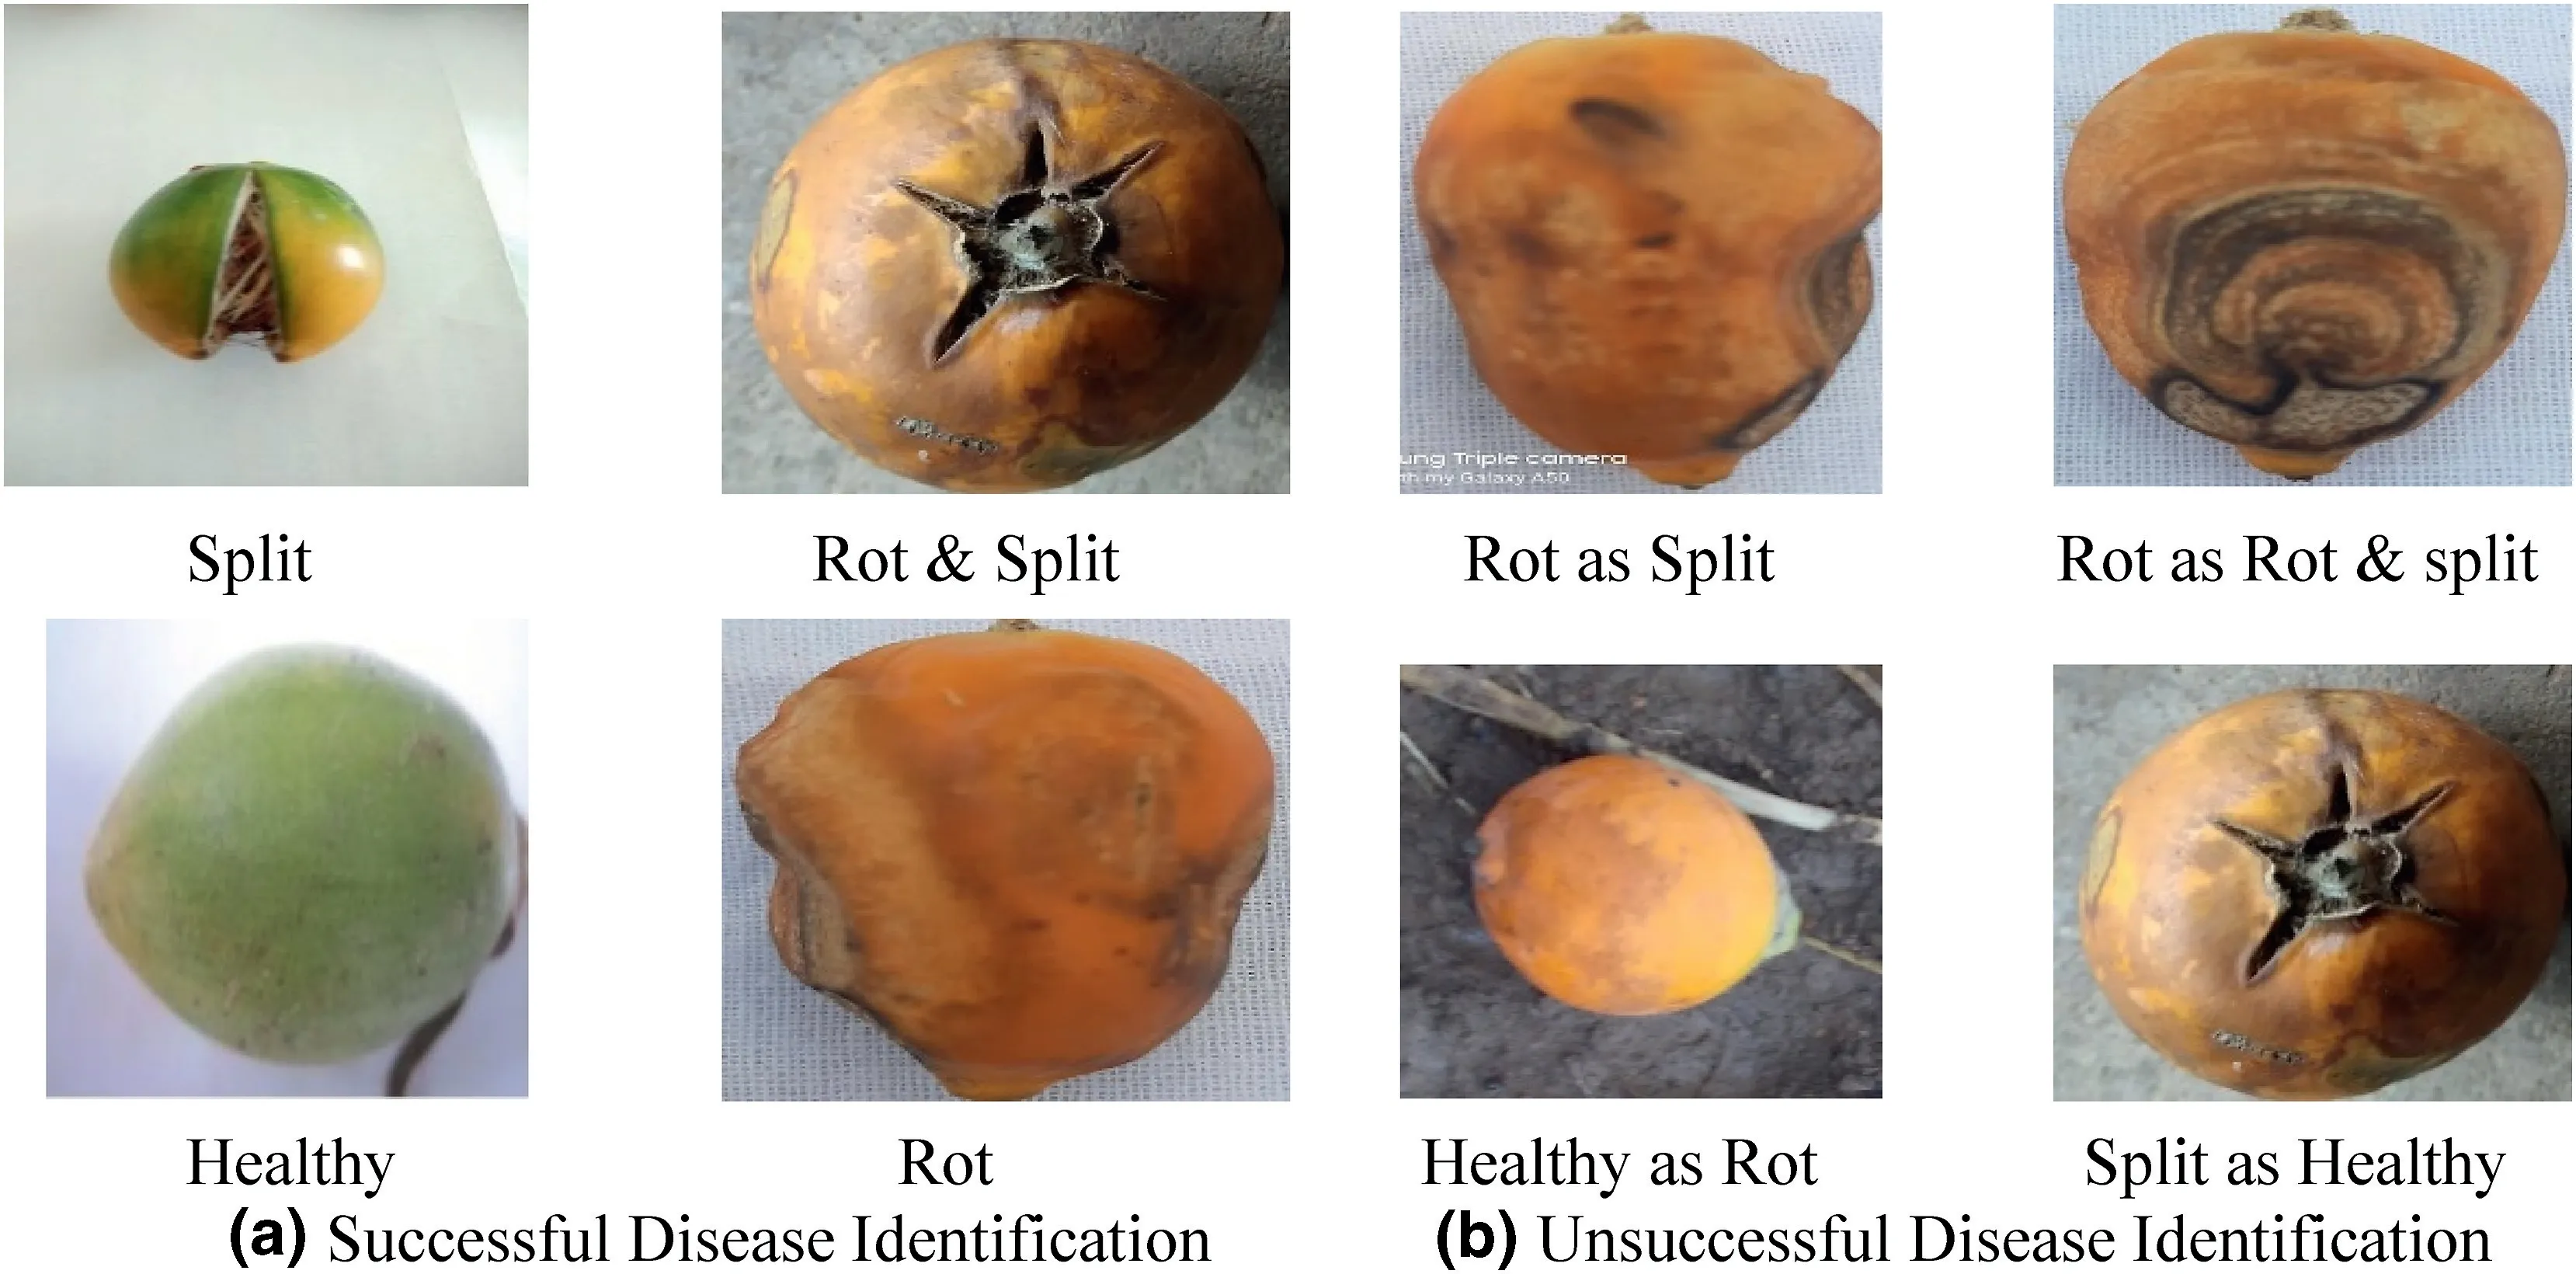
FIGURE 8 Examples of successful and unsuccessful diseased image identification
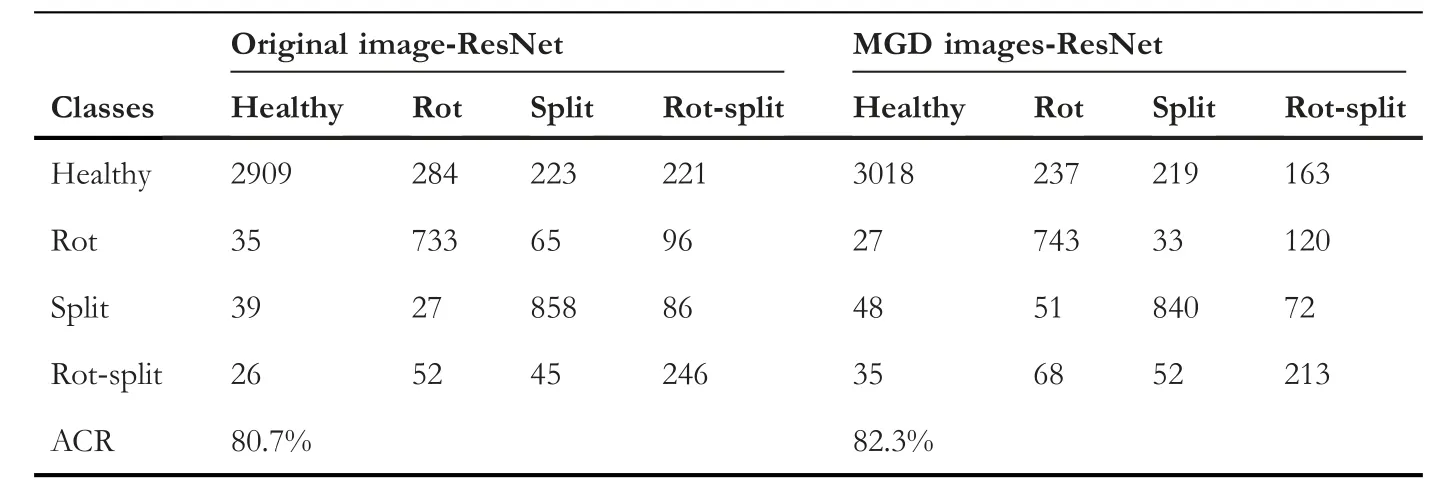
TABLE 5 Ablation study:confusion Matrix to assess the contribution of ResNet and the proposed method with 70-30 ratio for classification

TABLE 6 Comparison of the proposed disease identification with existing methods in terms of Recall,Precision and F-Measures at different ratio of training-testing
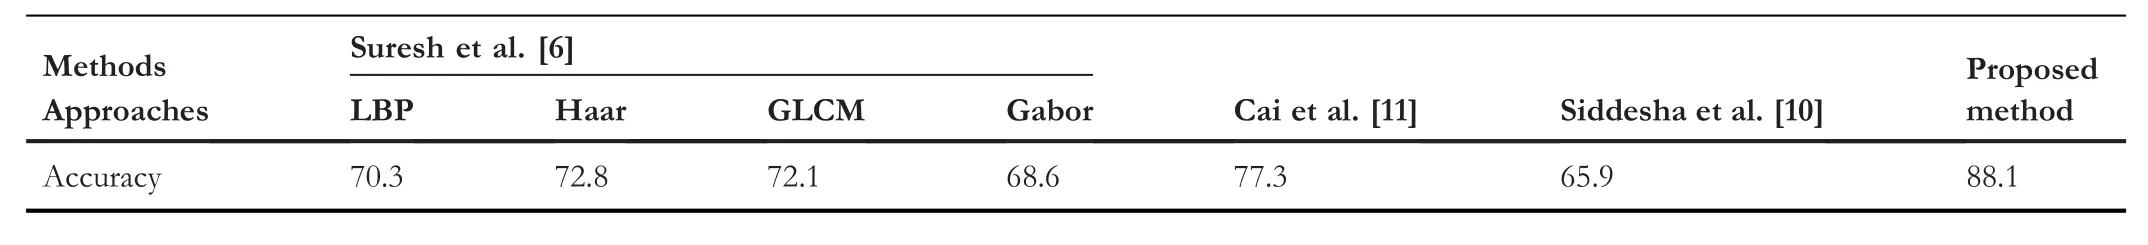
TABLE 7 Comparison of the proposed disease identification with existing methods in terms of accuracy (70-30 training testing ratio)
In this work,since we consider segmented arecanut from the branches as input,one can expect a homogeneous background compared to foreground(arecanut).This is because the scope of the proposed work is disease identification,which requires segmented arecanut images.If the input image includes both arecanut and its branches,the input image can have a complex background compared to the foreground.In this case,the proposed background and foreground separation steps using Otsu threshold may not work properly and hence the performance of the proposed method may degrade.To overcome this problem,the method should segment arecanut area without binarisation using Otsu threshold,which is another challenge and another direction of the research work.But it is beyond the scope of the proposed work because the focus of the present work is disease identification but not segmentation of the arecanut area.This shows that there is scope for improvement in the near future.
5|CONCLUSION AND FUTURE WORK
In this work,we have proposed a new model for disease identification of arecanuts.The problem of disease identification is considered as a four class classification problem which includes three types of diseases,namely,images Rot,Split,Rot-Split and one more class of healthy arecanut images.To enhance the fine details in the images affected by different diseases,the proposed model exploits multi-gradient directional Sobel masks,which results in enhanced images.For disease identification,the proposed model extracts foreground information (arecanut) from the background using Otsu thresholding.Next,the multi-gradient directional information is extracted from the enhanced images corresponding to foreground information given by Otsu thresholding.The multi-gradient directional information of the foreground is fed to the ResNet deep learning model for disease identification in this work.The suggested method outperforms the existing methods in terms of classification rate,recall,precision,and F-measure,according to experimental results.Since the scope of the proposed work is limited to three types of disease,our future target is to extend the same idea for more diseases.Furthermore,the steps of Otsu threshold for binarisation will be replaced with a new one to make the proposed method robust for different disease classifications.
ACKNOWLEDGEMENT
There is no financial support for this research work.
CONFLICT OF INTEREST
No.
DATA AVAILABILITY STATEMENT
The data that support the findings of this study are available on request from the corresponding author.
ORCID
Palaiahnakote Shivakumarahttps://orcid.org/0000-0001-9026-4613
杂志排行

CAAI Transactions on Intelligence Technology的其它文章
- Matrix‐based method for solving decision domains of neighbourhood multigranulation decision‐theoretic rough sets
- Feature extraction of partial discharge in low‐temperature composite insulation based on VMD‐MSE‐IF
- Wavelet method optimised by ant colony algorithm used for extracting stable and unstable signals in intelligent substations
- Efficient computation of Hash Hirschberg protein alignment utilizing hyper threading multi‐core sharing technology
- Improving sentence simplification model with ordered neurons network
- Demand side management for solving environment constrained economic dispatch of a microgrid system using hybrid MGWOSCACSA algorithm