Effect of the target positions on the rapid identification of aluminum alloys by using filament-induced breakdown spectroscopy combined with machine learning
2022-05-16XiaoguangLi李晓光XuetongLu陆雪童YongZhang张勇ShaozhongSong宋少忠ZuoqiangHao郝作强andXunGao高勋
Xiaoguang Li(李晓光) Xuetong Lu(陆雪童) Yong Zhang(张勇)Shaozhong Song(宋少忠) Zuoqiang Hao(郝作强) and Xun Gao(高勋)
1School of Electrical Information,Changchun Guanghua University,Changchun 130033,China
2School of Physics,Changchun University of Technology,Changchun 130600,China
3School of Information Engineering,Jilin Engineering Normal University,Changchun 130052,China
4School of Physics and Electronic Sciences,Shandong Normal University,Jinan 250358,China
Keywords: filament-induced breakdown spectroscopy (FIBS), principal component analysis (PCA), support vector machine(SVM),K-nearest neighbor(KNN),aluminum alloys identification
1. Introduction
Laser-induced breakdown spectroscopy(LIBS)is an elemental analysis method. In qualitative and quantitative analysis of the constituent elements of substances (solid, liquid or gas samples), the emission spectrum of plasma is generated by ablation of target surface by a tightly focused nanosecond laser.[1,2]Due to changes in the interaction between laser and matter,femtosecond LIBS(fs-LIBS)can improve the parameters of LIBS quantitative analysis(for example,better reproducibility,reduced matrix effect and reduced damage).[3,4]Other advantages of fs-LIBS include low ablation threshold,signal accumulation of a large number of pulses,and reduced heat-affected zone.[5,6]Due to the dynamic balance between optical Kerr self-focusing and plasma de-focusing, the femtosecond laser beam is focused in the air to form a long filament with the clamped laser intensity of 1013W/cm2–1014W/cm2.[7]Compared with traditional long-pulse laserinduced breakdown spectroscopy, a significant advantage of FIBS is that it can overcome diffraction to transmit highintensity filaments over long distances. It has been widely used in quantitative analysis of substances, detection of explosive substances,heavy metal pollution in water,biological fields, isotope detection, environmental detection, and other fields.[8–14]
In recent years, FIBS combined with machine learning algorithms to detect and identify samples has attracted much attention. Kalamet al.[15]used fs-LIBS and principal component analysis(PCA)to detect and identify explosive molecules(nitroimidazole and nitropyrazole). The Schmidt–Cassegrain telescope collects radiant plasma at about 8.5 m. The focal length of the focusing lens is 10 cm, 30 cm, 50 cm, 100 cm,and 200 cm. As the focal length of the lens increases,the contribution rate of the first three PCs drops from 99% to 52%.Kalamet al.[16]used FIBS combined with PCA to detect and identify metals, alloys, and bimetals at a distance (6.5 m).When the ICCD gain is 1000 and 2500, the first three PCs of metal and bimetal account for 73% and 98% of the total variance. Junjuriet al.[17]used fs-LIBS combined with PCA and artificial neural networks (ANN) to obtain a 100% correct prediction rate for post-consumer plastic identification.Fuet al.[14]used FIBS combined with PCA to identify tree species (willow, pine, and poplar) and their growth environment,and the first three PCs accounted for 99.83%of the total data.Narlaet al.[18]used FIBS to extract features from PCA as input variables for support vector machine(SVM)to identify metals and metal alloys. Both the color CCD image and femtosecond LIBS achieve 100% identification accuracy. Kalamet al.[19]used fs-LIBS and FIBS to identify four types of rocks by using PCA in near-field and standoff modes(15 cm,6.5 m),and the first three PCs accounted for 93%,82%,97%,and 91%of the total variance in the data set in the nearfield and standoff mode,respectively.
Different laser pulses (such as laser wavelength, pulse duration, and laser energy) and experimental conditions (for example, the direction of incident laser to target surface, the method of collecting spectral signals,or the distance between focusing lens and target surface) affect the spectral emission of laser-induced plasma.[20,21]Harilalet al.[22]found that the spectral radiation intensity and spatial distribution of the electron density of copper ablated by filament have the same trend,which firstly increases and then decreases along the filament.The variation of the spectral radiation intensity at different positions of the filament is related to the atomic density, which affects the ablation efficiency. Increasing the filament laser pulse energy, the filament plasma electron density also becomes higher,because there is an energy reservoir around the filament. Yaoet al.[23]studied the influence of femtosecond laser energy on ablation characteristics. When the femtosecond laser energy increases, the internal energy of the energy reservoir around the filament also increases. The different distances between the focusing lens and target surface will result in different spot sizes on the target surface, which will affect the interaction between laser and target. This results in changes in laser-induced plasma spectral radiation characteristics,ablation efficiency,and FIBS analysis performance.[24,25]In our previous work,[26]we studied the effect of the distance between focusing lens and target surface on quantitative analysis of Mn in aluminum alloys by using FIBS. It is found that the distance between the focusing lens and target surface affects spectral stability and accuracy of quantitative analysis,and the filament is better than the pre-and post-filaments.Therefore,this paper uses FIBS combined with machine algorithms to identify aluminum alloys, uses PCA to analyze the data set of intensity and intensity ratio of fifteen characteristic spectral lines of FIBS spectrum, and combines SVM and Knearest neighbor (KNN) to analyze the effect of the distance between the focusing lens and target surface on identification accuracy of aluminum alloys.
2. Experiments and samples
Figure 1 is an experimental setup for identifying aluminum alloys by using FIBS. Ti: sapphire laser system (Coherent,repetitive frequency of 1 kHz,wavelength of 800 nm)generates 45 fs laser pulses. The femtosecond laser beam is focused on aluminum alloys by a K9 lens 1 with the focal length of 1000 mm. The plasma emission spectral signal is collected by lens 2 (BK7,f=75 mm, diameter 50 mm) and coupled to Andor Echelle 5000 spectrometer (resolution of 0.05 nm at 500 nm,and detection spectrum range of 200 nm–880 nm)equipped with ICCD through an optical fiber(diameter 600 μm). The aluminum alloy target is placed on a threedimensional(3D)translation stage in order to avoid excessive ablation. To obtain FIBS spectrum in accumulation mode (5 times accumulation), delay time, and the gate width are set 4 μs and 10 μs,respectively. A one-dimensional(1D)translation stage is used to change the distance between lens 1 and the target surface, and the forming filament is about 40 mm (observed by the naked eye). The whole experiments are done at the experimental conditions of pulse energy of 2 mJ,standard atmospheric pressure,room temperature of 22°C,and relative humidity of 25%.
In our experiment,five kinds of aluminum alloy samples(1060/2024/5052/6061/7075) were purchased on the market with length of 5 cm,the width of 5 cm,and thickness of 2 mm.Table 1 is the element concentrations of aluminum alloy samples.

Fig.1. FIBS system setup.
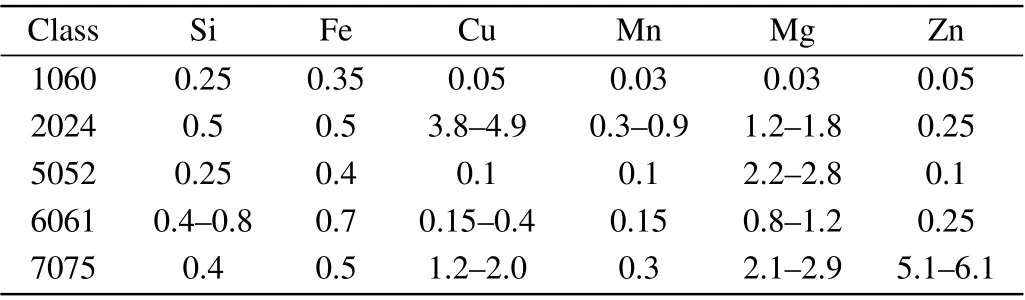
Table 1. Element concentrations of aluminum alloy samples (in units of wt%).
3. Data processing
3.1. PCA
PCA is an unsupervised data dimensionality reduction method. It calculates the eigenvector of data covariance matrix,and projects each variable onto largest eigenvector to reduce the number of variables and ensure that each variable is independent.[27–30]When using PCA, for original dataXm×n[mrepresents the number of samples (number of spectra),nrepresents the number of features(wavelength)],standard conversions of samples are
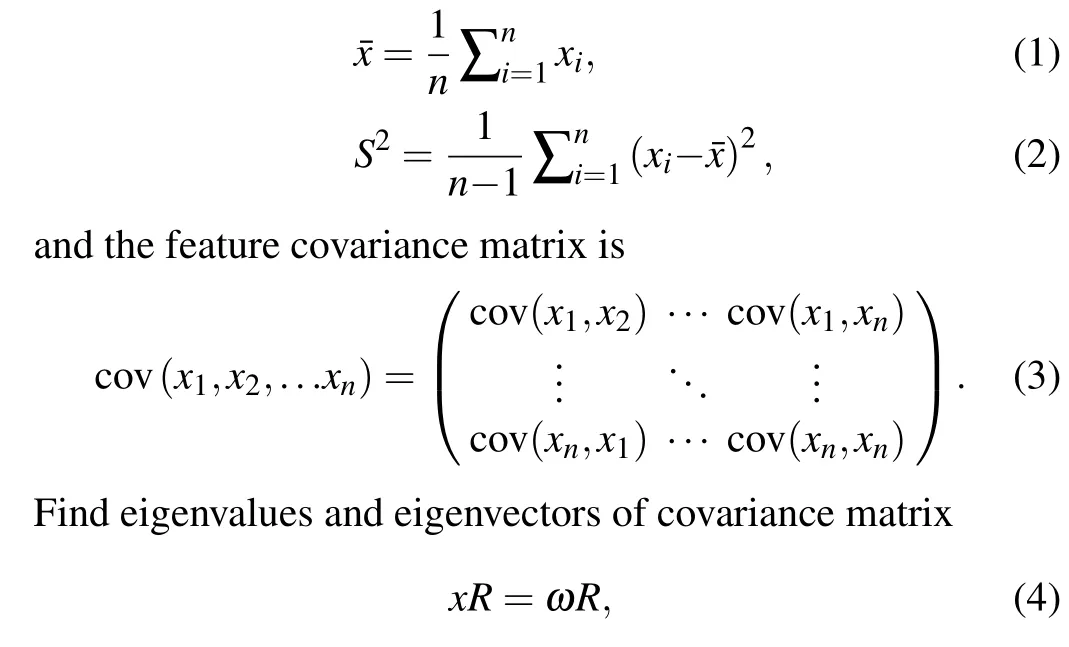
where eigenvalueωis the diagonal element, andRis eigenvector ofxcorresponding to the eigenvalueω. The principal component is selected according to the contribution rate of the principal component. The principal component (PC) represents the variance of the data set,and PC1 is the highest.
3.2. SVM
SVM establishes the optimal hyperplane based on the principle of maximizing the interval.[31–33]The training sample set is (xi,yi),xis the sample attribute value, andyis the result label. A linear function is constructed in the highdimensional space to realize the nonlinear discriminant function in the low-dimensional space,and the optimal linear decision function analysis data is obtained. A hyperplanef(x)=ωTx+bis established in the data space to find the optimal classification hyperplane. This problem is solved by the Lagrangian method,and the dual form is obtained by
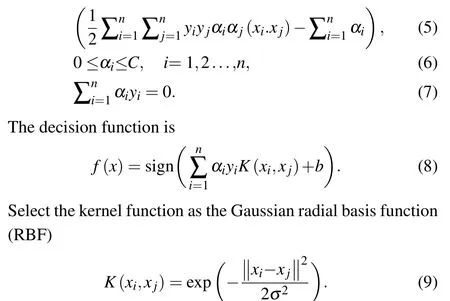
Finally,the decision function is
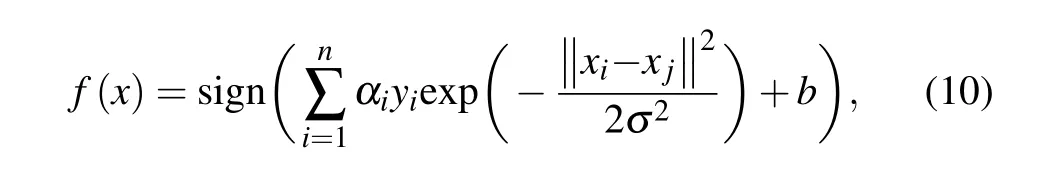
whereσrepresents the width of the Gaussian kernel function.
3.3. KNN
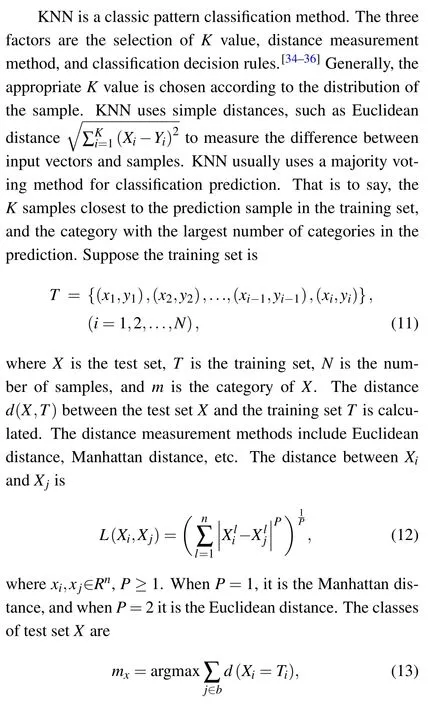
wheredis an indicator function. WhenXi=Ti,d=1,otherwised=0.
4. Results and discussion
4.1. FIBS spectra
Figure 2 shows the FIBS spectra of five aluminum alloys.At the distance of 976 mm between the focusing lens and target surface, the 20 sets of spectral data were averaged and normalized. It can be seen that the AlO radical B2Σ+X2Σ+transition spectrum line is detected in the wavelength range of 440 nm–540 nm. This is due to the coexistence of several reactions among the excited radicals, atoms, molecules, and the environment in plasma generated by the laser,which leads to the formation or depletion of substances.[37,38]The wavelength range of 550 nm–880 nm has a wavy continuous spectrum,because the Echelle spectrometer diffracts the spectrum in this wavelength range.
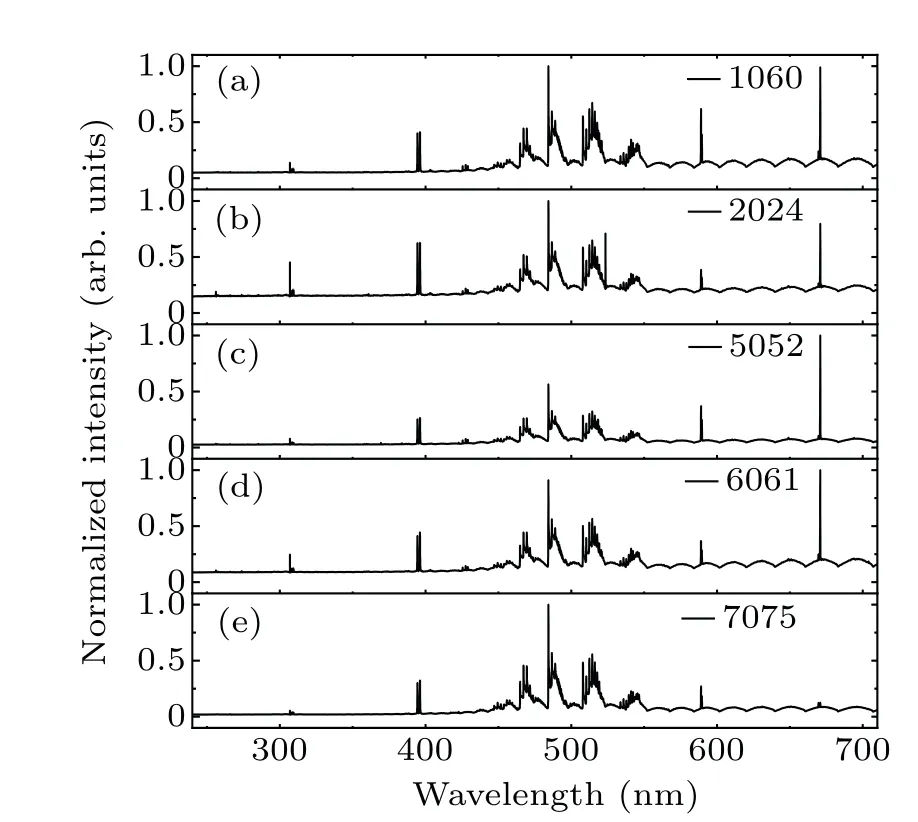
Fig. 2. FIBS spectra of the aluminum alloys: (a) 1060, (b) 2024, (c)5052,(d)6061,and(e)7075.
According to the National Institute of Standards and Technology (NIST) standards database, the FIBS spectrum in the wavelength range of 200 nm–880 nm is marked, and the plasma optical emissions of six elements iron(Fe),silicon(Si),magnesium(Mg),copper(Cu),zinc(Zn)and manganese(Mn)are found. The concentration of elements in experimental samples of aluminum alloy is different, and the intensity of the FIBS characteristic spectrum is also different. The aluminum alloys are identified by the intensity of characteristic spectral lines. The selection of the characteristic spectral line satisfies the high intensity of the spectral line and high signalto-background ratios (SBR), and there is no strong interference spectral line around the characteristic spectral line. The characteristic spectrum selects fifteen spectrum lines of six elements with an error of 0.1 nm,as shown in Table 2.
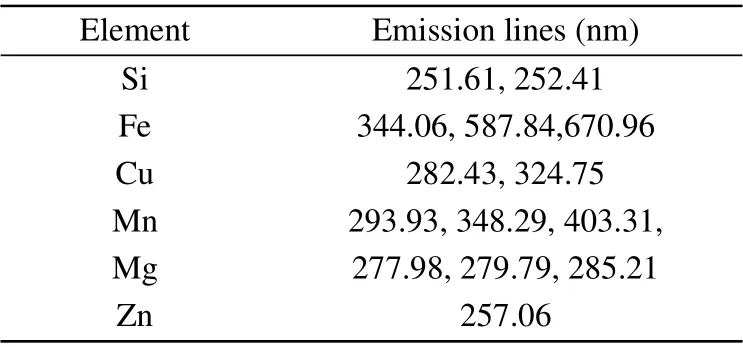
Table 2. The 15 characteristic spectral lines.
4.2. Different positions of filament
The initial powerPinof the femtosecond laser pulse is higher than the critical power of self-focusingPcr,which will produce filaments. According to the semi-empirical Marburger formula, the positionLcwhere the self-focusing collapse occurs(where the beam radius is the smallest along the propagation direction)is[39]
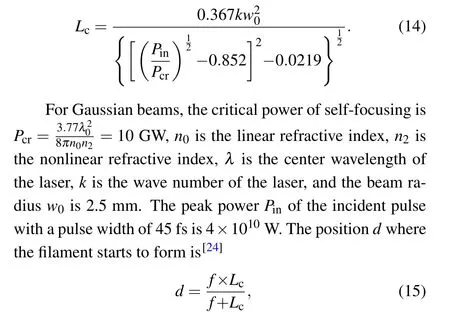
wherefis the geometric focal length of the lens,and the calculatedd=966 mm. The position where the filaments start to form (966 mm) is before the geometric focus (1000 mm)of the focusing lens,because Kerr nonlinear self-focusing focuses the laser beam in advance.[40]According to changing trend of the spectral line intensity, it can be considered that the filament ends at a distance of 992 mm between the focusing lens and target surface. We are studying three interval ranges: (i) the pre-filament area (958 mm–966 mm); (ii) the filament area (966 mm–992 mm); and (iii) the post-filament area(992 mm–1000 mm).
4.3. Result of PCA
The intensities of fifteen characteristic lines of six elements are used as the PCA data set to obtain the PC contribution of the FIBS spectrum. The optimal number of PCs depends on many factors, such as the structure of the original data, the application, and the experience and expertise of the researchers (select the spectrum according to the sample element). Anabitarteet al.[41]used PCA combined with SVM to identify nucleoli and analyzed the influence of the number of PCs on identification accuracy. It shows that at least three PCs can obtain accurate results, that is, the cumulative contribution rate of three PCs should be greater than 85%. In the pre-filament area, the filament area and the post-filament area(the distance between the focusing lens and target surface is 958 mm, 976 mm, and 1000 mm, respectively). The first three PCs explained 69.48%,79.46%,and 64.54%of the total data, and the first three PCs cumulatively explained 83.26%,89.06%,and 81.57%of the total data. The first three PCs cannot display the total variance of the data set. PCA results are related to experimental fluctuations(instability and limitations of the detection system,unevenness of local samples,etc.)and the inherent characteristics of the characteristic spectrum. The spectrometer (resolution=0.05 nm) used in our experiment cannot detect certain signals of trace elements.[29]
In order to improve the PCA results, the intensity ratio between different spectral lines is calculated.[14,19]Including Si I 251.61 nm, Si I 252.41 nm, Zn I 257.07 nm,Mg I 277.98 nm, Mg II 279.79 nm, Cu I 282.43 nm, Mg I 285.21 nm,Mn II 293.93 nm,Cu I 324.75 nm,Fe I 344.06 nm,Mn II 348.29 nm, Mn I 403.31 nm, Fe I 587.84 nm, and Fe II 670.96 nm. Because the intensity ratio produces a larger size. That is, Mg I 277.98 nm/Mn II 293.93 nm, Mg II 279.79 nm/Cu I 282.43 nm,Cu I 324.75 nm/Mn II 348.29 nm,Fe I 344.06 nm/Mn I 403.31 nm, Mg I 285.21 nm/Fe II 670.96 nm, Si I 251.61 nm/Zn I 257.07 nm, Zn I 257.06 nm/Fe I 344.06 nm, Si I 252.41 nm/Fe I 587.84 nm,Si I 252.41 nm/Mg II 279.79 nm, Si I 251.6 nm/Mn II 348.29 nm,Si I 251.6 nm/Cu I 324.75 nm,Zn I 257.07 nm/Cu I 282.43 nm, Zn I 257.07 nm/Mn II 299.93 nm, and Zn I 257.07 nm/Mg I 277.98 nm. The calculated spectral signal intensity ratio is the data set of PCA.
Figure 3 is the result of PCA intensities of fifteen characteristic lines in FIBS spectra of five aluminum alloys in the pre-filament area,the filament area and the post-filament area(the distance between the focusing lens and target surface is 958 mm,976 mm,and 1000 mm,respectively). PCA converts the FIBS spectra of five samples into three PCs. The cumulative interpretation rate of the three PCs by using intensity ratio as the source data set is 97.22%,98.17%,and 95.31%,respectively, which is better than the PCA results of fifteen spectral line intensities as feature vectors (83.26%, 89.06%, and 81.57%). Because the signal intensity ratio is used as the PCA data set,the result is independent of the system measurement error,which affects the measured spectral signal intensity.
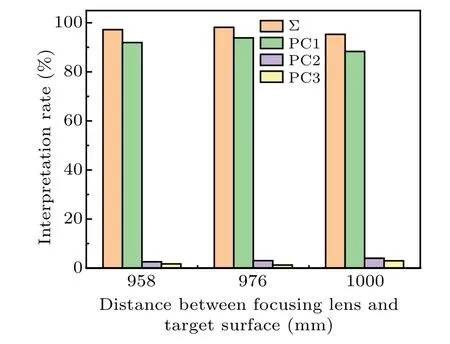
Fig.3. PCA results at three positions(pre-filament at 958 mm,filament at 976 mm,and post-filament at 1000 mm,respectively).
4.4. Results of SVM/KNN combined PCA
Five aluminum alloy samples have a total of 800 sets of FIBS spectra, and 15 characteristic spectral line intensity ratios are used as a data set for PCA.In the pre-filament area,the filament area and the post-filament area(the distance between the focusing lens and target surface is 958 mm,976 mm,and 1000 mm, respectively). The cumulative interpretation rates of the first three PCs are 97.22%, 98.17%, and 95.31%, respectively. PC1, PC2, and PC3 replace FIBS spectra to construct feature space vectors,which are used as input variables of SVM and KNN to identify five aluminum alloys.The MATLAB2018 toolbox is used as a data processing tool for 5-fold cross-validation. The confusion matrix represents the identification accuracy of SVM and KNN, and the identification accuracy is the evaluation index for identification.[42]Figure 4 shows the identification results of PCA-SVM and PCA-KNN at three positions(the distance between the focusing lens and target surface is 958 mm, 976 mm, and 1000 mm, respectively). Figure 5 shows the spatial distribution of aluminum alloys identification accuracy. The result of each position is an average of five sample identification results.The identification accuracy of PCA-SVM exceeds 82%, and the identification accuracy of PCA-KNN exceeds 66%. In the three positions,the SVM identification accuracy is 83.4%, 100%, and 82%,respectively. The identification accuracy of KNN is 69.2%,90%, and 66%, respectively. It can be seen that the identification results of the two algorithms have the same trend, and both rise first and then fall. The identification accuracy of the filament area is higher than that of the pre-and post-filament areas and is stable,and the identification accuracy of SVM is higher than that of KNN.
In our previous work,we found that the quantitative analysis accuracy and spectral stability of the filament area are better than the pre- and post-filament areas.[26]The intensity clamping effect of the filament leads to better laser power stability,sensitivity,and radiation plasma stability in the filament area. The filament carries a small part of the laser energy,and most of the energy is released into the energy reservoir around the filament. The energy store continuously compensates for the energy loss in the ablation process of aluminum alloys, and plays a role in auxiliary ablation. Therefore, the ablation efficiency of filament depends on both the intensity clamping effect in filament and the energy reservoir around the filament.[23,43,44]Before the beam collapse occurs, the Kerr self-focusing effect causes the modulation instability of the laser,which makes the laser intensity uneven. The laser beam is in a divergent state in the post-filament area, the diffraction and dispersion are stronger than the self-focusing effect,and the spectral stability is lower than the pre-filament area.Therefore,the identification accuracy of the pre-filament area is higher than the identification accuracy of the post-filament area.
In filament area (the distance between the focusing lens and target surface is 976 mm), 100 groups of FIBS spectrum data of PCA are randomly selected according to 3:2.The LIBS spectral data of the training set and test set are 60 groups and 40 groups, respectively. SVM model established in the training set predicts 40 sets of spectral data in the test set. The result is shown in Fig. 6, where “*” represents
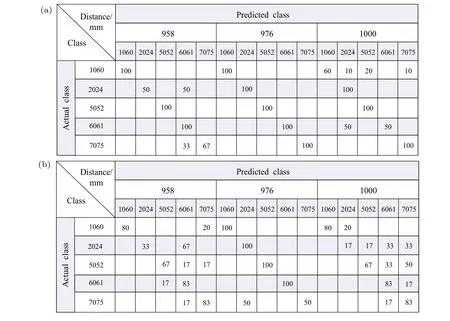
Fig. 4. Three positions identification results (pre-filament at 958 mm, filament at 976 mm, and post-filament at 1000 mm, respectively). (a)PCA-SVM and(b)PCA-KNN.
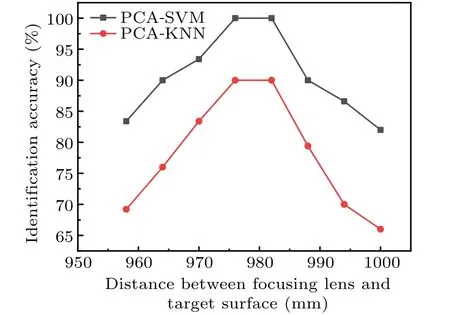
Fig.5. Spatial distribution of aluminum alloys identification accuracy.
the predicted label, and “°” represents the actual label. The results show that the identification accuracy of PCA-SVM is 97.5%. In the 40 test set spectra, one 7075 was misjudged as 2024. The identification accuracy of PCA-KNN is 92.5%.Two 7075 were misjudged as 2024, and one 1060 was misjudged as 6061.The running time of SVM is 0.62 s–1.74 s,the running time of KNN is 0.37 s–1.39 s,and the running time of KNN is faster than SVM.SVM has certain advantages in processing nonlinear data.The SVM classifier is very simple,and only a small amount of training data is needed to establish a stable classification model. Even if the sample dimension is very high, it will not bring inconvenience to storage and calculation.More stable and accurate identification results can be obtained. The KNN algorithm uses all samples in identification, and needs to be compared with the rest of the points in the set each time. So compared to KNN,SVM has better identification results and stability and is simpler to implement.[45]
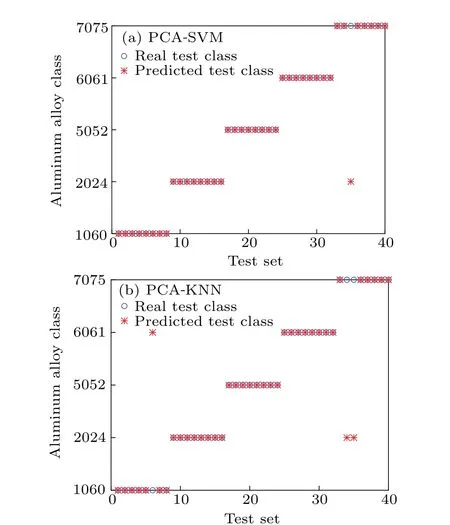
Fig.6. Spectral identification results in the test set: (a)PCA-SVM and(b)PCA-KNN.
5. Conclusions
This study is based on FIBS, using PCA combined with SVM and KNN to identify aluminum alloys. Two spectral feature extraction methods are proposed for PCA:The characteristic parameter is constituted by the ratio of the intensity of the characteristic spectral line and the intensity of the element spectral line.SVM and KNN are used to identify aluminum alloys. The identification accuracy of the filament area is higher than pre- and post-filament area. The identification accuracy of SVM in the filament area is 100%,and the KNN is 90%. It is because of the clamping effect of the filament and the role of the energy reservoir around the filament. FIBS combines machine learning algorithms to distinguish aluminum alloys,which is beneficial to accurately and quickly detect and identify aluminum alloys during manufacturing, inspection, and recycling processes, and improve the utilization rate of aluminum alloys. In addition, the purpose of this experiment is not to use as many aluminum alloys as possible to prove that this method is applicable to all categories, but to provide a useful method to prove that FIBS can effectively identify aluminum alloy samples. The method of this experiment is also suitable for detecting other substances.For example,FIBS can quickly detect and identify substances from the standoff mode,in dangerous and polluted environments.
Acknowledgement
Project supported by the Natural Science Foundation of Jilin Province,China(Grant No.2020122348JC).
猜你喜欢
杂志排行

Chinese Physics B的其它文章
- Erratum to“Boundary layer flow and heat transfer of a Casson fluid past a symmetric porous wedge with surface heat flux”
- Erratum to“Accurate GW0 band gaps and their phonon-induced renormalization in solids”
- A novel method for identifying influential nodes in complex networks based on gravity model
- Voter model on adaptive networks
- A novel car-following model by sharing cooperative information transmission delayed effect under V2X environment and its additional energy consumption
- GeSn(0.524 eV)single-junction thermophotovoltaic cells based on the device transport model