Raman spectroscopy investigation on the pressure-induced structural and magnetic phase transition in two-dimensional antiferromagnet FePS3
2022-05-16HongZeng曾鸿TingtingYe叶婷婷PengCheng程鹏DeyuanYao姚德元andJunfengDing丁俊峰
Hong Zeng(曾鸿) Tingting Ye(叶婷婷) Peng Cheng(程鹏) Deyuan Yao(姚德元) and Junfeng Ding(丁俊峰)
1Key Laboratory of Materials Physics,Institute of Solid State Physics,HFIPS,Chinese Academy of Sciences,Hefei 230031,China
2University of Science and Technology of China,Hefei 230026,China
Keywords: FePS3,layered magnetic materials,high pressure,Raman spectroscopy
1. Introduction
Recent discoveries of magnetic two-dimensional (2D)van der Waals(vdW)materials,which can stably retain longrange magnetic ordering with a single atomic layer thickness,provide rich opportunities for future novel devices and probing magnetic fundamental properties.[1–14]Various 2D magnets have recently been proposed, such as Cr2Ge2Te6, CrI3,and Fe3GeTe2.[1–4]Transition metal phosphorus trisulfides(TMPS3,TM= Fe, Ni, Mn, etc.) are an important family of vdW layered antiferromagnetic materials exhibiting different kinds of magnetically ordered states by altering the choice of metal ion, which has been a versatile platform for investigating low-dimensional magnetism.[15–19]One such material,FePS3, is a magnetic Mott insulator with a large spin(S=2)and has an Ising-type antiferromagnetic ordering down to the monolayer limit withTN~118 K.[20–24]
Pressure has been proven to be an effective tool to tune the structural,electronic,and magnetic properties of these 2D magnetic materials.[25–29]Earlier high-pressure x-ray experiments suggested that there are three different phases with increasing pressures up to 18.1 GPa.[29]At ambient pressure,FePS3has a monoclinic lattice with space groupC2/m, denoted as the low-pressure(LP)phase and shown in Fig.1(a).The first phase transition occurs at approximately 4 GPa,transforming to high-pressure (HP) phase HP-I with a monoclinic structure(C2/m). There is a visible difference between these two phases in which the adjacent layers slide with each other,causing a displacement of the unit cell along thea-axis and a reduction in theβangle between theaandcaxes, as shown in Fig. 1 (from 107.34°to 89.33°). The second phase transition occurs at approximately 14 GPa, changing to highpressure phase HP-II with a trigonal structure(P-31m) in the concomitance of the volume collapse.[28–31]Moreover, the insulator-to-metal transition (IMT) occurs accompanying the second transition with a reduction in the unit cell and the vdW gap.[25,26,30]However, exactly determining the crystal structure at high pressure is always a challenge because of the inhomogeneous pressure distribution, multiple phase coexistence,broadening of diffraction peaks, and so on. Thus, further investigations using other techniques are needed to verify the structural evolution under pressure detected by x-ray diffraction.
In addition to the changes in the structural and electron transitions, layered FePS3undergoes various magnetic order transitions under pressure.[27,28,31]There is now increasing controversy about the magnetic structure evolution with different views. Zhanget al.[31]used DFT +Ucalculations to indicate that the FePS3-C2/mLP phase and the FePS3-C2/mHP-I phase are both in the zigzag antiferromagnetic(z-AFM) state, whereas the FePS3-P-31mHP-II phase is nonmagnetic(NM),suggesting a collapse of the Fe spin configuration due to the spin-crossover transition from magnetic highspin(S=2)to nonmagnetic low-spin(S=0).[28,31]However,Coaket al.[27]used neutron powder diffraction to measure the magnetic structure evolution up to 18.3 GPa at different temperatures. The two different magnetic structures, which are the overall antiferromagnetic structures within theabplanes,switch at 2 GPa from the magnetic propagation vector and are altered fromk=(0,1,1/2) tok=(0,1,0) with a halving of the magnetic unit cell size,[27]shown in supplementary information Fig. S1. In addition, at high pressure, a suppression of this long-range magnetic order due to the pressure-induced increasing crystal field splitting energyΔ[31]and appearance of short-range magnetic order even existing above room temperature were observed,[27]while earlier high-pressure x-ray emission spectroscopy[28]and related calculations reported a nonmagnetic state (S=0) via pressure-induced spin quenching after the disappearance of the long-range magnetic order in theseTMPS3materials.[28,31–33]
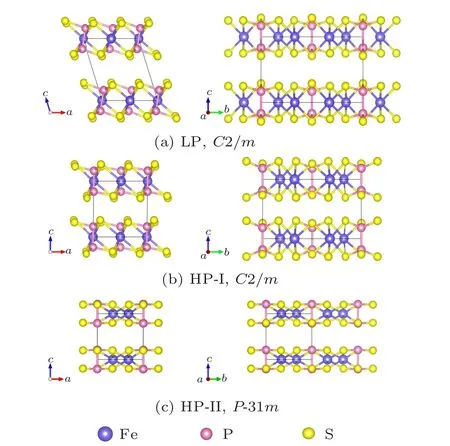
Fig.1. Crystallographic structure of FePS3 in the low-pressure monoclinic phase(LP,space groupC2/m),intermediate pressure monoclinic phase(HPI,space group C2/m)and high-pressure trigonal phase(HP-II,space group P-31m). Fe atoms are pictured in blue,P in purple,and S in yellow. Crystallographic parameters are taken from earlier XRD experimental data for FePS3 at 0, 10 GPa, and 18 GPa. The illustrations were created using VESTA software.[29,34]
To further clarify the effect of pressure on FePS3,we conducted a systematic investigation of pressure dependent Raman spectroscopy, which has been proven to be a powerful tool to probe the crystalline structure and magnetic structure changes in these 2D magnetic materials.[35,36]Here, our results verify two structural phase transitions and two magnetic structure transitions with reference to earlier calculations and experiments for various high-pressure phases.[27–31]
2. Experimental details
Commercially available high-quality single crystals of FePS3(purchased from Six Carbon Technology) were used for Raman spectroscopy and high-pressure experiments. The materials were synthesized using the chemical vapor transport(CVT)method and checked by single crystal x-ray diffraction(XRD).[22,37,38]High-pressure Raman measurements were performed up to 18.9 GPa at room temperature in a symmetric diamond anvil cell (DAC) with 300 μm culet-sized diamonds. The thin FePS3flake studied herein was prepared by mechanical exfoliation and then loaded into the sample chamber. Pressure was determined by measuring the shift in the fluorescence wavelength of ruby chips. Silicone oil was used as the pressure transmitting medium(PTM).The Raman spectra were recorded in a backscattering configuration with a 532 nm excitation wavelength laser using a confocal microscope setup with a 20×objective(N.A.=0.25)and a triple grating Raman spectrometer (1200 mm-1grating) coupled to a thermoelectrically cooled CCD detector. The appropriate laser power of 5 mW was chosen to improve the signal-to-noise ratio as well as avoid an excessive heating effect.
3. Results and discussion
3.1. Crystal structure and Raman studies at ambient pressure
The optical image of the single crystal sample of FePS3is illustrated in Fig.2(a). Bulk FePS3at ambient pressure and room temperature has a monoclinic structure with the space groupC2/mchecked by single x-ray diffraction,in which the number on the peaks corresponds to the (00l) index.[39]As shown in Fig. 1(a), the crystal structure of FePS3at ambient pressure is composed of two-dimensional(2D) layers extended parallel to theabplane and bonded by weak van der Waals interactions along thecaxis, similar to other layered materials, such as graphite and MoS2. For each layer, Fe atoms are octahedrally coordinated with six S atoms,while P atoms are tetrahedrally coordinated with three S atoms forming a [PS3]2-unit, which is further connected with another unit forming a[P2S6]4-unit of a bipyramid shape.[23,24]
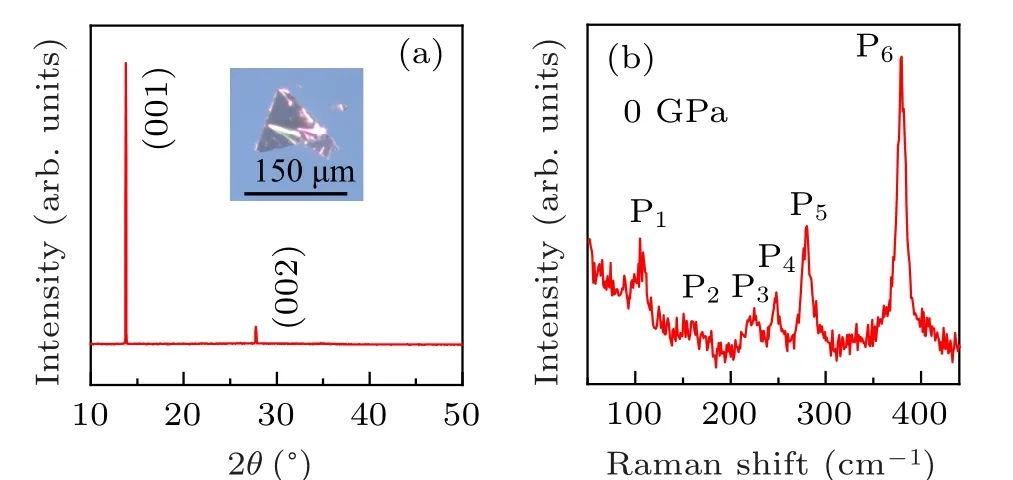
Fig. 2. (a) XRD patterns of single crystals of FePS3, corresponding to the crystal plane of (00l). The inset shows a photograph of the FePS3 sample. (b)Raman spectroscopy of FePS3 single crystals at room temperature(300 K)using a 532 nm excitation laser.
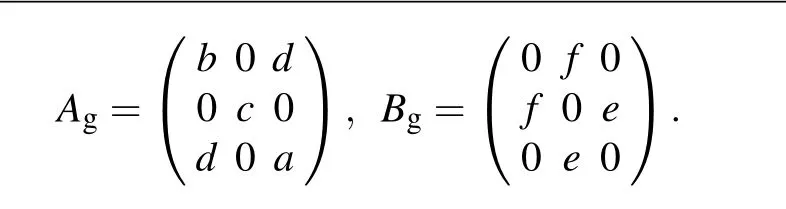
The primitive cell of bulk FePS3has 10 atoms in total (two FePS3formula units), and it possesses 30 phonon modes at the irreducible Brillouin zone center given byΓ=8Ag+6Au+7Bg+9Bu.[22–24,40,41]Based on the group analysis,the Raman active modes in FePS3are of Ag and Bg symmetry,and the corresponding Raman tensors are
From the Raman spectra of the cleaved FePS3sample in Fig. 2(b), we can see that at ambient pressure, there are six modes with green laser excitation (λ=532 nm). They center at 106.2 cm-1, 158 cm-1, 223.7 cm-1, 246.1 cm-1,278.7 cm-1and 378.6 cm-1, identified as Pi,i=1,...,6 in Fig. 2(b). The experimental observed mode frequencies are summarized in Table 1 and are in good agreement with the experimental and theoretical results in the literature.[22–24]The low-frequency modes P1and P2are from vibrations involving Fe atoms and have dramatic changes accompanying a sudden Raman intensity increase due to the onset of antiferromagnetic ordering.[41,42]Interestingly,P1at room temperature in the paramagnetic phase shows an asymmetric and broad line shape, whereas four sharp peaks from P1emerge below the Neel temperature. It can be understood in terms of zone folding, which the in-plane unit cell doubles in size and the first Brillouin zone is halved due to the onset of antiferromagnetic ordering.[23,24,43]We note that the line shape of P1is almost unchanged by the variations in pressure shown in the supplementary information Fig.S2; therefore,we applied the one-Lorentzian peak fit for simplification. On the other hand,the high-frequency modes P3–P6,similar to the corresponding modes for the variousTMPS3materials,[35,36,40]are mostly ascribed to the molecular-like vibrations from the bipyramid structures of the[P2S6]4-unit with a very small Fe ions contribution.
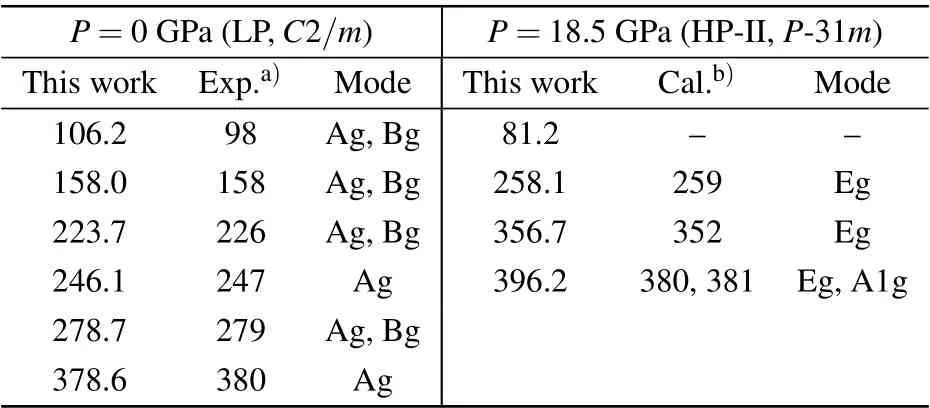
Table 1. Raman frequencies(in cm-1)for FePS3 at different pressures.The experimental Raman frequencies measured at ambient pressure and related high-pressure Raman calculations(18 GPa) are listed for comparison.
3.2. High-pressure Raman investigation
To investigate the pressure-driven phase transition in FePS3, the Raman spectrum and phonon frequency change of the thin flake sample were measured under pressures up to 18.5 GPa shown in Figs.3(a)and 3(b).
3.2.1. Pressure-induced structural phase transition
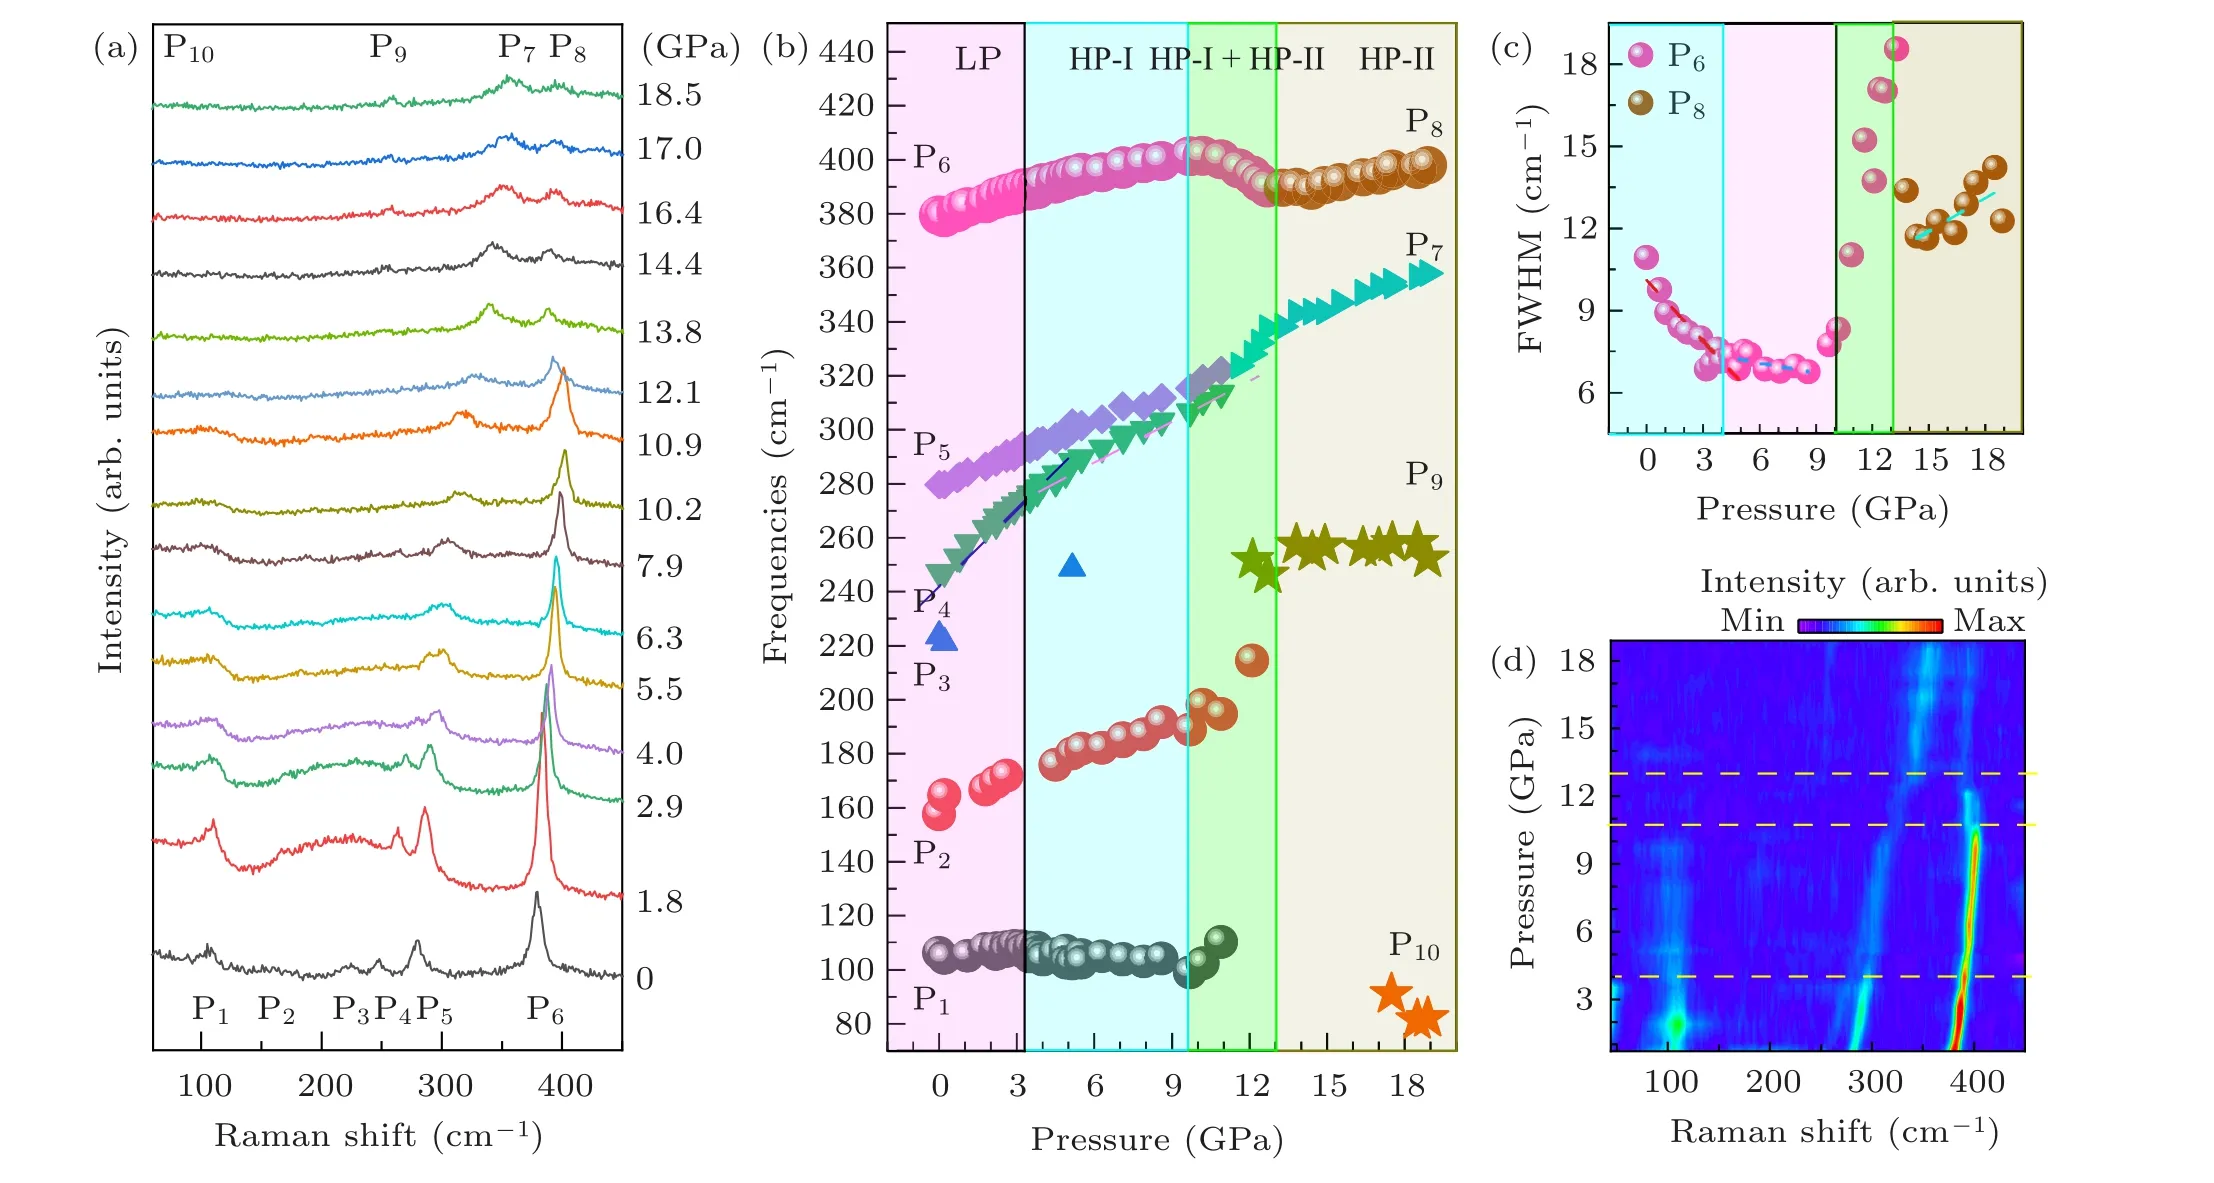
Fig.3. (a)Pressure dependence of the Raman spectrum for the single crystal flake FePS3. (b)Pressure-dependent frequencies of several Raman peaks using Lorentz fit. (c)FWHM of P6 and P8 under pressure. (d)2D plot of the Raman intensity as a function of pressure and Raman shift.
In the low-pressure region (below 10 GPa), most of the phonon frequencies exhibit varying degrees of blueshift due to the usual pressure-induced volume contraction effect,whereas the frequency of P1remains almost unchanged,which we will discuss its special pressure dependence later after obtaining more detail of the structural information. We can identify an obvious inflection point at 4 GPa, after which the shift of linewidth decreases dramatically. Moreover, the full width at half maximum(FWHM)of P6decreases at the same point,as shown in Fig.3(c). This special pressure is consistent with the first phase transition point in the earlier high-pressure x-ray experiment reported by Haineset al.[29]To study the phase transition of FePS3carefully, another sample was measured,and the pressure-dependent phonon frequencies and 2D contour under pressure are shown in Fig.3(d)and supplementary Fig. S3 (repeated experiment), respectively. Corresponding abrupt changes of slope at 4 GPa are obviously seen when we use the formulaωp=ω0+(dω/dp)pto linearly fit the high frequency modes P4–P6, which are mainly attributed to molecular-like vibrations from the[P2S6]4-bipyramid structure as discussed above.More detailed information is shown in supplementary information Table S1 and Figs.S4–S5. Therefore, it is reasonable to expect that the [P2S6]4-unit has two different pressure-dependent deformation models: below 4 GPa,the two units in adjacent layers are forced to slide with respect to each other, leading to the two bipyramids directly above one another; above 4 GPa, pressure-induced deformation of the P–S tetrahedron becomes more pronounced, especially the decreasing P–S distance along thec-axis, in which the P and S atoms are almost in the same plane with the disappearance of the bipyramid structure, as shown in Fig. 1(c).Thus, our Raman results support that the HP-I phase has the same monoclinic symmetry (C2/m) as the LP phase for the first phase transition at 4 GPa.
At high pressure, P4and P5are relatively close to each other and merge into one peak (P7), which is difficult to distinguish because of the weaker intensity and the broader line width. A similar frequency anomaly is seen at the same pressure point at 13 GPa. Moreover,we note that the P6peak becomes an asymmetrical line shape above 10 GPa. We suspect that the asymmetry is related to the phase transition in which a new peak appears, resulting in a discontinuous phonon frequency and dramatically broadening the linewidth when we use a single peak to fit it. With further increasing pressure,an abrupt change in the slope in the frequency occurs at 13 GPa.Furthermore,in the phase transition,new Raman peaks gradually develop,while some of the other peaks disappear. These results indicate the coexistence of HP-I and HP-II between 10 GPa and 13 GPa.
To further identify the symmetry of the HP-II phase, the Raman modes at 18.5 GPa are listed in Table 1 with reference to the earlier calculations based on trigonal symmetry reported by Evarestovet al.[30]For the HP-II phase in supplementary information Figs.S6 and S7,there are four modes(P7–P10) at 18.5 GPa observed at approximately 81.2 cm-1,258.1 cm-1,356.7 cm-1,and 396.2 cm-1,respectively,which are in good agreement with earlier calculated phonon frequencies, as shown in Table 1. Remarkably, we note the dramatic reduction in the area and intensity of Raman modes, which can be clearly observed in supplementary information Fig.S5 and Raman mapping Fig.3(d). This intriguing result could be due to the pressure-induced changes from insulating to metallic band structures,in which metallization decreases the depth of penetration for the laser. In summary,we have analyzed the anomalistic phonon behavior around the second phase transition from monoclinic symmetry(C2/m)to trigonal symmetry(P-31m).
3.2.2. Pressure-induced magnetic structure transition
After establishing the Raman signatures of the structural phase transition and pressure,we next discuss the possible scenario underlying the pressure-induced magnetic structure transition by analyzing the low-frequency peaks(P1, P2and P10)originating from vibrations including magnetic Fe ions.
Earlier works have established spin-dependent peaks, P1and P2, as indicators for an antiferromagnetic transition, as we mentioned above. In addition, the spin-disorder-induced mode P1, which has a mixed nature with components originating from theMandΓpoints and appears without magnetic ordering,is sensitive to spin structure but not as sensitive to lattice vibration.[22–24]Moreover,the weak interlayer interaction has little effect on the antiferromagnetic ordering, in which the Neel temperature remains almost unchanged to the monolayer limit.[24]Therefore, these results likely explain the different pressure-dependent frequency evolution, in which the frequency of P2gradually upshifts while the frequency of P1is almost unchanged. Hence, spin-related, not lattice parameter sensitive P1has an advantage in exploring the magnetic structure change under compression.
Here, we note the abnormal behavior of P1at approximately 2 GPa and 12 GPa. More details can be found in the Raman intensity and area of the P1mode as a function of pressure(Fig.4). First,the largest value for the intensity and area of fitting curve are observed and centered at 2 GPa. It is also clear upon observing the brighter region of P1in the 2D mapping pattern, Fig. 3(d). The same result can be seen for a repeat experiment shown in supplementary information Fig.S3.Moreover, the linewidth and intensity of this peak have been significantly broadened and sharply decreased at high pressure up to the coexistence of two phases until it disappears with P2.
Suzuki and Kamimura[44]developed a general theory of the spin-dependent phonon Raman scattering in magnetic crystals as follows,I(T)=|R+M〈S0·S1〉/S2|2,whereRandM〈S0·S1〉/S2represent the ordinary spin-independent Raman tenor and spin-dependent term, respectively. And in their categorization, FePS3belongs to 0<R/M. Scagliottiet al.[41]and Leeet al.[24]applied this theory to the correlation between the Raman intensity and magnetic transition in FePS3. In the MnPS3, three magnetic phase transitions were also identified by Raman intensity.[45]Pressure can effectively tune the nearest neighbor spin correlation function〈S0·S1〉/S2, and drives the magnetic phase transitions. As we mentioned above, P1, the spin-related mode, and its intensity are key indicators for magnetic structure transition in FePS3.[22,24,44]Therefore,the abnormal Raman intensity variation in our Raman experiments suggests that there are two different magnetic structures that switch at 2 GPa, which is in accordance with the earlier neutral diffraction experiments.The magnetic phase transition is likely to be originated from the pressure-driven halving of the magnetic unit cell size.[27]In addition, this mode is absent at high pressure, indicating a large change in the Fe spin structure with suppression of the long-range order, which is coincident with the structural phase transition.It is worth noting that one new low-frequency Raman mode gradually appears with increasing pressure, as shown in supplementary information Figs. S6 and S7, which may be related to the spin order on Fe ions.Detailed investigations of bothin situhigh-pressure experiments and theoretical calculations in the HP-II phase are needed in the future to reveal the origin of this Raman mode.

Fig.4. Pressure dependence of the FWHM,area and peak height of P1.
4. Conclusion and perspectives
In conclusion, the pressure-dependent Raman spectroscopy of thin flake single crystal FePS3is measured to investigate the evolution of lattice vibration, structural phase transition and magnetic structure transition. With increasing pressure, two structural phase transitions are found: the LP phase (C2/m) FePS3first transforms to the HP-I phase(C2/m) at approximately 4 GPa distinguishing by two different pressure-dependent deformation models of the bipyramid [P2S6]4-unit, then goes to the HP-II phase (P-31m) after undergoing the two phases coexisting approximately from 10 GPa to 13 GPa. The insulator-to-metal transition accompanying a collapse of the unit cell volume is identified by the dramatic drop in Raman intensities. Moreover,by monitoring the spin-related Raman peaks,we suggest that FePS3exhibits a magnetic structure transition at approximately 2 GPa and a huge change in spin structure with the disappearance of these Raman modes at the second phase transition. Thus,our work motivates further systematic studies on 2D magneticTMPS3,which are significant for future ultrathin magnetic devices and a fundamental understanding of magnetism.
Acknowledgements
We thank Mr.Huachao Jiang from Institute of Solid State Physics,HFIPS,Chinese Academy of Sciences for his technical supports on the high pressure measurements. Project supported by the National Natural Science Foundation of China(Grant Nos. 52002372, 12004387, 51672279, 51727806,11874361,and 11774354)),Science Challenge Project(Grant No. TZ2016001), and the CASHIPS Director’s Fund (Grant No. YZJJ201705).
杂志排行

Chinese Physics B的其它文章
- Erratum to“Boundary layer flow and heat transfer of a Casson fluid past a symmetric porous wedge with surface heat flux”
- Erratum to“Accurate GW0 band gaps and their phonon-induced renormalization in solids”
- A novel method for identifying influential nodes in complex networks based on gravity model
- Voter model on adaptive networks
- A novel car-following model by sharing cooperative information transmission delayed effect under V2X environment and its additional energy consumption
- GeSn(0.524 eV)single-junction thermophotovoltaic cells based on the device transport model