Laser-induced fluorescence experimental spectroscopy and theoretical calculations of uranium monoxide
2022-05-16XiLinBai白西林XueDongZhang张雪东FuQiangZhang张富强andTimothySteimle
Xi-Lin Bai(白西林) Xue-Dong Zhang(张雪东) Fu-Qiang Zhang(张富强) and Timothy C Steimle
1School of Physics and Information Engineering,Key Laboratory of Spectral Measurement and Analysis of Shanxi Province,Shanxi Normal University,Linfen 041004,China
2School of Chemical and Material Science,Key Laboratory of Magnetic Molecules&Magnetic Information Materials of Ministry of Education,Shanxi Normal University,Linfen 041004,China
3School of Molecular Science,Arizona State University,Tempe 85287,USA
Keywords: laser-induced fluorescence,two-dimensional spectroscopy,density functional theory
1. Introduction
Nuclear power can generate large amounts of energy with low emissions to the atmosphere, making it an attractive alternative to fossil fuels.[1—4]However, it also has some drawbacks, such as long-term storage of nuclear waste and amelioration of existing waste. Uranium monoxide (UO) is an important component in nuclear energy, so the study of UO has contributed to exploring not only the solution of nuclear waste but bonding characteristics and electronic structure of actinides. UO gas-phase molecule provides the most direct experimental method to clarify the bonding properties, especially when combined with theoretical models. However,considering that the uranium element has an open f orbital, UO has many low-energy electronic states and has a strong relativistic effect.[5—7]Coupled with the experimental dangerous and expensive costs, as well as the complexity of theoretical calculations,there are still huge challenges to the research on UO both experimentally and theoretically. Laser-induced fluorescence(LIF)technology combined with density functional theory(DFT)calculation[6,8—11]happens to be a powerful technology for studying the electronic vibration and spin-orbit[12]of the target molecule.
The initial experimental report on UO spectroscopy was infrared spectra[13,14]recorded in argon and neon matrices,and the vibrational frequency was obtained. The first report on the electronic spectrum[15—18]for gas-phase UO was performed using two-color resonance-enhanced photoionization experiments. Immediately, further analysis and identification of the UO spectrum was completed by Kaledinet al.[19]The spectral constants and good quantum number,Ω′′,of the electron ground state were confirmed. The electric dipole moments, and magneticgfactors for UO were determined by measuring optical Stark and Zeeman spectra,[20]respectively.The electronic and vibrational structures of UO were investigated using high-resolution photoelectron imaging. Further,on the theoretical side,there are also discussions on the structure and spectroscopic properties of UO.However,the inaccurate research results, especially the vibrational frequency, indicate the need for careful investigation of the electronic structure and chemical bonding of UO.
In this article, the high resolution LIF spectra of U16O and U18O in the range of 16000 cm-1—19000 cm-1, using two-dimensional(2D)spectroscopy,[21—24]were recorded and rotationally analyzed.Rotation-resolved spectroscopy demonstrates that the ground state is clearly characterized asΩ′′=4.In addition to studying several electronic states previously studied, this work also discovered a new electronic state located at 18056.58 cm-1. By measuring the higher resolution dispersed fluorescence (DF)spectra, accurate low-lying electronic vibrational states, vibrational frequencies, and fluorescence branching ratios can be procured. The transition dipole moment can also be obtained by combining the fluorescence lifetime and branching ratios. Finally, the geometric configuration, bonding orbitals analysis, vibrational frequency, permanent dipole moment,and bond order were performed using high-levelab initiocalculations to provide a better understanding of the electronic structure and chemical bonding of UO.
2. Experimental and computational methods
2.1. Experimental methods
Details of the experimental setup for recording laserinduced fluorescence spectra have been described in our previous studies. An internally cold U16O and U18O molecular beams were produced using laser ablation on a rotating uranium rod in a supersonic expansion of 2% O2gas mixture seeded in helium and 1%18O2gas mixture seeded in helium at a same stagnation pressure of~2 MPa. After the UO molecular beams were excited by the pulsed dye laser, the fluorescence signals could be obtained using the two-dimensional spectroscopic technique.[21—25]In brief, the 2D spectra were built by scanning the wavelength of the pulsed dye laser and capturing the dispersed laser-induced fluorescence(DLIF)by a monochromator with a lowf-number value. The final signal was visualized using a cooled, gated, intensified charge coupling device(CCD).In this experiment, the ablation laser(355 nm,~20 mJ/pulse, 20 Hz) was focused by a planeconvex lens and then interacted with the molecular beam, a pulsed dye laser using C503, C540A, and R590 dyes was pumped by an Nd:YAG laser(355 nm,~50 mJ/pulse,20 Hz)to generate a continuously tunable wavelength region between 500 nm and 600 nm. Two digital delay pulse generators were used to control the timing sequence of the pulsed nozzle, the ablation and excitation lasers,and CCD.
In addition to recording 2D spectra,higher resolution dispersed fluorescence spectra and the lifetime measurements of the excited states can also be obtained using this experimental setup. By selecting the wavelength of the pulsed excitation laser and narrowing the entrance slit of the monochromator, higher resolution DF spectra were obtained. In general,ten thousand laser pulses are required to obtain higher resolution DLIF spectra. The relative sensitivity of the detector ICCD and the wavelength of DLIF spectra were calibrated by the blackbody radiation method and the emission of argon pen lamp, respectively. The time-resolved fluorescence spectroscopy was measured by recording the DF spectra under a gradually changing time delay of the CCD relative to the pulsed dye laser. The radiation lifetimes[26—29]of the excited states could be finally determined by fitting the time-resolved fluorescence spectroscopy.
2.2. Computational methods
In this study,we used the DFT method to calculate the geometric configuration, vibrational frequency, bond order, and permanent dipole moment of the ground state of UO.[30]In order to better understand the chemical bonding characteristics of UO, a detailed analysis was carried out from the perspectives of natural bond orbital(NBO)theory.[31—34]According to the previous DFT calculation experience, the generalized gradient approximation (GGA)[35]in conjunction with the exchange-correlation functional PBE and the Slater’s-type TZ2P basis set[36—40]can be used to obtain relatively accurate calculation results. Under the premise of not affecting the calculation accuracy, the frozen core approximation was applied to the[1s2—5d10]for U and[1s2]for O to save computational time.[41]Considering the relativistic effect,zero-order regular approximation(ZORA)and the exact two-component(X2C) relativistic hamiltonian were adopted according to the requirements of the calculation task. The accuracy of X2C is slightly higher than that of ZORA, due to major advances in the relativistic hamiltonian. Considering the amount of calculation, we only use it for the calculation of orbital components and permanent dipole moments.Among them,the scalar relativistic-ZORA(SR-ZORA)method was used in geometry optimization to deal with the scalar relativistic effect. Subsequently,based on the geometric configuration optimized by SR-ZORA,the molecular vibrational frequency was obtained by calculating the infrared spectrum of the ground state. And,the spin—orbit coupled ZORA (SO-ZORA) method was used to consider the spin—orbit coupling effect. It is worth noting that in order to obtain a more accurate electronic structure when calculating the vibrational frequency,the frozen core approximation was abandoned. Finally,on the basis of the functional and basis set unchanged,the frozen core approximation was canceled, and the SR-ZORA and X2C relativistic effects were considered to calculate the permanent dipole moments,the orbital bonding, and bond order analysis of UO through single-point energy calculations.
3. Results and discussion
3.1. Rotational analyses of the observed bands
In the experiment methods described in the preceding text, the 2D spectra were obtained by simultaneously recording the wavelength of the monochromator relative to the laser excitation wavelength. Figure 1 presents the 2D spectrum obtained by scanning the excitation laser in the range of 17500 cm-1—17700 cm-1. The horizontal axis displays the wavenumber of the excitation laser, and the vertical axis displays the wavelength of the dispersed fluorescence. The excitation spectra shown at the top of the 2D spectrum are generated by the vertical integration of a horizontal slice(marked in red). From left to right: the bands of UO at[17.521], [17.547], [17.614], and [17.654] are labeled as[18.403]5/[18.404]5(v= 1)-X(1)4(v= 1), [18.430]5(v=1)-X(1)4(v= 1), [17.614]5-X(1)4, and [17.654]5(v=1)-X(1)4, respectively. They are low-resolution LIF spectra of UO obtained by recording the off-resonance emission.The dispersed LIF spectrum displayed at the right hand side of the 2D spectrum is generated by horizontally integrating the vertical slices (marked in green). This is the low-resolution DLIF spectrum of the band near 17614 cm-1. Figure 2 presents another 2D spectrum in the range of 18020 cm-1—18220 cm-1. The excitation spectra are presented at the top of the 2D spectrum. From left to right: the bands of UO at[18.056], [18.110], and [18.136] are labeled as [18.056]3-X(1)4,[18.403]5/[18.404]5(v=1)-(2)4,and[18.430]5(v=1)-(2)4, respectively. The dispersed LIF spectrum shown at the right hand side of the 2D spectrum is the band near 18056 cm-1.
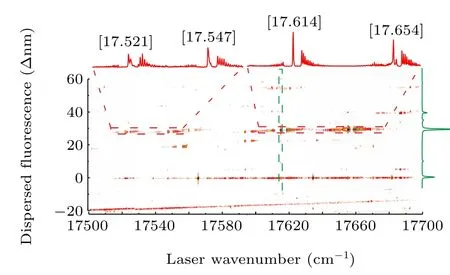
Fig. 1. The 2D spectrum of UO in the range from 17500 cm-1 to 17700 cm-1.
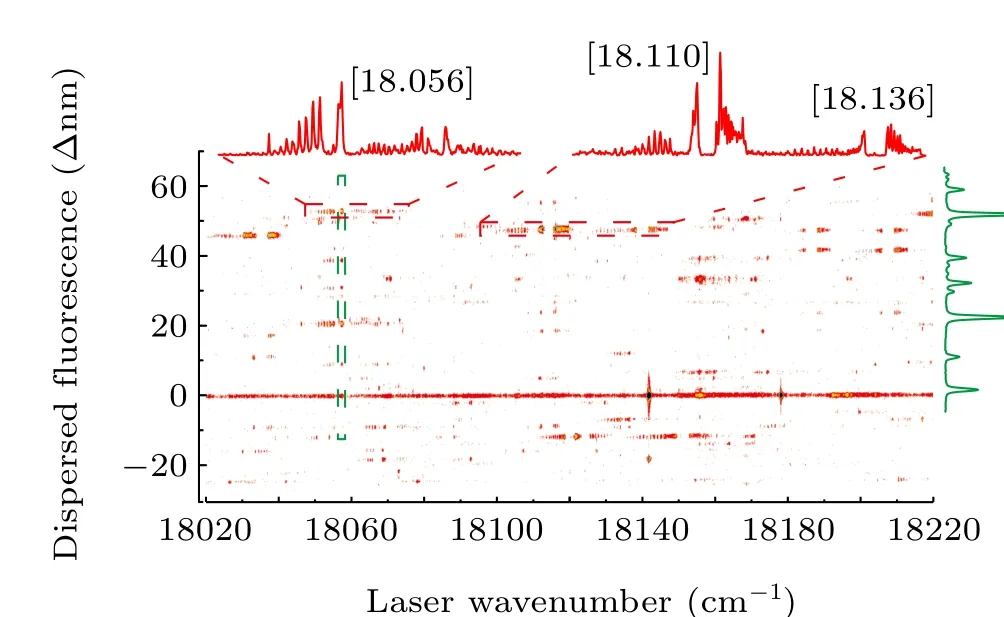
Fig. 2. The 2D spectrum of UO in the range from 18020 cm-1 to 18220 cm-1.
The experimental laser excitation spectrum band near 17614 cm-1displayed in the upper panel of Fig. 3, which is labeled as[17.614]5-X(1)4,was selected for rotational analysis. The simulated spectrum, displayed in the lower panel of Fig. 3, was fitted by using the PGOPHER program. The good resolution ofP(J)andR(J)branches allows us to assign all transitions.The simulation was completed under the conditions of a rotation temperature of 40 K,a Gaussian linewidth of 0.2 cm-1,and the assumption that the upper and lower states were Hund’s case(c)angular momentum coupling.The fitting was performed using the following simplified equation:
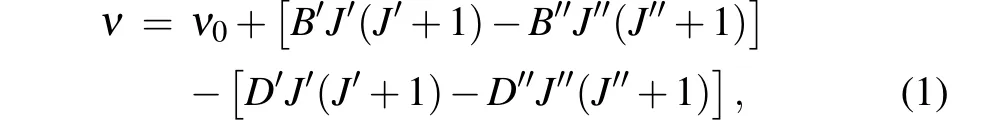
whereν0is the band origin,Bis the rotational constant, andDis the centrifugal distortion constant. Through the identification,we can see that for the strongerR(J)branch,the minimumJvalue is 4;for the weakerP(J)branch,the minimumJvalue is 6. Based on these characteristics, this band is identified as[17.614]5-X(1)4. This assignment supports evidence of the previous research by Kaledinet al.[19]The only difference is that they obtained the spectrum at high temperature,while we are at low temperature,so their rotational population is higher than our experimental results. In addition, the rotational constant of 0.33611 cm-1for the ground state through fitting is also in accord with their measurement. The quantitative molecular parameters were obtained from the fitting are listed in Table 1. Strangely,we can see that the location of thePbranch fits better, but the intensity deviation is large from Fig. 3. This phenomenon also occurs in uranium-containing compounds that we have previously studied. The main reason for the intensity difference is that we choose the main component to fit in PGOPHER fitting. However,the molecular configuration and bonding relationship of UO molecule are more complicated due to the open f and d orbitals.
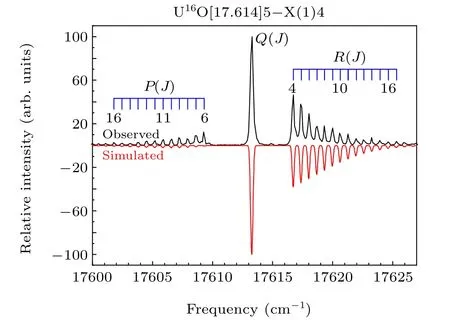
Fig.3. Rotationally resolved spectrum of the[17.614]5-X(1)4 band of UO.The upper trace is the experimental spectrum,and the lower trace is the simulated spectrum.
The high-resolution rotational spectra of the isotopomer U18O were also studied in our experiment. The isotopomer U18O band at 17632 cm-1,which is similar to the U16O band at 17614 cm-1([17.614]5-X(1)4 transition), was shown in Fig. 4. It can be seen that theRbranch is stronger than thePbranch, which conforms to the transition characteristic of ΔΩ=1. Consistent with the above identification method,the upper state of the 17632 cm-1state was marked asΩ′=5,and the lower state was marked asΩ′′= 4. The molecular rotational constant of the ground state is determined to be 0.29403 cm-1, it is in good agreement with the value determined by Kaledinet al.[19,42]The determined molecular constants for U18O bands are shown in Table 1. The U16O band at 17614 cm-1is the strongest band in the region of 17500 cm-1—17700 cm-1. For the isotopomer U18O spectrum,there are only two stronger bands in this region,namely the U18O band at 17632 cm-1and 17567 cm-1. The sharpQ(J) branches of those two bands and the similar rotational constants for upper and lower states imply that the 0—0 bands dominate the spectra. From the shape of the spectrum, the U18O band at 17632 cm-1was determined to be an isotopic companion of the U16O band at 17614 cm-1. In the absence of perturbation,the isotope shift between similar potential energy curves is very small. The large isotope shift means that there may be perturbations in the electronic state, leading to more significant changes in the UO energy level. The absence of strong vibrational progressions also supports this view in Kaledin’s research.[19]The perturbation may come from the interaction of the dark state and the bright state.
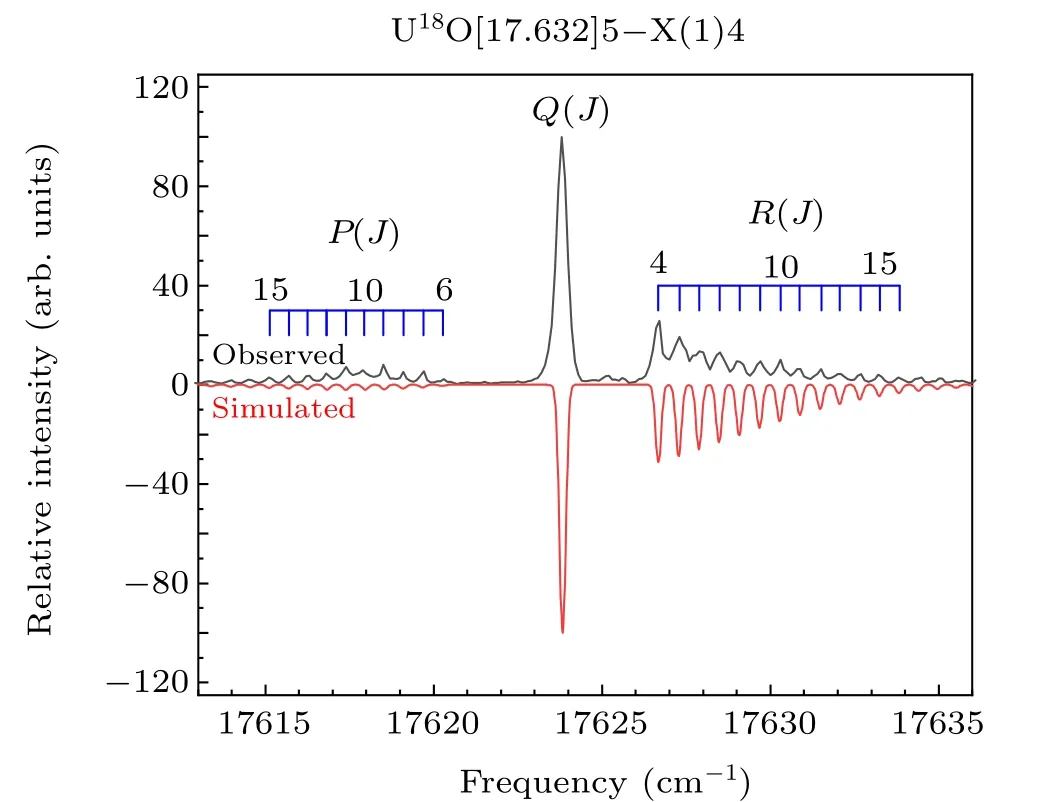
Fig. 4. Rotationally resolved spectrum of the [17.632]5-X(1)4 band of U18O. The upper trace is the experimental spectrum, and the lower trace is the simulated spectrum.
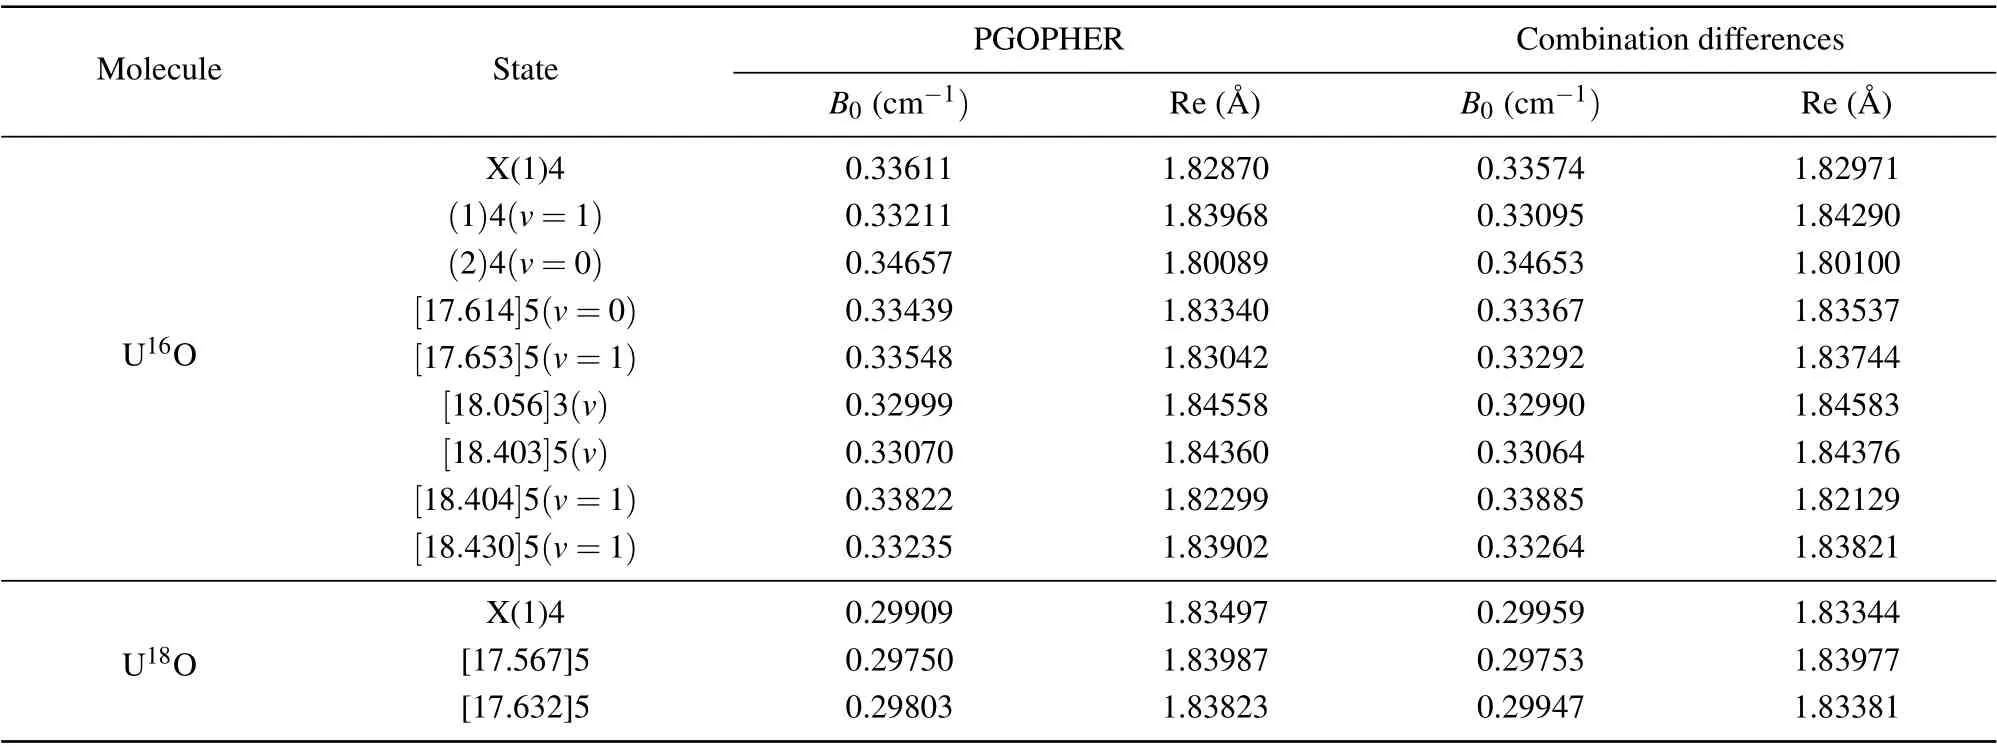
Table 1. Equilibrium molecular parameters of U16O and U18O for selected Ω states.
In the two spectral ranges of 17500 cm-1—17700 cm-1and 18020 cm-1—18220 cm-1, in addition to several transitions described above, there are several transitions of[18.403]5(v)/[18.404]5(v= 1)-X(1)4(v= 1)/(2)4(v= 0),[18.430]5(v=1)-X(1)4(v=1)/(2)4(v=0). The rotational constants obtained by fitting these bands are also listed in Table 1. It can be seen from the spectral shape that theQbranch of the corresponding spectrum in the lower state of X(1)4(v=1)is narrower than that in the state of(2)4(v=0). This is because the equilibrium internuclear distances of the upper and lower states of the former spectrum are consistent while that of the latter are different,which also indicates that the configurations of X(1)4(v=1)and(2)4(v=0)states are inconsistent. We will analyze below that these two states are derived from different electronic configurations. Compared to previous studies, a new U16O band located at 18056.58 cm-1was also discovered. Through the analysis of the high-resolution rotational spectrum, it is found that theP(J) branch of the spectrum is extremely strong, while theR(J) branch is very weak, which is in line with the transition characteristics of ΔΩ=-1. Through spectral fitting, we attribute this band to the transition of[18.056]3-X(1)4,and the rotational constant of the[18.056]3 state is 0.32999 cm-1.
Considering that there may be perturbations in the upper states, we use the combined differences method to obtain the rotational constants. This method can effectively eliminate the perturbation influence from the upper states. The differences between the lowJlines can be directly obtained by the experimental spectrum. Then the ground state rotational constantB′′can be determined by
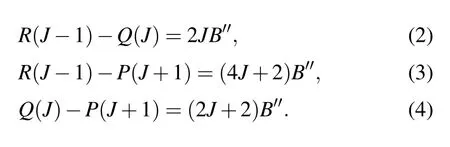
The ground state rotational constant obtained using this method is 0.33574 cm-1, which seems to be consistent with the value obtained by fitting the experimental spectrum. The band originν0and the upper state rotational constantB′also can be calculated using this method. The rotational constants of the [17.614]5 and [18.056]3 states of U16O and the[17.632]5 state of U18O are 0.33367 cm-1, 0.32990 cm-1,and 0.29947 cm-1, respectively. The rotational constants of the above three states are obtained by spectral fitting as 0.33439 cm-1, 0.32999 cm-1, and 0.29403 cm-1, respectively.The rotational constants obtained from both approaches are well matched and listed in Table 1. We speculate that the perturbation has little effect on the molecular constants of the upper state.
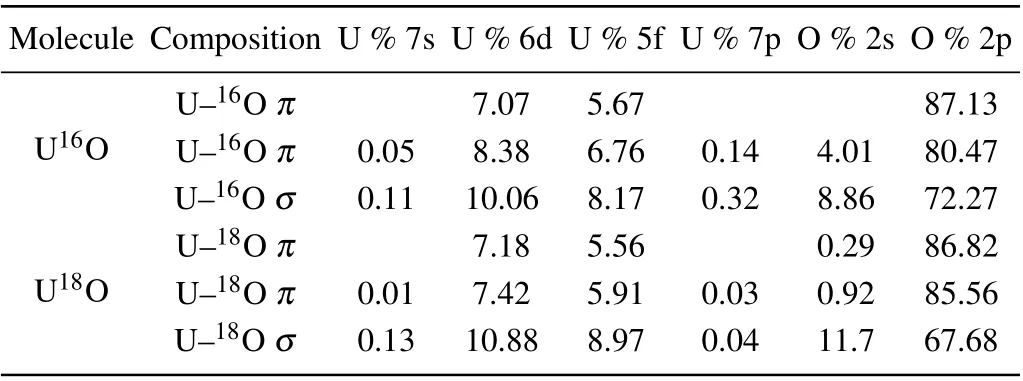
Table 2. Calculated natural bond orbital compositions of U16O and U18O based on ADF/PBE/TZ2P calculations.
To better understand the chemical bonding and electronic structures of UO, high levelab initiocalculations on the ground state for U16O and U18O were performed. The calculated equilibrium bond lengths of ground states for U16O and U18O,based on ADF/PBE/TZ2P,are both 1.847 °A,which is consistent with the calculated results by Zhouet al.[43]In the experiment,we also obtained the equilibrium bond lengths through the rotational constants,which are also identical with the calculated values.The calculated natural bond orbital compositions of U16O and U18O based on ADF/PBE/TZ2P are shown in Table 2. The results indicate there are oneσbond and twoπbonds in the UO molecule. It can be seen from Table 2 that most of the constituents of the bonding molecular orbitals are derived from the O-2p atomic orbital,and the contribution from the O-2p atomic orbital in theπ-bonded molecular orbital is as high as 87%, so the effective bond orders of UO should not reach 3. Through the calculation of the bond order, the accuracy of the above-mentioned orbital bonding analysis can be verified. For U16O,the calculated Mayer and the G—J bond orders are both near 2. The calculated G—J and Mayer bond orders are 2.400 and 2.122, respectively, which are consistent with the value of 2.37 calculated by Liet al.[30]Generally,the bond order of U16O should be equal,or approximately equal,to the bond order of U18O.For U18O,the calculated G—J and Mayer bond orders are 2.397 and 2.120,respectively. Moreover,the agreement of the bond-order calculation results also indicates that the bond length of the ground state of U16O is basically the same as that of U18O.The results are in keeping with previous experimental studies,[41]in which the ground state equilibrium bond lengths of U16O and U18O are almost identical.According to the calculated results of the natural bond orbital theory and the bond order,it is shown that the UO molecular bond has the characteristics of multiple bonds.
3.2. Low-lying electronic states
To better study the low-lying electronic states, the[18.056]3-X(1)4 band with abundant fluorescence information was analyzed. Figure 5 shows the high-resolution dispersed fluorescence spectrum obtained by exciting the Q-head in the [18.056]3-X(1)4 band. The wavelength and intensity of the DF spectrum were calibrated by argon pen lamp and black body radiation,respectively. The associated energy levels relative to ground state zero-point levels are presented and the observed dispersed fluorescence features are assigned.Using the ligand field theory (LFT) model, several low-lying electronic vibrational energy levels can be well identified. The energy of the vibration terms of the low-lying electronic states,listed in Table 3, is extracted from the high-resolution dispersed fluorescence spectrum. In order to facilitate the comparison, the previous results are also listed. The vibrational harmonic and anharmonic parametersωeandωexe, were obtained by fitting the simple harmonic oscillator equation
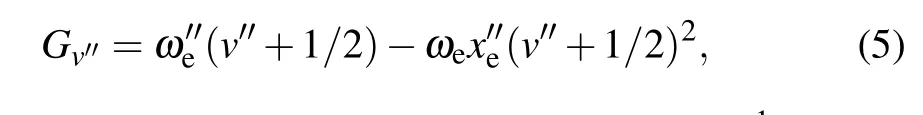
the harmonic vibrational frequencyωe=845.4 cm-1and the anharmonicity constantωexe=2.5 cm-1of U16O were determined using the method of least squares. The determined values are consistent with the values ofωe=846.5 cm-1andωexe=2.3 cm-1measured by Kaledinet al.[19]
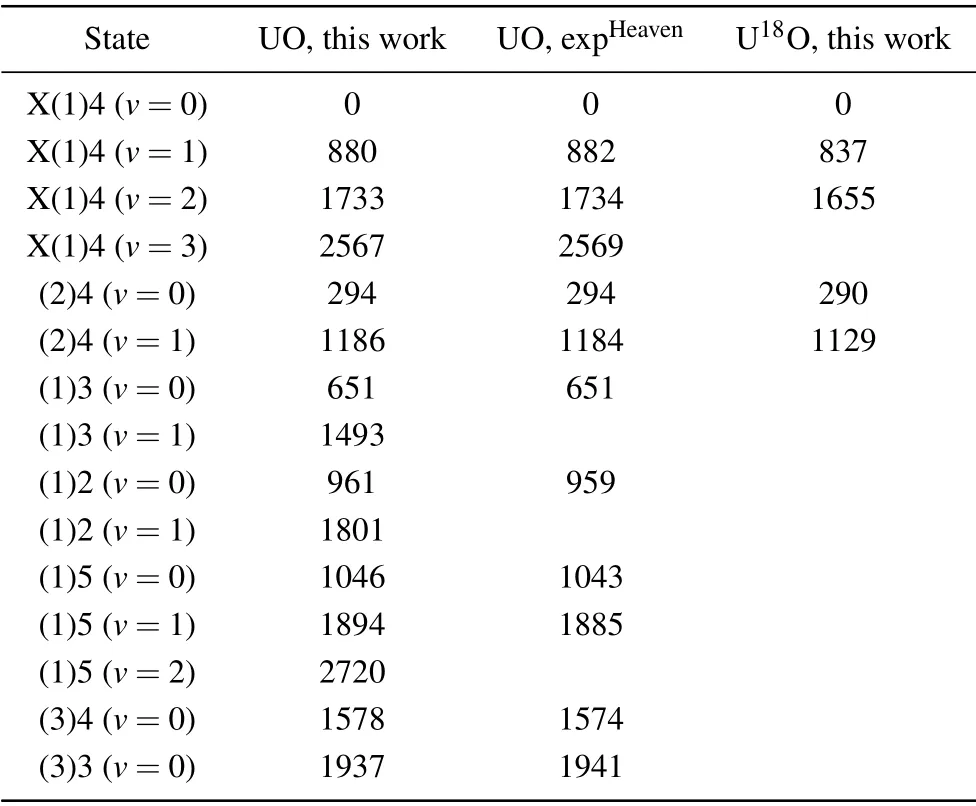
Table 3. Constants for the low-lying states of U16O and U18O (in unit cm-1).
The LFT model predicts that the states derived from the same electronic configuration will have similar vibrational frequencies and rotational constants. Previous studies demonstrated that there are two configurations (U2+(5f37s)O2-and U2+(5f27s2)O2-) in the low-lying states of UO. The rotational constant of ground state X(1)4 state for U16O is 0.33611 cm-1,and the rotational constant of the X(2)4 state is 0.34657 cm-1. The electrons on the 5f and 7s orbitals have different shielding effects, the state in the 5f37s configuration has lower vibrational frequencies and smaller rotational constants than the state in the 5f27s2configuration. As a result, the X(1)4 and X(2)4 states are derived from the configuration U2+(5f37s)O2-and configuration U2+(5f27s2)O2-,respectively. The above analysis has determined that the harmonic vibrational frequency of the ground state X(1)4 is 845.4 cm-1. However, for the X(2)4 state, only the vibrational energy levelv=0, 1 was observed, so the vibrational frequency and anharmonicity constant of this state cannot be determined. Therefore,the electronic configuration cannot be distinguished based on the vibrational frequency.
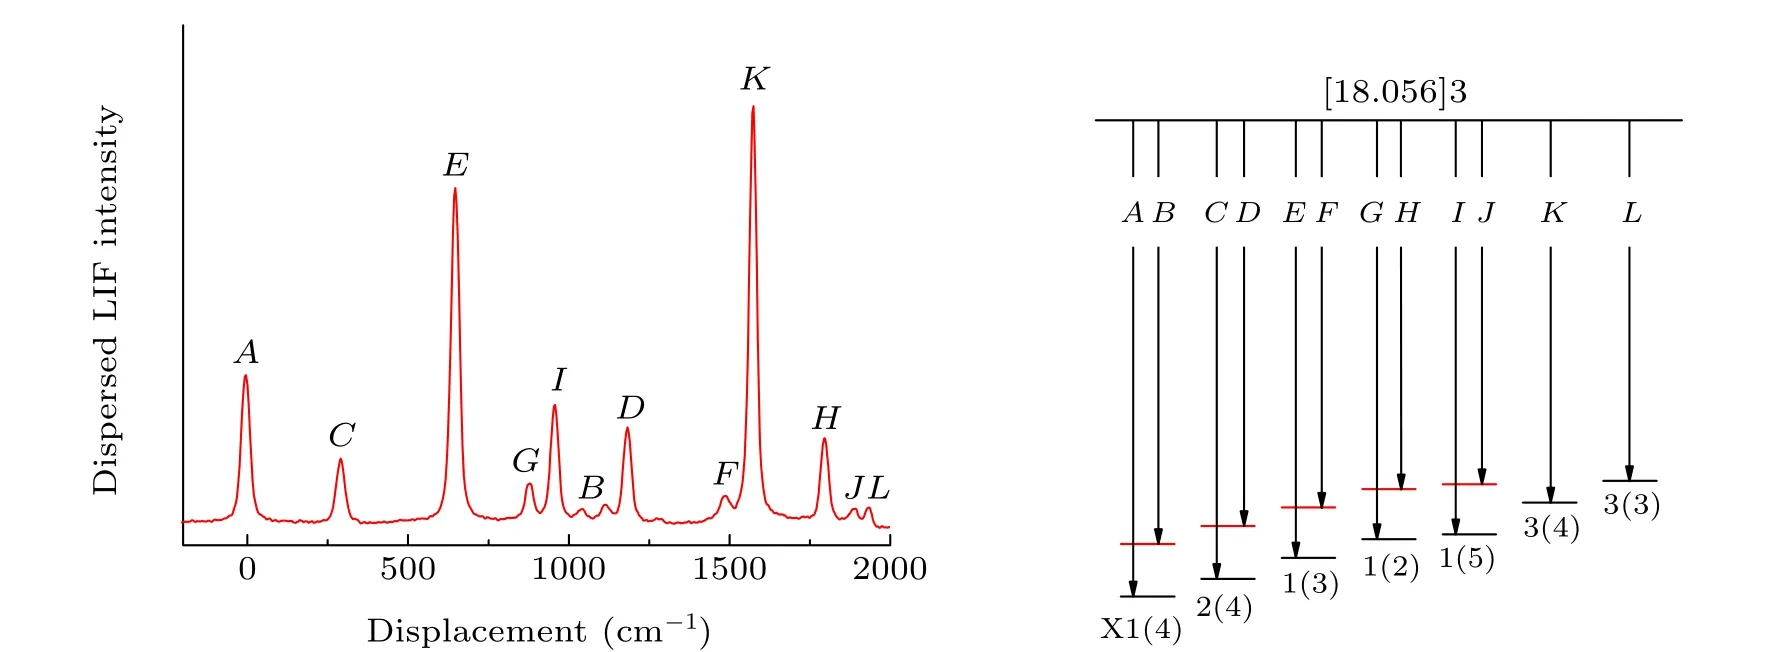
Fig.5. The dispersed fluorescence spectrum obtained by exciting the Q-branch of the[18.056]3-X(1)4(Tv =18056 cm-1)band of UO and the corresponding assignment.
It is known that the rotational constants of U16O and U18O are 0.33611 cm-1and 0.29909 cm-1,respectively,and then the equilibrium internuclear distance can be determined.The results show that the equilibrium internuclear distance is nearly equal. The calculated vibrational frequencies of U16O and U18O based on ADF/PBE/TZ2P are 850 cm-1and 804 cm-1,respectively. The calculated vibrational frequency values agree well with the estimated values by the reduced mass and the experimental data. Unfortunately, the experimental spectrum of U18O contains strong interference from U16O signal,and we have not been able to complete the analysis of the low-lying electronic states of U18O.According to the above analysis,for U18O,its ground state configuration should be U2+(5f37s)O2-,which is the same as U16O,because it has almost the same equilibrium internuclear distance.
The charge population and spin density analysis of the ground state for UO was carried out based on ADF/PBE/TZ2P, and the analysis results were shown in Table 4. The charge population results indicate that the uranium atom always loses electrons and becomes an electron donor, and the oxygen atom always gains electrons and becomes an electron acceptor. This characteristic can also be confirmed by electronegativity. The electronegativity of oxygen atom is 3.44,which is much greater than that of uranium atom, which is 1.70.Therefore,oxygen atom can easily obtain electrons from uranium atom. The charge population results indicate that there are hybrid orbitals mixing 5f,6d,and 7s orbitals of uranium with the 2p orbital of oxygen in UO molecule. Obvious orbital hybridization and orbital mixing calculation results demonstrate that the bonding strength of U—O bond is quite strong. Furthermore, the spin density results indicate that the uranium atom has a positive contribution to the total spin multiplicities of UO,while the oxygen atom has a negative contribution.
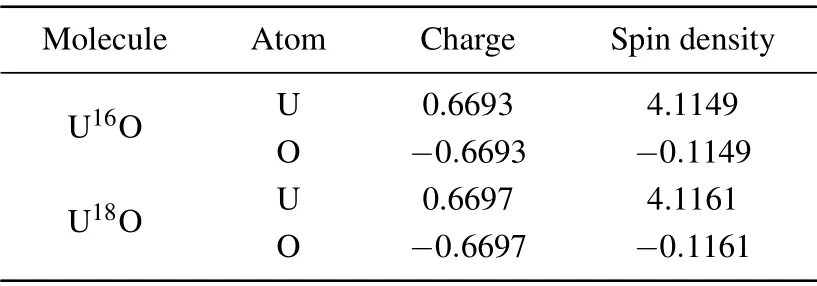
Table 4. Population properties for U16O and U18O molecules.
3.3. Radiative lifetimes and transition dipole moments
The experimentally determined radiative lifetime,τiv′,for the[18.056]3 state is 266(11)ns which was determined by fitting the time-resolved fluorescence spectrum to a single exponential function.Combined with the branching ratios obtained by the DF spectrum,the magnitude of the vibrational transition dipole moments can be calculated by

whereAiv′,fv′′is the Einstein spontaneous emission coefficient,μiv′,fv′′ is the vibronic transition dipole moment, andbiv′,fv′′is the fluorescence branching ratio. The fluorescence branch ratios can be obtained by calibrating the intensity of DF spectrum in Fig.5 and integrating the peak area,and then combining the experimentally measured radiation lifetimes to calculate the vibronic transition dipole momentsμiv′,fv′′.
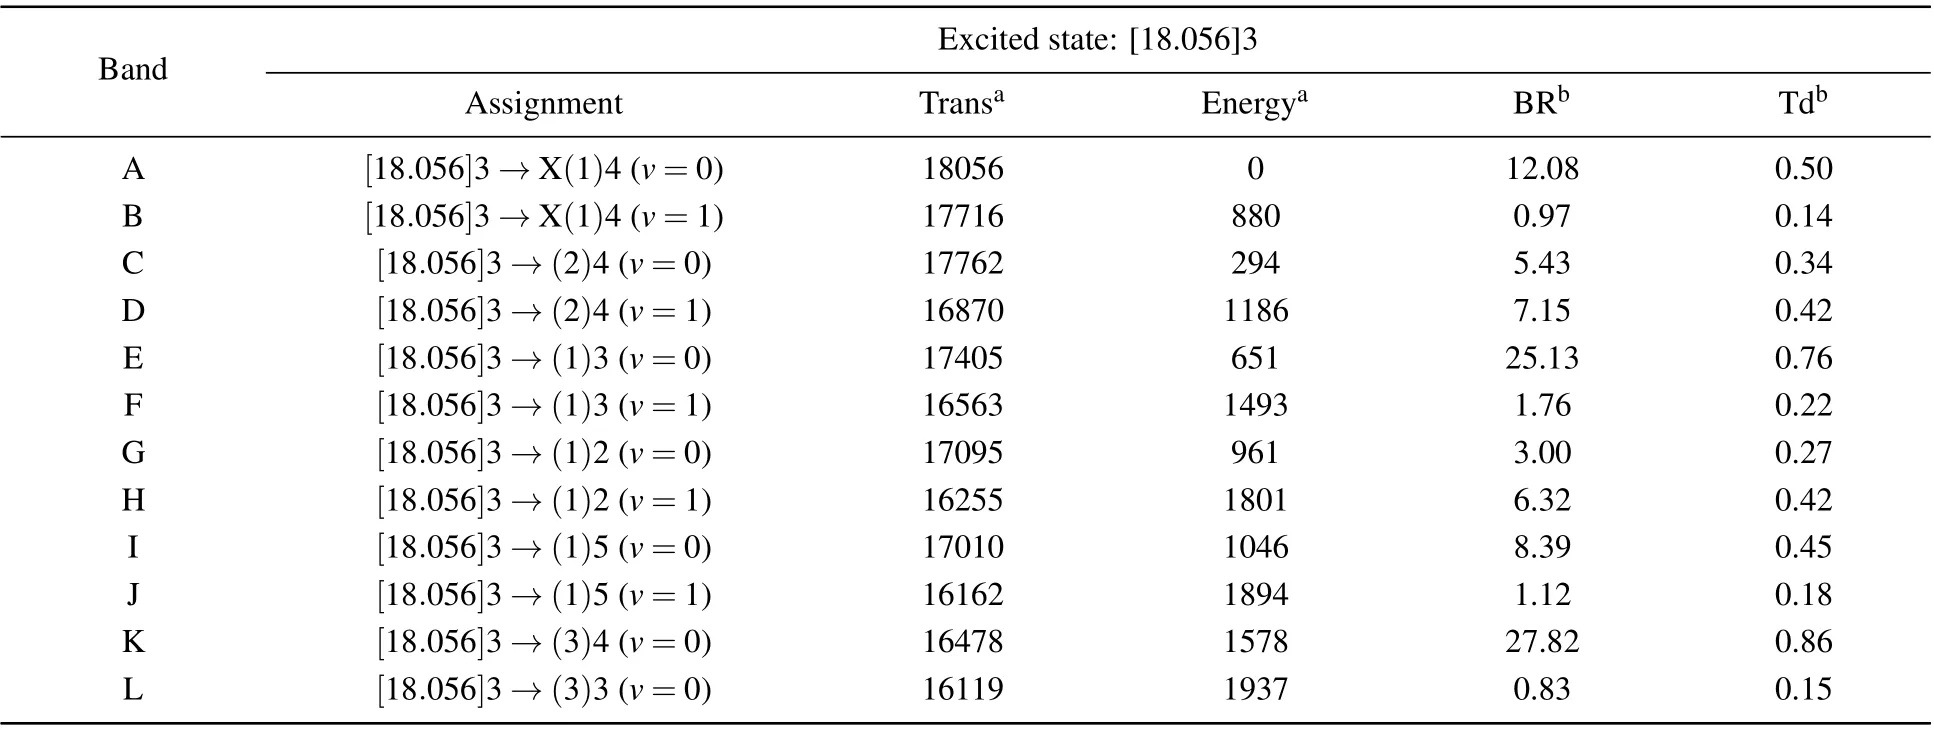
Table 5. The transition wavenumbers(in unit cm-1),energies(in unit cm-1),branching ratios(%),and vibrational transition dipole moments(in unit D)of the dispersed fluorescence spectra obtained by exciting the Q-branch of the[18.056]3-X(1)4 transition of UO.
According to the DF spectrum calibrated by intensity and wavelength, the observed transition wavenumbers, corresponding energies, fluorescence branch ratios, and the vibronic transition dipole momentsμiv′,fv′′ of the [18.056]3 state are shown in Table 5. In addition, the calculated permanent electric dipole moments of U16O and U18O at the ADF/PBE/TZ2P level are 3.365 D and 3.363 D,respectively.These findings support the result that the obtained U16O permanent electric dipole moment value was 3.363 D using Zeeman spectroscopy experiments by Heavenet al.[44]
4. Conclusion and perspectives
In conclusion, we have obtained the 2D (excitation and dispersed fluorescence) spectra of U16O and U18O and explained it using quantum-chemistry calculation. The rotational constants, equilibrium internuclear distances, electron configurations,and vibrational frequencies of the ground state of U16O have been investigated. Laser-induced dispersed fluorescence spectra of the[17.614]5-X(1)4 for U16O,[17.632]5-X(1)4 for U18O bands were studied. Many lowlying excited states have been characterized by the LFT model.Radiative lifetimes and branching ratios were measured and used to calculate the transition dipole moments. High-levelab initiocalculations explained the experimental spectra well,natural orbital analysis and bond order calculations promote a comprehensive understanding of the electronic structure and chemical bonding of UO. Our research provides accurate geometric structure and electronic structure information, which will provide benchmark support for the subsequent actinide chemical calculations.
Acknowledgments
We thank Dr. Anh T. Le (School of Molecular Sciences, Arizona State University) for her technical assistance and helpful discussion.Project supported by the National Natural Science Foundation of China(Grant No.21903050).
猜你喜欢
杂志排行

Chinese Physics B的其它文章
- Erratum to“Boundary layer flow and heat transfer of a Casson fluid past a symmetric porous wedge with surface heat flux”
- Erratum to“Accurate GW0 band gaps and their phonon-induced renormalization in solids”
- A novel method for identifying influential nodes in complex networks based on gravity model
- Voter model on adaptive networks
- A novel car-following model by sharing cooperative information transmission delayed effect under V2X environment and its additional energy consumption
- GeSn(0.524 eV)single-junction thermophotovoltaic cells based on the device transport model