Photoelectrochemical activity of ZnO:Ag/rGO photo-anodes synthesized by two-steps sol-gel method
2022-05-16BenJemiaKaryaouiWederniBardaoui
D Ben Jemia M Karyaoui M A Wederni A Bardaoui
M V Martinez-Huerta4, M Amlouk5, and R Chtourou1
1Laboratory of Nanomaterials and Renewable Energy Systems LANSER,Research and Technology Center of Energy,Borj-Cedria Science and Technology Park,BP 95,2050 Hammam-Lif,Tunisia
2Faculty of Science of Tunis,University of Tunis El Manar,Tunisia
3Laboratory of Physics of Materials and Nanomaterials Applied to the Environment(LaPhyMNE),Faculty of Sciences of Gabes,Cite´ Erriadh,University of Gabe`s,6079 Gabes,Tunisia
4lnstitute of Catalysis and Petrochemistry,CSIC,in Madrid,Spain
5Laboratory of Nanomaterials,Nanotechnology and Energy(L2NE),University of Tunis El Manar,Tunisia
Keywords: zinc oxide,reduced graphene oxide,silver doping,sol-gel,photoelectrochemical performance
1. Introduction
During the last three decades, solar energy storage has received considerable attention as an ideal solution for solving the global energy crisis and natural problems.[1,2]As a highly-efficient and eco-friendly method, photoelectrochemical(PEC)water splitting is consider to be a promising method for hydrogen production.[3]Since the first discovery of water splitting by using TiO2photo-anode by Fujshima and Honda,[4]several oxide semiconductors (such as ZnO, TiO,SrTiO, BaTiO3and SnO2) were later used as photo-anodes in PEC cells thanks to their cheap cost, easy availability and long terms durability to achieve best performances.[5,6]ZnO was studied extensively as a suitable photo-anode owing to its high electron mobility, excellent optical properties, nontoxicity and electrochemical stability.[7,8]
However, the large bandgap of ZnO limits the success.In this case, the photoactivity appears only when it is excited by UV light, which corresponds approximately to 4% of the total solar spectrum. Several strategies attempted to broaden the light-harvesting of ZnO to the visible-light region,including hetero-coupled,[9,10]organic dye sensitization,[11]and noble metal doping.[12—14]In this regard, doping ZnO by silver seems to be an efficient approach to expand the lightharvesting of ZnO to the visible-light region,through the efficient surface plasmon resonance. Numerous studies have focused on the elaboration of Ag-doped ZnO and demonstrated the beneficial impact of silver doping to develop a photoanode for water splitting. For example, Karyaouiet al.[13]found the enhancement of PEC performance of ZnO electrode after doping by Ag. Furthermore, Congrong Wanget al.[15]have prepared Ag/ZnO thin films in two steps. The resultant hybrid photoelectrode showed a remarkable improvement in photoelectrochemical performance. Recently,Dridiet al.[16]synthesized Ag-doped ZnO photo-anode using sol-gel and spin-coating techniques. They have found an optimum photocurrent response for ZnO with 3%silver doping(around 0.065 mA·cm-2).
Despite these effort,another obstacly hat may limit ZnO’s employment as a photo-anode for water splitting is the photocorrosion phenomenon derived from a competitive behavior between the oxidation of water and Zn. Nevertheless,to overcome this limitation and improve the photoelectrochemical response,ZnO was coupled with suitable low bandgap semiconductor. Among these semiconductor, two-dimensional (2D)nanomaterials such as reduced graphene oxide (rGO), black phosphorus(BP),boron, and bismuthine considered as effective electrocatalysts for water splitting.[17]Huiet al.[18]have obtained an excellent electrocatalytic oxygen evolution performance using BP/Au hybrid elaborated by the one-pot hot solution method. Similarly, recent work prepared a PECtype photodetector based on BP QDs-MoS2composites,[19]in which photoresponse performance PEC was enhanced due to the quantum confinement effect of BP QDs and its synergy with MoS2nanosheets.
Recently, graphene has attracted the attention of researchers as an effective way to raise the photoelectrochemical efficiency of photo-electrodes thanks to its unique properties like large surface area, excellent charge carriers mobility with superior electrical and mechanical properties.[20]Reduced graphene oxide was extensively associated with several semiconductors such as ZnO, owing to its excellent and efficient electron collect and transport system[8]to reduce the charge carriers’ recombination. Khanet al.[21]showed an enhancement of the PEC hydrogen production with a successful heterostructure of ZnO NW AS/rGO with a sonochemical-assisted approach. Similarly, Mina Ghorbaniet al.[22]prepared hierarchical porous ZnO/Reduced graphene oxide nanocomposites using the sol-gel method for the PEC water splitting.
Currently, few reports have dealt with the synergetic effect of Ag doping combined with rGO on the properties of the photo-anodes. Recently, Farheenet al.[20]synthesized(ZnO:Ag/rGO)nanocomposite by hydrothermal method.They reported that Ag-doped ZnO nanorods embedded rGO composite showed enhanced PEC properties and photocatalytic efficiency compared with pure ZnO.Furthermore,Mohitet al.[23]prepared Z-NRs-Ag-RGO photo-anode via two steps electrodeposition technique.The obtained sample revealed the highest photocurrent density compared to the Z-NRs and ZNRs-Ag photo-anodes.
However, using rGO as a front contact on the structure of photo-anodes based on Ag-doped ZnO was not well investigated. In this context, the present work conducted further progress in developing ZnO materials and improving the PEC performance for potential use in highly efficient solar energy conversion devices.
This work aims to synthesize Ag-doped ZnO photo-anode coated with rGO nanosheets by using two steps spin-coating technique.The synergistic effect between co-catalysts,i.e.,Ag plasmons and rGO on structure, morphological, optical and photoelectrochemical properties of ZnO thin films have been investigate.
2. Experimental details
2.1. Preparation of reduced graphene oxide
Reduced graphene oxide (rGO) was obtained from the chemical reduction of Hummer’s method[24]derived graphene oxide. First, 1 g of graphite powder and 3 g KMnO4were added to 50 mL concentrated sulfuric acid with stirring in an ice—water bath by maintaining the temperature under 10°C.After that, the solution was kept in stirring at least for 8 h.Then, the reaction was quenched to room temperature by adding 200 mL distilled water followed by 10 mL of 30%H2O2solution. A 1M of sodium hydroxide (>98%, Sigma Aldrich)solution was added to the suspension to adjust the pH at 6. To obtain rGO, 10 g of C6H8O6(99%, Sigma Aldrich)was melted in 100 mL distilled water, after that the solution was mixed with the exfoliated graphene oxide solution at room temperature, afterwards, the obtained mixture was heated at 95°C for 1 h. As-obtained black precipitates were firstly filtered by cellulose filter paper, then were washed with a 1 M hydrochloric acid solution (37%, Merck) and distilled water several times until pH=7 was achieved. At last, the filtrate was freeze-dried to obtain rGO powder.
2.2. Preparation of ZnO, ZnO:Ag and ZnO:Ag/rGO thin films
First, undoped and Ag-doped ZnO thin films were synthesized by adopting sol-gel and spin-coating techniques. ITO substrates were used for the deposition steps. In fact, before the deposition, the ITO substrates were ultrasonically cleaned for 15 min with both acetone and isopropanol, and then washed with de-ionized water. For the preparation of solution, zinc acetate dehydrate (Zn(CH3COO)-2H2O, 99.9%,Merck)was used as the precursor solution,absolute ethanol as solvent, and monoethanolamine (MEA) (NH2CH2CH2-OH,Sigma Aldrich) as a stabilize. 8.23 g of Zn (CH3COO)2-2H2O was dissolved in 50 ml of ethanol. After fixing the ratio of [MEA]/[Zn] =1, we have added 2.66 ml of MEA to the solution. The, the mixture was magnetically stirred for 2 h at 60°C. More details have been described in our previous work.[16]After that,silver nitrate(AgNO3)with a concentration percentage of 3%was added to the electrolyte solutions.The mixtures were agitated for 24 h to obtain homogenous solutions.
Second, the obtained mixtures were deposited on ITO glass substrates via the spin coating process. The speed was set at 3000 rpm for a deposition time of about 30 s. Undoped and Ag-doped ZnO solutions were dropped one time onto the substrates,then dried in the oven at 300°C for 10 min to evaporate the solvents trapped in a thin layer structure. The drop and dry processes have been repeated ten times on the same substrate. Finally,all the samples were annealed at 550°C for two hours in a programmable furnace.
Finally, to obtain ZnO:Ag/rGO thin films, an appropriate amount of rGO powder was dispersed in ethanol and sonicated for 2 h in an ultrasonic bath. The prepared solution was deposited by spin coating onto ZnO:Ag samples already synthesized(600 rpm for 1 min). At last, to tack off the solvent,the samples were dried at 100°C for 1 h in the oven.
2.3. Characterization techniques
Several characterization techniques were used to investigate the prepared sample. The crystalline structure and the type of phases were determined using x-ray diffractometer(XRD, BRUKER D8 advance mode, CuKαradiation,λ=1.541 °A) at room temperature. Raman spectrometer (RENISHAW) equipped with a 532 nm green laser was used to record Raman spectra at 5 mW output power with only 5%of the maximum power being operated. The morphology and the grains sizes were determined using a scanning electron microscopy (SEM, FEI Verios 460). The transmission electron microscopy (TEM, HRTEM JEOL2100F) analysis was conducted for studying morphology,while the elemental composition was obtained by the energy dispersive x-ray (EDX)spectrometer. A Perkin Elmer Lambda 950 spectrophotometer was used to perform the transmission measurements in the 300—900 nm domain.
Electrical properties of all samples were recorded using electrochemical impedance spectroscopy(EIS)and Mott—Schottky (M-S) controlled by a potentiostat (PGSTAT 30)computer in a three-electrode arrangement. A 0.5 M Na2SO4aqueous solution was selected as an electrolyte. EIS of the elaborated electrodes were carried out at open circuit potential(Voc)at an amplitude-frequency of 10 mV in the frequency domain from 0.1 Hz to 100 kHz, all measurements were performed in dark condition. The fitting of the collected results from EIS measurements and the equivalent circuit were obtained using ZView2 software. The M-S curves were measured in the range from-1 V to 1 V(vs. Ag/AgCl reference electrode)under a selected frequency of 1 kHz.
The photoelectrochemical (PEC) measurements of the elaborated photo-anodes were made in a quartz electrolytic cell. The Ag/AgCl electrode, the Pt plate electrode, and the sample were utilized as the reference, counter, and working electrodes, respectively, and were submerged in aqueous Na2SO 4 (0.5 M)solution. Linear sweep voltammograms as a function of applied potential (-1 V to +1 V vs. Ag/AgCl electrode) were recorded under frontal side illumination by means of a computer-controlled Potentiostat/Galvanostat PGSTAT 30(Eco Chemie BV)for all PEC experiments.AmperometricJ—tcurves were occurred out at bias voltage(0.5 V)vs.Ag/AgCl). A xenon lamp was used as a source of excitation with a 200 mW/cm2puissance. The effective area illuminated photoanode was 1 cm2.
3. Results and discussion
3.1. XRD properties
Figure 1 shows the XRD patterns of GO and rGO powders. The characteristic peak at 11.65°is referred to the(001)plane of GO. This peak disappears when the characteristic peaks of rGO powder appear at about 25.86°and 42.86°which are attributed to the (002) and (100) planes, respectively.[25]These results prove the successful formation of rGO powder by a chemical reduction process.
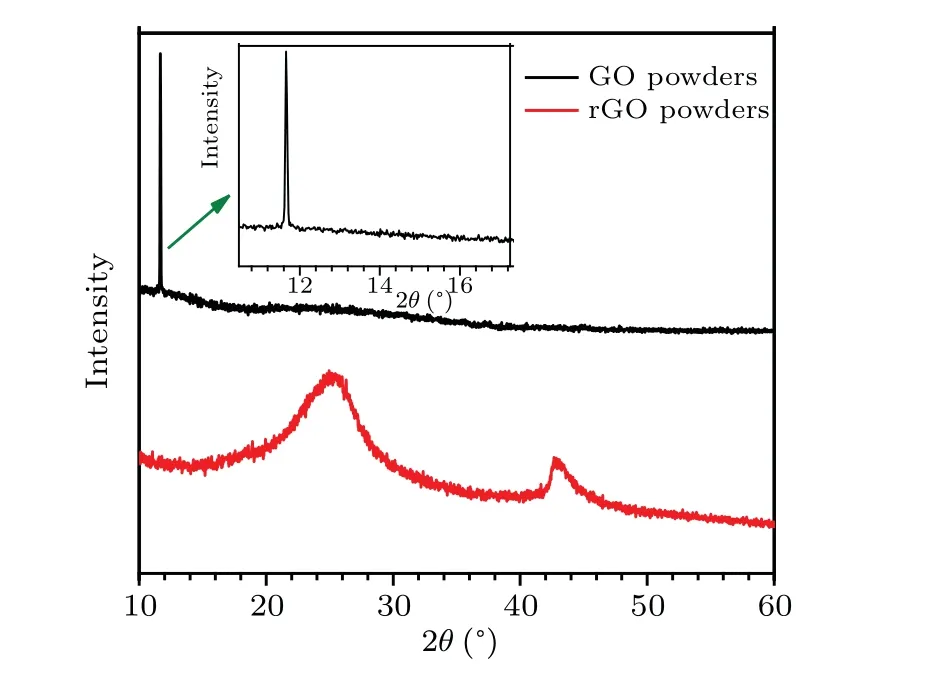
Fig.1. XRD patterns of GO and rGO powders.
XRD was employed to reach the phase structure of the prepared samples.The obtained results are displayed in Fig.2.For all patterns, the films exhibited well-defined peaks of(100), (002), (101), (102), (110), (103), and (112) planes according to a hexagonal phase wurtzite structure of ZnO with polycrystalline natures(JCPDS 036-1451).[26]It is noted that the peak at 34.38°related to the (002) plane is more intense than the other peaks indicating a favoredc-axis orientation for the crystallites. This result is familiar with those reported in the literature.[27]Also, as predicted, no secondary phases related to silver and carbon have been detected, which might be due to the successful incorporation of Ag+into the ZnO lattice.[14]Besides, the absence of peaks related to rGO indicates that the amount of rGO was below the threshold detection limit of XRD.[23]
For the sake of clarification of the implication of silver and rGO combination in the crystallinity of wurtzite ZnO thin films, a zoom in the (002) characteristic peak of ZnO is presented in Fig. 2(b). We note that for ZnO:Ag sample, the(002) preferred orientation becomes larger with a small shift to higher angles. This behavior has been explained by Tripathieet al.,[28]who related that either to the settling of Ag ions in interstitial sites into the ZnO lattice or to clusters making. On the other hand, when the sample is combined with rGO(Fig.2(b)),a slight shift of the(002)peak to a lower angle is observed. This result proves the existence of an effective interaction between rGO and ZnO nanoparticles.[29]Moreover,the diffraction peak intensity of the (002) plane is enhanced with rGO content which reveals that the crystallinity of the ZnO:Ag/rGO sample is greatly enhanced.[30]
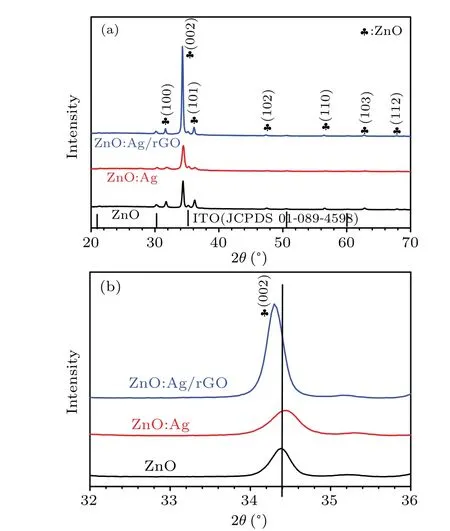
Fig.2. (a)XRD patterns of pure ZnO,ZnO:Ag,and ZnO:Ag/rGO,(b)zoom-in of the principal peak(002).
withdis the inter-planer distance and(hkl)is Miller indices.
Calculated values of lattice constants are gathered in Table 1.The parameters of undoped ZnO are consistent with that of the standard card.[33]The decrease of both lattice parameters of ZnO wurtzite structure after doping by Ag is caused by the interstitial incorporation of Ag+into ZnO lattice.[34]While, the increase of the lattice parameters in ZnO:Ag/rGO thin film might be due to the residual stress in the sample or to the lattice strain due to the existence of rGO.[35,36]On the other hand, as can be seen in Fig. 3, the sizes decreased remarkably from 24.138 nm to 20 nm after Ag doping,which is due to the restriction caused by the defects in the growth of the crystallites. A similar trend was found by Ozlem Altıntaset al.[37]After coating with rGO, the ZnO:Ag/rGO sample had the largest crystallite size with the minimum FWHM which confirms its best crystal quality compared to other samples.Similar findings were noted by Sujoyet al.[38]
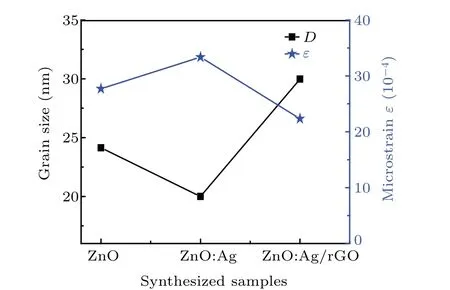
Fig. 3. Crystallite sizes and microstrains of pure ZnO, ZnO:Ag, and ZnO:Ag/rGO thin films.
The microstrain(ε),which is an important structural parameter,is given by[39]
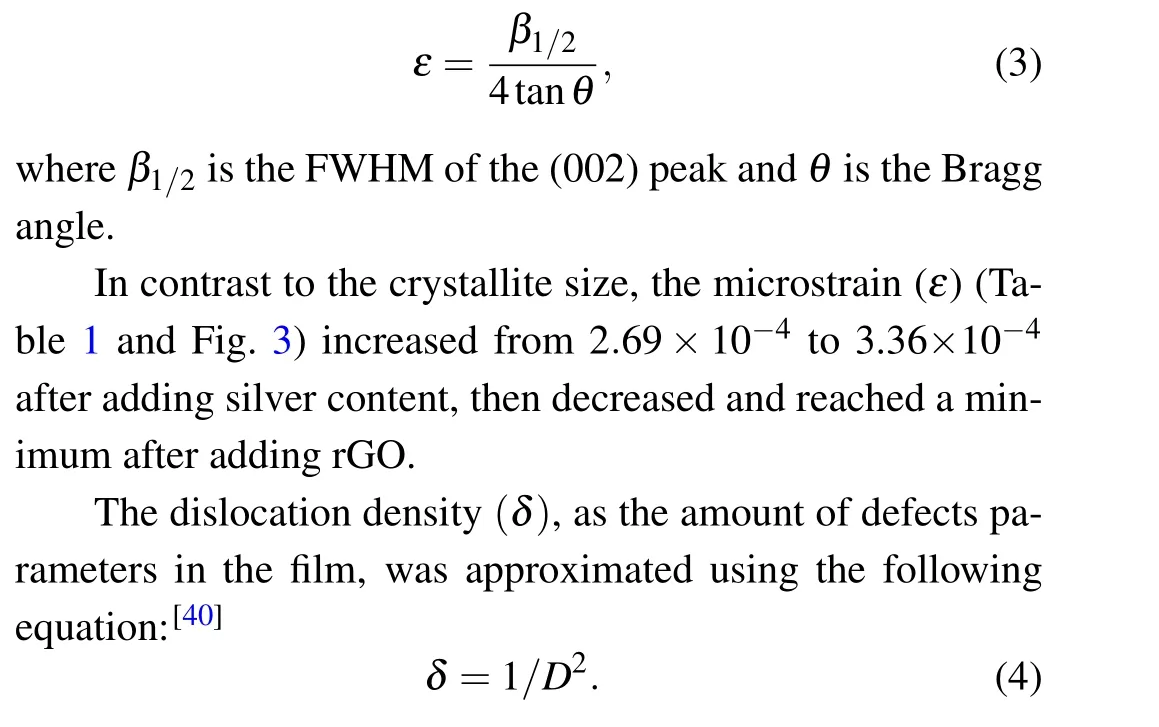
Showing the dependence of both dislocation density and grains size, the lowest value ofδ(1.12×10⁻⁴[lines/m2]) is found for ZnO:Ag/rGO thin films in comparison to ZnO:Ag and ZnO (25×10-4[lines/m2]) and (17.16×10⁻⁴[lines/m2].The obtained results confirmed that ZnO:Ag/rGO thin films have the best degree of crystallization.
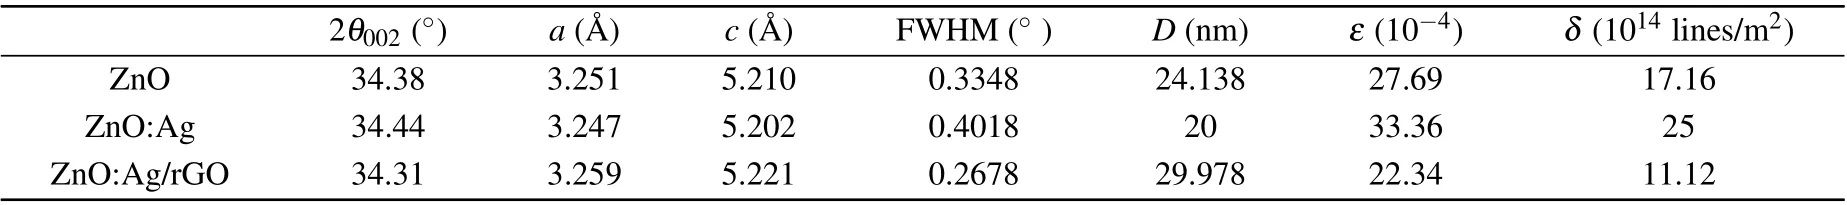
Table 1. Structural parameters of the synthesized samples.
3.2. Raman properties
To confirm the crystal structure and to analyze the compositions of the samples,Raman spectra are presented in Fig.4.It is well known that the crystal structure of ZnO is hexagonal wurtzite, belonging toC46Vpoint group symmetry andP63mcspace group symmetry. At the center of the Brillouin zone(Γpoint)wurtzite ZnO has eight sets of characteristic optical phonon modes; two A1, two E1, two E2and two B1modes.The A1, E1and E2modes are Raman active, while, the B1modes are not Raman active and are called silent modes. Raman modes of ZnO structure can be recapped using this representation

where A1and E1correspond to the symmetry modes known as the two polar phonons, such modes are divided into both longitudinal optical (LO) as well as transversal optical (TO)phonons. Whereas,E2modes are non-polar,characterized by two different frequencies: E2L(low-frequency mode) associated with Zn sub-lattice and E2H(high-frequency mode)concerning only oxygen atoms.[41]
Figure 4(a) depicts the room temperature Raman spectra of undoped ZnO samples within the range of 70 cm-1to 1800 cm-1. From this figure, we can see eight optical phonon modes assigned to the E2L, 2E2Lsecond-order phonon mode, 3(E2H—E2L) multi phonon scattering modes,E2H, A1(2LA) mode, A1(LO), 2A1(TO) second-order polar mode, and [A1(TO)+E2(TO)+E2L] multi-phonon mode.The pics at about 98 cm-1, 439 cm-1, and 578 cm-1are the fundamental phonon modes of hexagonal ZnO. Compared to undoped ZnO, the Raman spectrum of ZnO:Ag thin films (Fig. 4(b)) shows that the E2Lphonon mode has disappeared while the A1(TO)phonon mode and 2(E2H—E2L)multiphoton scattering mode has appeared at about 380 cm-1and 661 cm-1,respectively.Furthermore,a small Raman peak was appeared at about 993 cm-1when ZnO thin films were doped with silver particles. According to previous works,[42—44]the appearance of all these vibration modes proves the existence of silver atoms in the wurtzite structure of ZnO thin films.
When the Ag: ZnO thin films are covered by rGO, Raman spectra(Fig.4(c))clearly show an additional characteristic band at 1593 cm-1(G) and 1344 cm-1(D). These bands were related to the first-order scattering of the E2gphonons associated with sp2hybridized carbon,and to a breathing mode ofk-point phonons of A1gsymmetry,respectively.The ratio of D and G band intensity(ID/IG)>1, confirmed the reduction of GO by our adopted experimental method.[36]Furthermore,a Raman peak has appeared at about 275 cm-1, which might be assigned to the lattice—host intrinsic defects created by doping. Such results were observed for ZnO doped with other metal elements components such as Fe, Sb, Al, and Ga.[44]At the same time, when we compare ZnO and ZnO:Ag to ZnO:Ag/rGO curves,we can see a remarkable decrease in the intensity of E2Hmode. This trend indicates the disorder in oxygen lattice occurred after coating by rGO.[38]
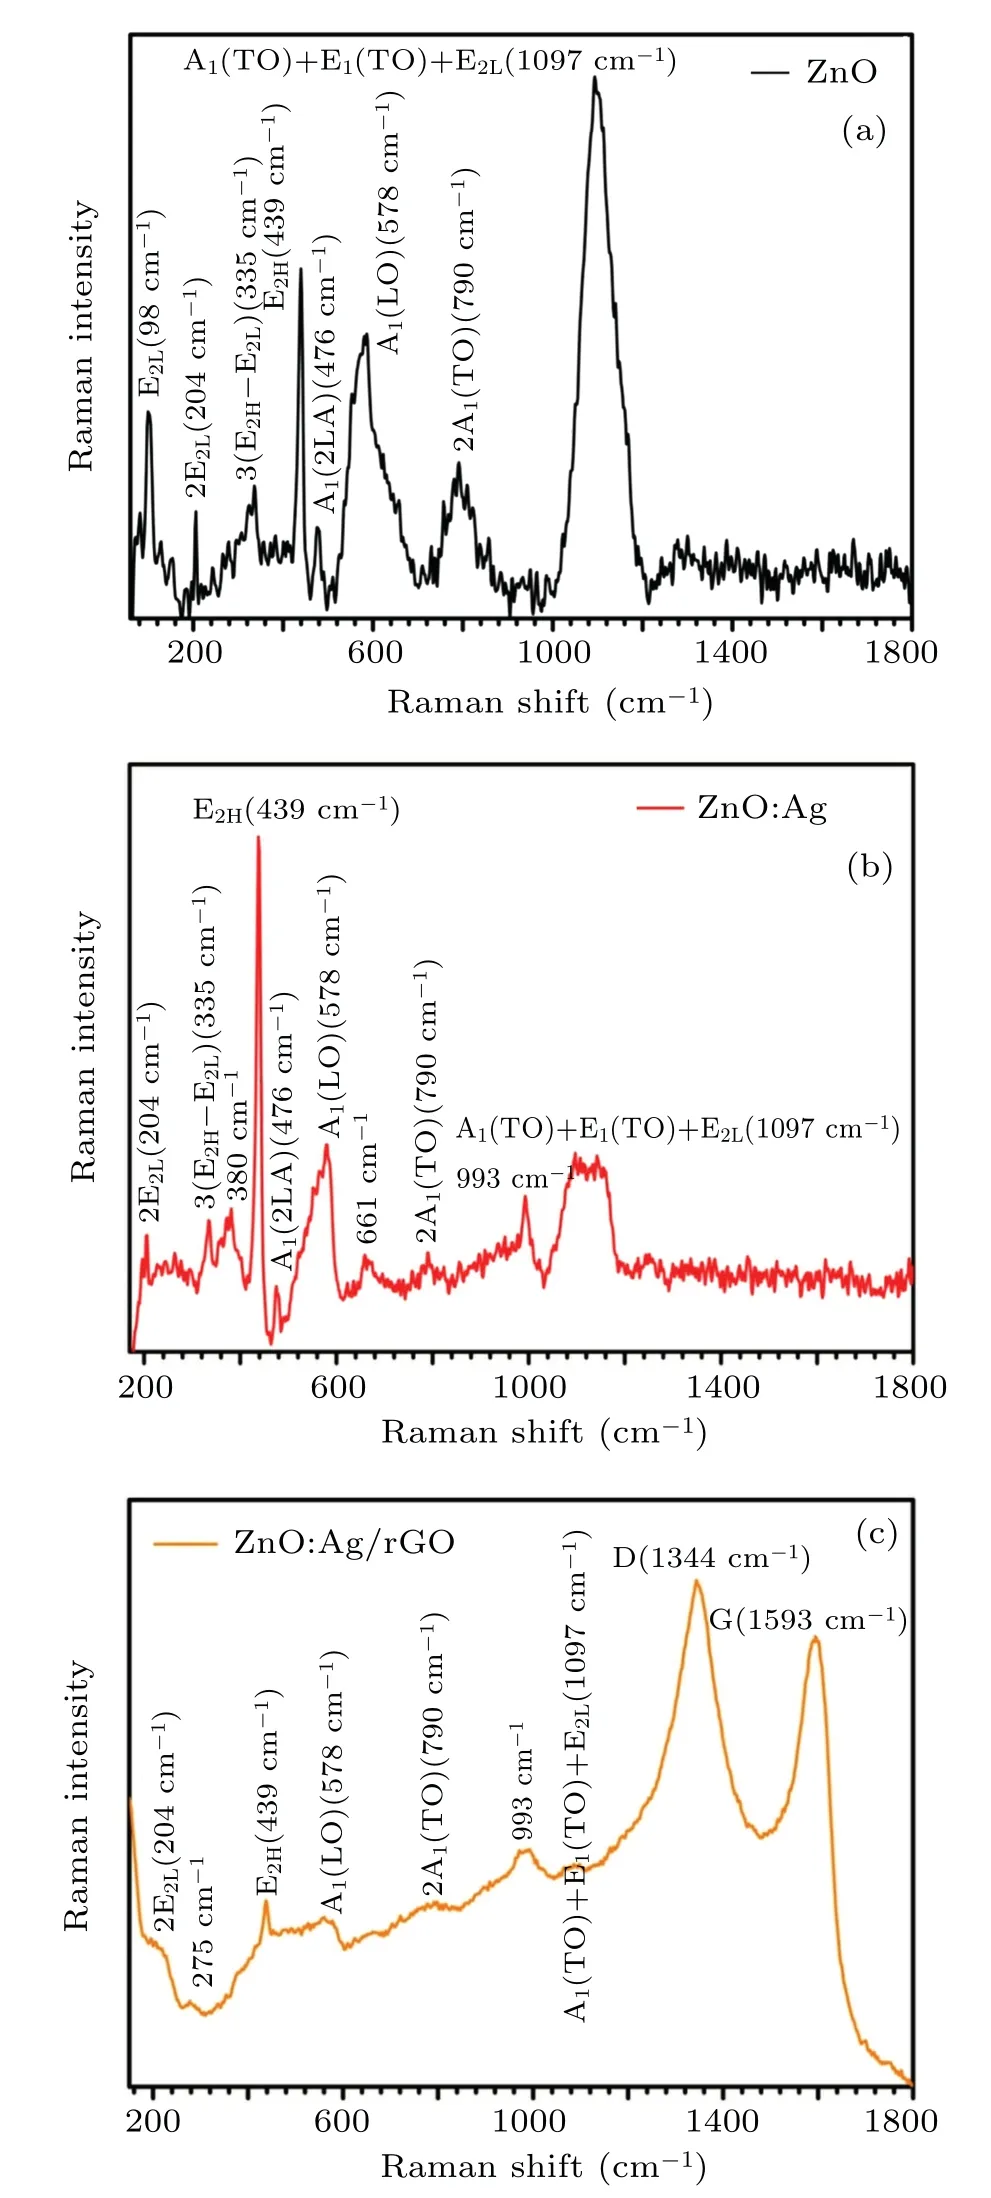
Fig.4. Raman spectra of ZnO,ZnO:Ag,and ZnO:Ag/rGO thin films.
3.3. Morphological properties
To further study the impact of doping and combining by rGO, the SEM micrographs and the particle sizes distributions of ZnO, ZnO:Ag, and ZnO:Ag/rGO are displayed in Fig. 5. From this figure, it is seen that all the compounds have a uniform morphological overall surface. This morphology shows the oval shape of the aggregate grains with finer spherical nanoparticles.Such morphology is observed in other works.[16]Image J software is used to estimate the particle sizes of all samples. From the obtained results,it can be seen that after doping ZnO thin films by silver, the particle sizes decrease from 68 nm to 47 nm. These results are persistent with those published by Ozlem Altıntaset al.[37]who demonstrated that the decrease in ZnO particle sizes after doping by Ag might be due to the nucleation sites caused by Ag clusters into the ZnO crystals.
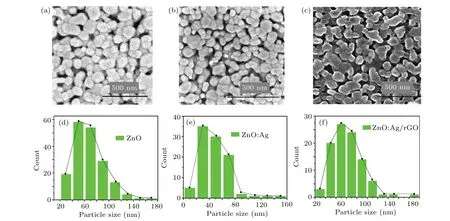
Fig.5. Typical SEM micrographs and sizes distribution of(a),(d)pure ZnO,(b),(e)ZnO:Ag,and(c),(f)ZnO:Ag/rGO,respectively.

Fig.6. TEM images and EDX spectra of(a),(d)ZnO,(b),(e)ZnO:Ag,and(c),(f)ZnO:Ag/rGO,respectively.
However,when the ZnO:Ag surface is coated by rGO,we note that the particle sizes increased remarkably from 47 nm to 82 nm. In addition,some modifications in the morphology are seen in Fig.5(c). This behavior is also obtained by Eliaset al.[24]who have elaborated rGO—Ag—ZnO nanocomposites by a calcination process at elevated temperature.Such increase in particle sizes is consistent with those estimated from XRD results and might be explained by the Van der Waals interactions on the nano-lattice crystals. It offers a driving force between Ag,ZnO nanoparticles,and rGO through the interactions with the oxygen component of rGO sheets.
To confirm this idea, TEM is used. The obtained results are displayed in Figs. 6(a)—6(c). For both undoped ZnO and ZnO:Ag thin films, we observe that the micrographs present spherical nanoparticles. However, after depositing rGO onto ZnO:Ag thin films (Fig. 6(c)), some agglomerations caused by rGO were observed, which spread on the entire surface demonstrated a powerful attachment of Ag and ZnO nanoparticles.
The elemental compositional confirmation was carried out using an energy-dispersive x-ray spectroscopy analyzer(EDX). As shown in Fig. 6(d), the characteristic peaks of zinc and oxygen elements were observed for the undoped ZnO sample.In Fig.6(e),we have noted the apparition of additional peaks attributed to the Silver. After adding rGO (Fig. 6(f)),we have noted the appearance of peaks associated with C element. These results indicated the presence of all the elements introduced during the elaboration process and confirmed the absence of any other contaminant in the synthesized samples.The same results were obtained early by Farheenet al.[20]and Ravichandranet al.[45]
3.4. Optical properties
To investigate the effect of both Ag and rGO on the optical properties of ZnO thin films,the measured transmittance spectra for all prepared samples in the 300—800 nm range are shown in Fig. 7(a). We see that undoped ZnO exhibits high transparency in the visible domain (90%), which is related to its large bandgap. After doping the sample with Ag particles,the transmittance in the visible range decreased to 63%.Such graphical variation can be attributed to grains boundary diffusion other than the absorption of visible light by surface plasmon resonance(SPR)which was sensible to the presence of Ag nanoparticles.[15,23,46,47]Besides,the noted red-shift for ZnO:Ag sample can be attributed to the SPR of the silver.
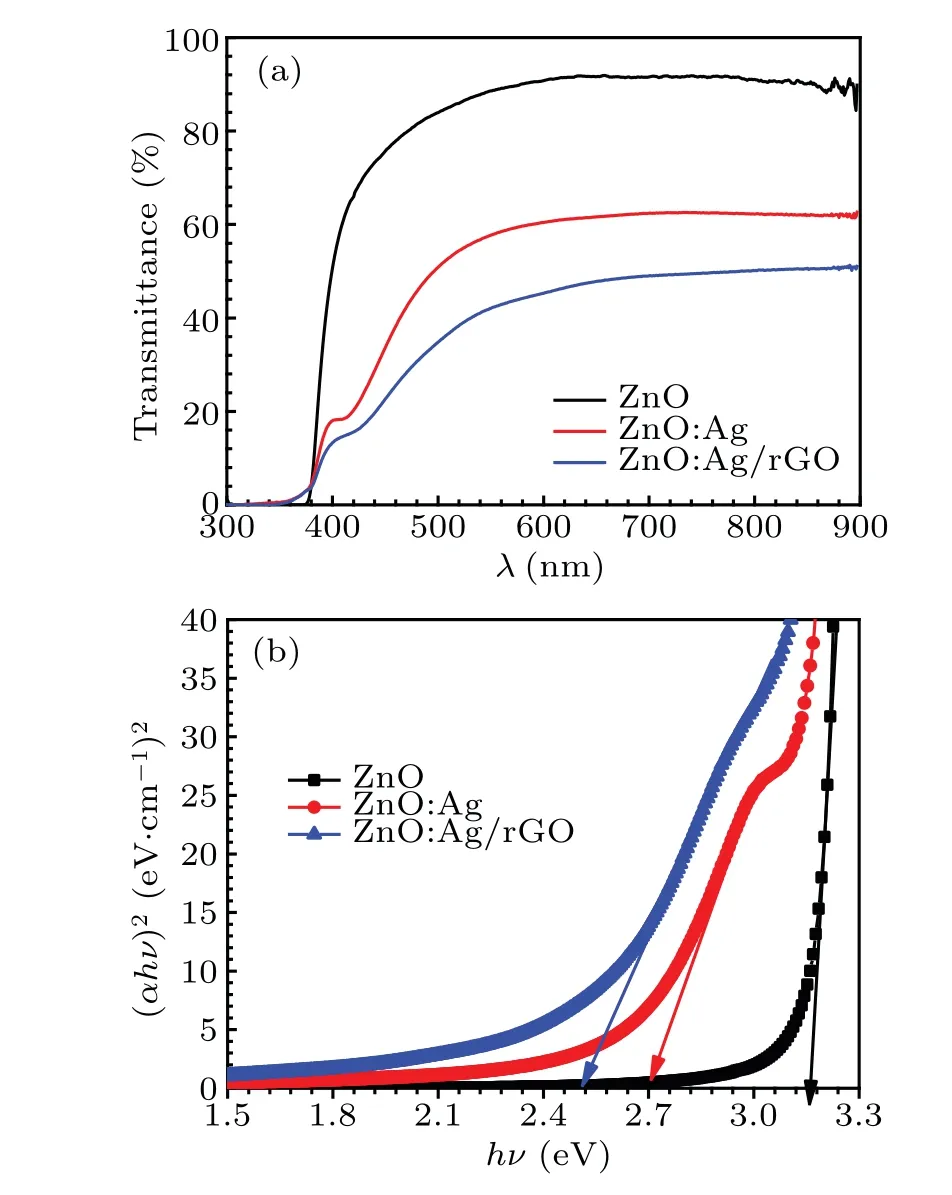
Fig.7. (a)Optical transmission spectra of ZnO,ZnO:Ag,and ZnO:Ag/rGO,(b)Tauc plots of all synthesized samples.
On the other hand, comparing the transmittance spectra of ZnO:Ag/rGO to the selected undoped ZnO thin films, we observe a remarkable reduction in the intensity(from 90%to 50%) and a continuous shift of the absorption edge toward higher wavelength. This behavior was interpreted by Mohitet al.[23]as follow;the unpairedπelectrons on rGO can bond with surface Zn atoms of ZnO to form Zn—C bonding. In consequence, the light absorption range of ZnO extended indicated a decrease in the bandgap value.[48]
From the acquired experimental results of the transmittance values in the studied wavelength range, we can deduce the estimated values of optical band gap energy(Eg)of all the samples. The absorption coefficient can be provided by the following equation:[14]
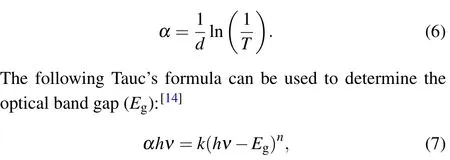
whereαis the absorption coefficient,kis constant,his the Planck’s constant,νis the photon frequency,Egis the optical band gap andnis the 1/2 for direct band.
We have plotted the evolution of (αhν)2vs. (hν) for all the samples in Fig. 7(b). The linear extrapolation at the absorption edge to (αhν)2=0 gives the estimated bandgap energy. The obtainedEgvalues are 3.265 eV, 3.244 eV,and 3.207 eV which are associated with ZnO, ZnO:Ag, and ZnO:Ag/rGO, respectively. These results showed thatEgreached the lowest value after both the inclusion of Ag particles and rGO.Such results confirmed also the observed shifts of the edge absorption discussed above. Similar results were obtained by Mohitet al.,[23]who found that the integration of Ag and rGO together reduces theEgvalue of ZnO from 3.19 eV to 2.9 eV.Furthermore,our values are consistent with those reported by Divyaet al.,[49]who have found that theEgof ZnO decreases from 3.14 eV to 2.62 eV,which is attributed to the synergetic interaction with Ag and rGO contents.
3.5. Electrochemical impedance spectroscopy analysis
To understand the effect of both doping by silver and coating by rGO on the charge transport process at the ZnO electrode, the electrochemical impedance spectroscopy (EIS)method was used. Figures 8(a) and 8(b) illustrate the typical impedance spectra (Nyquist and bode plots) collected for an AC frequency varying from 0.1 Hz to 100 kHz. As can be observed from Fig.8(a),the Nyquist plots of all electrodes feature only one semicircle curve which is characteristic of the electron transfer process at the contact interface between electrode and electrolyte solution. From this figure,it is noted also a remarkable decrease in the diameter of the semicircle with the existence of silver element and rGO. This behavior may be ascribed to a kinetic barrier of the electron transfer,which leads to the observed decrease in the electron transfer resistance. In turn,this produces a considerable perturbation of the interfacial electron transfer at the electrode surface.[50]
It is well known that such results permit to model the electrical processes occurring within the interface junction electrode/electrolyte in terms of a Randles equivalent circuit simulation using the Zview2. For all the compounds, the contribution of the two electro-active regions of the Nyquist plots is schematized separately by simple theoretical modeling of the obtained data into an equivalent circuit as shown in the inset of Fig. 8(a). The associated equivalent circuit is formed by two series-connected combinations; the first is formed by an ohmic resistance of the electrolyte (Rs), whereas the second consists of a combination of a charge transfer resistance(Rct)and a constant phase element (CPE), connected in parallel.The noted depression in the center of the semicircles below the real axis proves the non-Debye nature of the studied samples,and therefore the capacitive elements are replaced by a constant phase element(CPE).[51]The latter is generally defined by an admittanceY(CPE)through the following equation:[52]

withA=A0cos(απ/2)andB=A0sin(απ/2),whereA0andαare temperature dependent but frequency independent parameters.A0determines the magnitude of the occurred dispersion, and 0<α <1 (for an ideal capacitorα=1 and for an ideal resistorα=0).
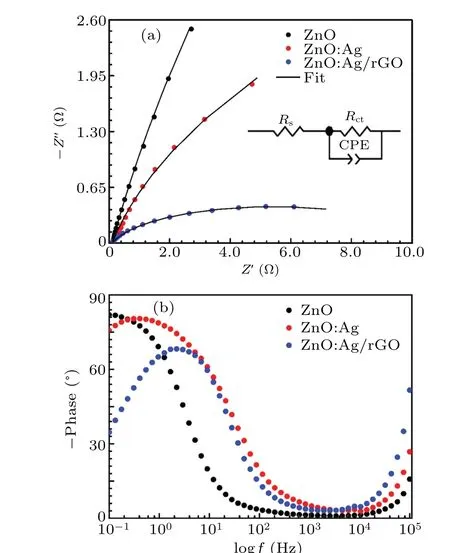
Fig. 8. (a) Nyquist plots in which solid lines are calculated using the values in Table 2. The inset shows the electrical equivalent circuit. (b)Phase impedance curves of all synthesized samples.
The observed trends have also been reported in the literature for other compounds.[5,54]In all case, we have found a close agreement between the experimental and fitted data(solid black line) with an estimated standard deviation of the parameters less than 6%. As the elements which compose the electrical equivalent circuit (EEC) have a physical meaning,we can conclude that such EEC constitutes an appropriate and precise mode. The values ofR,Rct,and CPE have been determined from the equivalent circuit model.The estimated values are gathered in Table 2, in which we find an almost constant value of the electrolyte resistance(Rs)around 105 Ω. This table reveals also that both values of charge transfer resistance(Rct)and constant phase element(CPE)are changed by adding silver element and rGO sheets, and which is manifested by a clear decrease in the diameter of the semi-circle constituting the Nyquist diagram. This trend can be attributed essentially to that when ZnO was doped with Ag and covered by rGO,Rct decreased from 1001 Ω to 10.61 Ω and conversely, CPE increased from 552 μF to 669 μF.
As already stated, these variations may be interpreted through an easy and rapid charge transfer at the interface of the electrode ZnO:Ag/rGO. The acquired results were consistent with some others data published earlier. Farheenet al.[20]showed that both Ag and rGO contents can improve the charge transfer efficiency of ZnO nanocrystalline, which has been elaborated by the hydrothermal method.In the same context,our team has demonstrated that doping ZnO thin film by 3%of Ag can facilitate the electronic transfer at the interface electrode/electrolyte.[16]In addition, Swe Jyan Tehet al.[33]obtained rGO hybridized ZnO thin films using the electrodeposition technique. They have found that bases of based on the EIS results, the adding of rGO as a front contact reduced considerably the charge transfer resistance of a semiconductor thin film.
Regarding the bode diagram (Fig. 8(b)), the attitude of electron transfer can be observed through phase angle versus log frequency plots. For the selected frequency range,we note the appearance of a single-phase angle peak which has a high magnitude value at the frequency range of 10—100 Hz. Such graphical variation reveals a capacitive behavior in this corresponding range. It is well known that for an ideal capacitive electrode, the phase angle at the low-frequency region is closer to 90°, whereas, it shifts towards 45°in the case of pseudo-capacitance electrode.[55]In our case, the phase angle level was found to decrease from 80°to 68°suggesting the combined contribution of ideal capacitance and pseudocapacitance. According to Bhavana Rikhariet al.[56]the observed decrease in the magnitude of the Bode phase angle can be attributed to the increase of ionic conductivity between electrolyte and electrode interface. Furthermore, the small sloping on the right side of the bode phase plot is attributed to the charge transfer process at the platinum counter electrode/electrolyte interface.[33]
The Mott—Schottky measurement gives essential information about the physical and electrical properties of all samples especially; the type of semiconductor, the flat band potential(Vfb),and the charge carriers density(Nd).
The M-S plots (1/C2vs.V) of ZnO, ZnO:Ag, and ZnO:Ag/rGO thin films were recorded in 0.5 M Na2SO4electrolyte (pH=7). We can deduce the conduction type,flat band potential and donor density from the Mott—Schottky theory given by the following equation (for n-type semiconductor):[57]
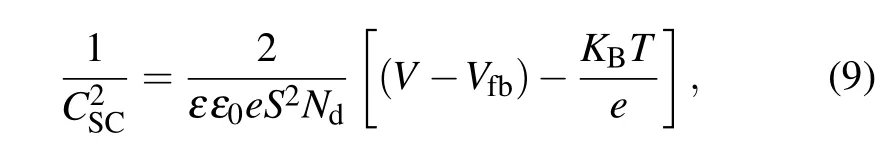
whereeis the electron charge,Ndrepresents the donor density for the n-type semiconductor,εstands for the dielectric of the ZnO (ZnO =10),ε0denotes the vacuum permittivity(8.85×10⁻¹⁴F·cm-1),Sis the electrode surface area in contact with the electrolyte (1 cm2),KB,T, andVfbrepresenting the Boltzmann constant (1.38×10⁻²³J·K-1), absolute temperature and flat band potential which reflects the Fermi level of semiconductor (V), respectively. The termKBT/ecan be neglected at room temperature.[58]
As seen in Fig.9,the M-S curves of all films exhibit positive slopes indicating n-type nature which is coherent with previous works.[23,59]
The calculated values ofVfbandNdare gathered in Table 2. It is obvious that the donor density is enhanced in the photo-anode with Ag doping, then it reaches the highest value of 20.26×1019cm-3after coating by rGO. The increase in charge carrier density of ZnO:Ag/rGO photo-anode is confirmed by the impedance spectroscopy study discussed above regarding the efficient charge separation/transpor. As indicated in Table 2, the flat band potential (Vfb) decreased from 0.19 V to 0.085 V versus Ag/AgCl after doping by Ag which indicates a reduction in the bending of band edges.[23]While shifting to negative values of theVfb,ZnO:Ag/rGO thin films proved the good potential of the photo-anode to facilitate the charge separation in the PEC response.[59]The calculated carrier densities of our samples fall at the same range as those obtained by Mohitet al.,[23]which were around 1018cm-3for Z-NRs and Z-NRs-Ag samples and 1019cm-3for Z-NRs-AgrGO sample.
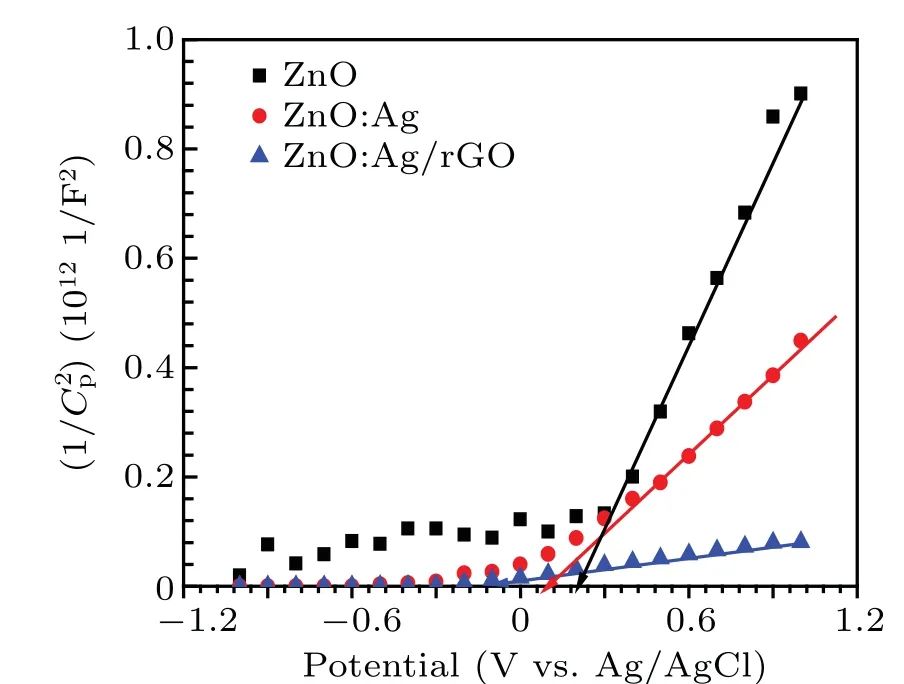
Fig. 9. Mott—Schottky curves (1/C2 vs. V) of ZnO, ZnO:Ag, and ZnO:Ag/rGO thin films.
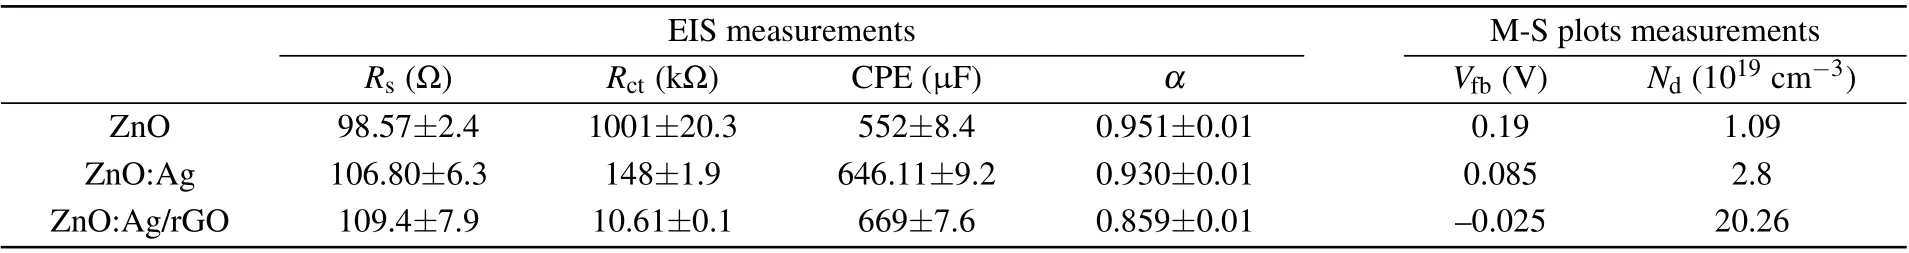
Table 2. Equivalent circuit parameters and Mott—Schottky parameters of ZnO,ZnO:Ag and ZnO:Ag/rGO samples.
3.6. Photoelectrochemical performance
The photocurrent response is beneficial for estimating the separation efficiency of photogenerated exciton. Figure 10 shows the typical curves of current density(J)as a function of the applied potential (V) for ZnO, ZnO:Ag, ZnO:Ag/rGO in the dark(Fig.10(a))and under xenon lamp illumination measured in 0.5 M Na2SO4aqueous solution(pH=7)(Fig.10(b)).The applied potential was between-1 V and 1 V vs.Ag/AgC.In the dark,the generated cathodic current(reduction current)for all the photo-anodes confirmed the n type of the semiconductors in all cases. In addition, when ZnO was doped with silver(Ag: ZnO and ZnO:Ag/rGO,the spectral response indicated that there was some dark anodic current(at the potential among 0.1 V and 0.3 V vs. Ag/AgCl. This behavior can be attributed to the presence of such surface states modifications which can be induced by the oxidation of silver in this range of potential.[34,60]
Under illumination,we observe that the photocurrent density increased in the anodic region(positive photocurrent)for all the studied samples. Moreover, we have found a considerable variation particularly in term of short circuit current(Jsc). In fact, after doping ZnO thin films with Ag element,we have observed an increase in the short-circuit current from 0.032 mA/cm2to 0.048 mA/cm2, the, it increases more and reaches a maximum value ofJscat 0.12 mA/cm2when we incorporate rGO.Generally, the photo-induced charge carrier separation provokes the improvement of the photocurrent response. In this sense,there are many works related to the enhancement of the photocurrent efficiency of ZnO thin films via the doping process by some amount of metal transition(such as A,F,Ni,and Pd)to the intrinsic structure of Zn.[46,61]Moreover, many other works demonstrated that the photoelectrochemical properties can be enriched through the deposition of rGO onto ZnO thin films.[22,23,33,62,63]Graphene is an appropriate acceptor candidate owing to its unique twodimensionalπ-conjugation structure which has contributed to a rapid transport of photo-induced charge carriers from ZnO into rGO sheets through a percolation mechanism. Consequently,the combination of doping by Ag and coating by rGO as a front contact reduced considerably the recombination of electron-hole pairs and enhanced the PEC response.
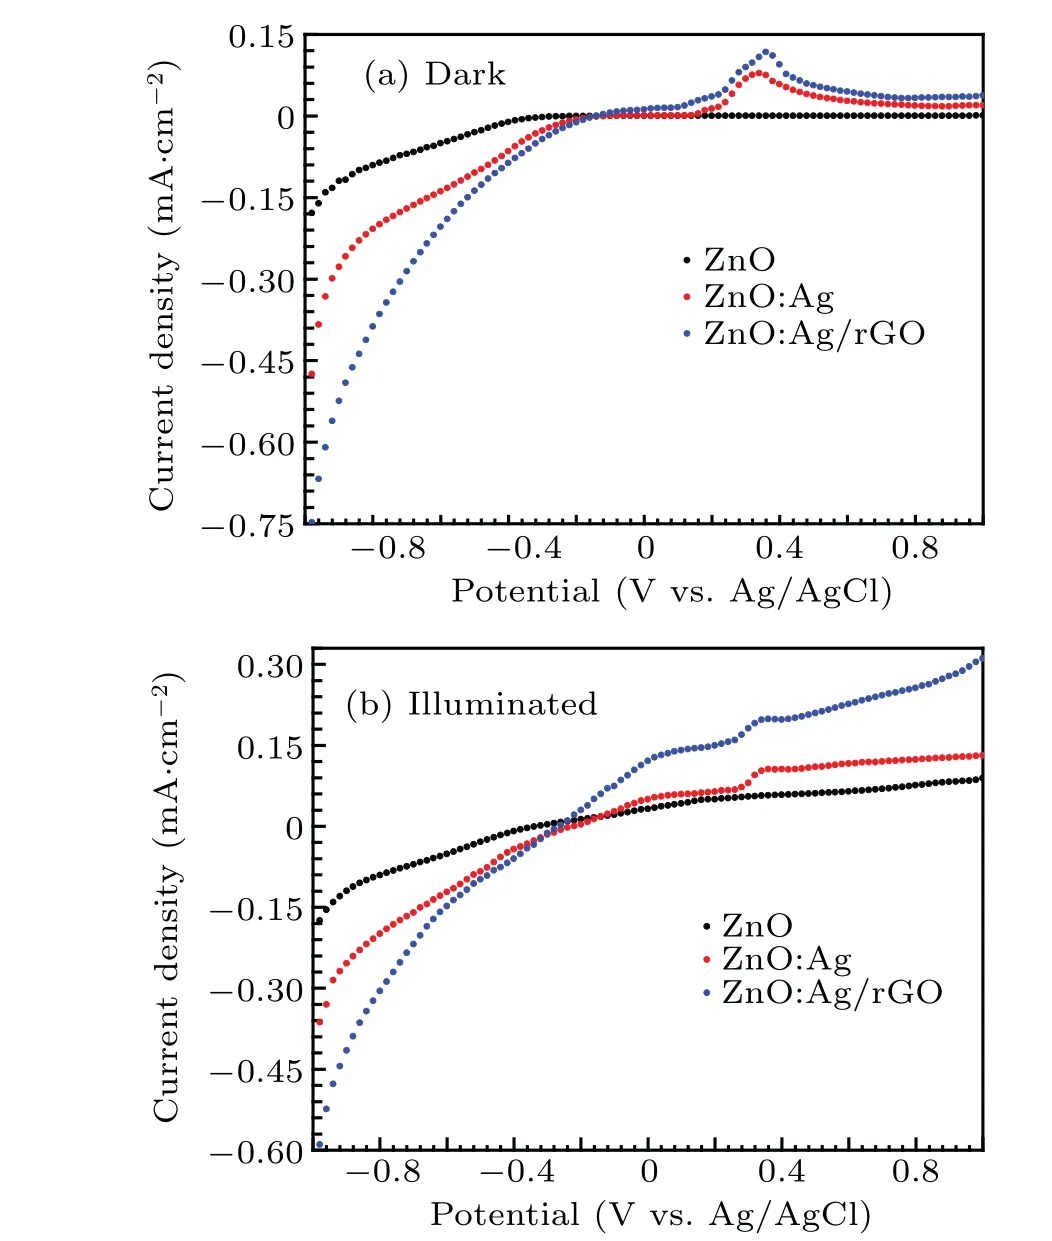
Fig. 10. Linear sweep voltammograms of pure ZnO, ZnO:Ag, and ZnO:Ag/rGO in(a)the dark and(b)under illumination.
To explore the reproducibility of the photo-response for all electrodes and the resistance of the device toward the oxidation, potentiostatic measurements (current vs. time (J—t))were carried out using ON/OFF cycles for a total duration of 300 s by applying 0.5 V vs. Ag/AgCl reference electrode.From Fig. 11, a clear change can be seen in the current after illumination for all the photo-anodes. It is also noted that when the light is turned off,the current falls back to its initial value. The predicted results prove the stability of all devices and denote that excitons were immediately generated then separated in the ZnO thin films. Furthermore,it is found that the photocurrent density generated by ZnO:Ag/rGO as a photoanode reached 0.2 mA·cm-2. This value is four times greater than that measured for pure ZnO (0.05 mA·cm-2) and two times for the ZnO:Ag thin film(0.09 mA·cm-2). These findings confirm once again that the photo-conversion efficiency of ZnO:Ag is more enhanced after coating by rGO,which leads to an enhancement in the n-type conductivity and also the photocurrent density of the photo-anodes.[8,22,23,63]
Recently,the impact of layer ordering on the charge transfer properties for the photo-electrochemical activity was examined by Swe Jyan Tehet al.[33]for an rGO-hybridized ZnO sandwich thin films structure synthesized by electrodeposition process (using layer by layer approach). According to this study, the highest PEC performance (0.34 mA/cm2) was observed when the rGO was used as front contact for ZnO and which results from the formation of n—p hetero-junctions,this indicates that graphene edges can play a significant role as heterogeneous electrolysis of water.Thus,rGO acts as an electron acceptor which accelerates the oxidation of water molecules to O2.
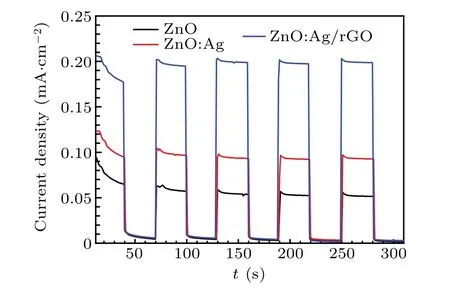
Fig. 11. Amperometric J—t curves of elaborated samples with an applied voltage of 0.5 V.
The enhanced photocurrent density of ZnO:Ag/rGO is therefore due to the photogenerated charge carriers separation efficiency, stimulated after doping by Ag and coating by rGO,which reduces considerably its recombination probability. These results are confirmed by the transmittance spectra which have proved that this sample absorbed more solar light than ZnO:Ag and undoped ZnO.Consequently,it can generate more excitons resulting in a greater photocurrent.
The mechanism of the PEC performance associated with ZnO:Ag/rGO photo-anode is proposed in Fig. 12. The high electronegativity of the oxygen functionalities on rGO sheets makes a p-type surface transfer doping through the withdrawing of electrons and leaving behind holes on the rGO sheets.[64]This behavior of rGO takes advantage to create a p—n junction with an n-type semiconductor which is in our case ZnO:Ag. Similar behavior has been observed by Swe Jyan Tehet al.[33]After the equilibrium, the inner electric field in the heterojunction region makes the ZnO positively charged, and the graphene negatively charged. In this configuration, under xenon lamp excitation a considerable number of free electrons and holes are created in the conduction band (CB) and the valence band (VB) of ZnO:Ag semiconductor, respectively. The most photo-generated electrons were migrated from CB of ZnO to Ag energy levels localized just under the conduction band which act as electrons sink to minimize charge recombination. On the other side,rGO behaves as a discrete semiconductor generating electron—hole pairs. According to previously published papers,[38]the work function of ZnO (-4.05 eV) is lower than that of rGO(-3.85 eV), which results in a lowest unoccupied molecular orbital(LUMO)of rGO situated above the CB of ZnO.Hence,the photo-generated electrons are moved from the LUMO of rGO to the conduction band of ZnO.Then,both the transferred electrons from rGO to CB of ZnO and the trapped electrons in the Ag energy levels are migrated to the Pt counter electrode and participate in the reduction of water to form H2. The holes in the valence band of ZnO:Ag were transferred to the highest occupied molecular orbital(HOMO)of rGO and participate in the oxidation reaction of water to obtain O2under the applied electric field (as shown in Fig. 12). Thus, the synergetic effect of Ag plasmon and rGO sheets leads to high efficient PEC water splitting as confirmed above.
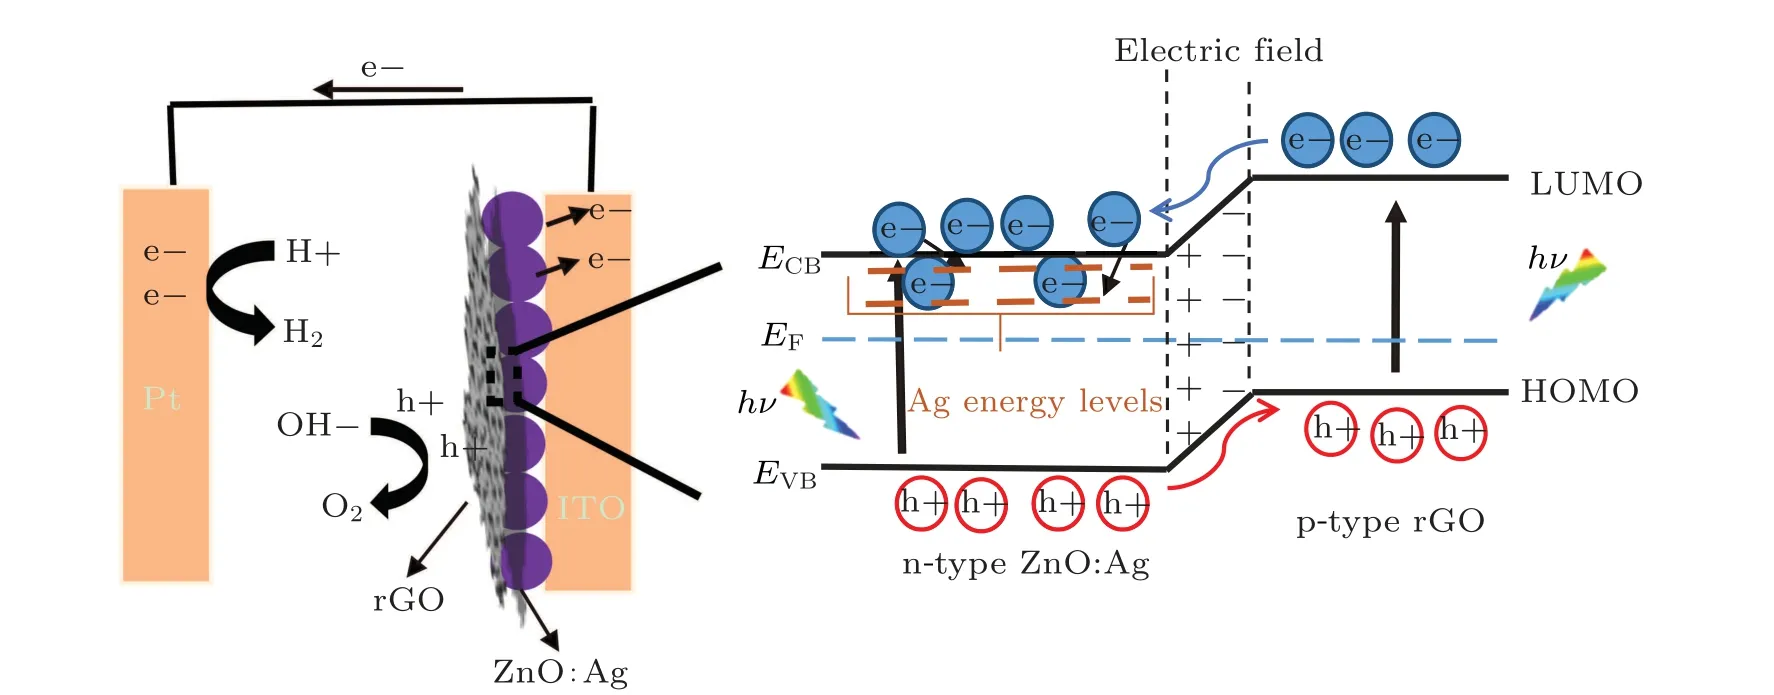
Fig.12. The energetic band structure of ZnO:Ag/rGO p—n junction and the proposed mechanism for the enhancement of the PEC performance.
4. Conclusion
In summary, the ZnO:Ag/rGO thin films were synthesized using a two steps sol-gel spin coating method. The impact of both silver doping and rGO coating on structural,morphological,and optical properties has been studied. The optical measurements revealed a positive contribution of Ag and rGO to exhibit a redshift of the absorption edges to the visible region. The electrical properties revealed that ZnO:Ag/rGO sample presented the highest value of the constant phase element (CPE). This behavior was confirmed by an improvement of the photo-electrochemical response of the same sample which seems to be associated with its limit electron—hole recombination. Also, it was found that ZnO:Ag/rGO photoanode shows the highest photocurrent density compared to ZnO and ZnO:Ag. These results revealed that the new generations of metal-doped semiconductor/graphene have great potential in water splitting applications. Further studies are in progress to test other doping elements such as chromium to perform ZnO-based electrodes and other binary oxides.
Acknowledgement
This work is funded by Tunisian Ministry of Higher Education and Scientific Research through the budget allowed to the implied Tunisian labs.
杂志排行

Chinese Physics B的其它文章
- Erratum to“Boundary layer flow and heat transfer of a Casson fluid past a symmetric porous wedge with surface heat flux”
- Erratum to“Accurate GW0 band gaps and their phonon-induced renormalization in solids”
- A novel method for identifying influential nodes in complex networks based on gravity model
- Voter model on adaptive networks
- A novel car-following model by sharing cooperative information transmission delayed effect under V2X environment and its additional energy consumption
- GeSn(0.524 eV)single-junction thermophotovoltaic cells based on the device transport model