Effect of different catalysts and growth temperature on the photoluminescence properties of zinc silicate nanostructures grown via vapor-liquid-solid method
2022-05-16GhfoorMuhammadImranMurtazaRehanAbidandNaeemAhmad
Ghfoor Muhammad, Imran Murtaza, Rehan Abid, and Naeem Ahmad
Department of Physics,International Islamic University,Islamabad 44000,Pakistan
Keywords: nanostructures, vapor-liquid-solid growth mode, photoluminescence spectra, fluorescence microscopy
1. Introduction
In the last few years, one-dimensional (1-D) nanostructures have gained tremendous interest due to the rising demands of innovative devices that are productive, powerful,and smaller with superior performance.[1—4]The quantum confinement effect is responsible for the peculiar properties of 1-D nanostructures, which have contributed to the bandgap engineering.[5—8]Owing to the high demand for optical materials for different applications such as solid-state lighting,display devices,and cathode ray tube,a lot of attention has been focused on the synthesis techniques and optical properties of various oxide-based phosphors for future innovations. Among the oxide-based phosphors, zinc silicate (Zn2SiO4) has been recognized as an ideal host-matrix material for many rare earth and transition metal dopant ions and presents excellent luminescent properties (e.g., high color purity) as a result of the inner shell electronic transitions between the 3d5energy levels keeping intact its high chemical stability.[9—11]
Zn2SiO4also known as Willemite, is one of the naturally occurring minerals that have a very bright future in advanced materials or devices because on doping with different guest ions, different colors are obtained due to its wide bandgap. Manganese (Mn) doped zinc silicate (Zn2SiO4:Mn+2) is being used since 1930 in fluorescent lamps, oscilloscopes and televisions.[12—15]Zinc silicate emits blue,green and red colors by doping with Eu3+, Mn2+,and Ce3+ions,respectively. It was found that changing the concentration of guest ions significantly influences the luminescence properties of Zn2SiO4. Moreover,the intrinsic defects in Zn2SiO4result in the formation of shallow defect states due to the presence of silicon and oxygen vacancies that serve as charge carrier traps,and this can be depleted at elevated temperatures.[16—22]The growth rate can be controlled by regulating the catalyst and therefore the properties can also be controlled. Hence,it may be a promising material for devices with high luminescence efficiency. Therefore, it is of great interest to explore the photoluminescence properties of Zn2SiO4nanostructures(Zn2SiO4:Sn,Zn2SiO4:Ag and Zn2SiO4:Mn)by varying growth parameters,i.e.,catalysts,temperature of the substrate and flow rate of the gas.
The synthesis of Zn2SiO4nanostructures can be performed in several ways including sol-gel, chemical coprecipitation, hydrothermal, supercritical water process and the vapor-phase process (also known as vapor-liquid-solid(VLS)process). However,the vapor phase process is the easiest method for producing high-quality crystalline Zn2SiO4nanostructures.This approach also has the advantage of allowing the assembly of the nanostructures to be altered by altering the growth temperature and precursors.[23—29]
In this paper, we report a novel work that explores the photoluminescence properties of Zn2SiO4nanostructures by varying the growth parameters, such as catalysts(Sn, Ag and Mn), temperature of the substrate and flow rate of the gas.VLS technique is used to synthesize zinc silicate nanostructures and different catalysts(Mg,Ag and Sn)are used to initiate and affect the growth rate,which modifies the assembly of the nanostructures and hence their photoluminescence properties. The structure, lattice parameters and phase of the prepared zinc silicate nanostructures have been studied by using x-ray diffraction (XRD). Raman spectroscopy is used for the chemical analysis of the prepared samples of Zn2SiO4nanostructures,i.e.,chemical composition(molecular vibration,rotational and phononic modes). Optical properties are observed by using photoluminescence (PL) spectroscopy and fluorescence microscopy.
2. Experimental details
2.1. Materials
All the chemicals used in this study were of analytical and high purity grade purchased from M/s Merck and Sigma-Aldrich. The precursor materials were zinc sulphide, tin(II) chloride, silver (I) chloride, and manganese (II) chloride used to synthesize zinc silicate nanostructures (Zn2SiO4:Sn,Zn2SiO4:Ag and Zn2SiO4:Mn) in which the zinc sulphide powder played a role as source material and all chlorides acted as catalysts. Si (100) substrates were used for the growth of zinc silicate nanostructures and acetone(C3H6O)was used to clean the substrates.
2.1.1. Synthesis
Zinc silicate nanostructures were grown on Si(100)substrates possessing inhabitant oxide layers. At the start, an ultrasonic bath was used for 20 min to clean the substrates placed in acetone.After cleaning,the substrates were loaded in a horizontal tube furnace and the source materials ZnS powder and a catalyst(SnCl2,AgCl2or MnCl2)were individually and simultaneously evaporated in the tube. During the evaporation,the ZnS and a catalyst powder weighted 1 g and 0.5 g,respectively, were put in two separate alumina boats placed 20 cm away from each other,while the ZnS was placed at the center of the furnace tube as presented in Fig. 1. The temperature of the substrates, placed 20 cm away from the center, was in the range of 550—900°C. We placed the source materials in the upstream zone and substrates in the downstream zone. We could achieve the furnace temperature of 1120°C with a rate of 10°C/min. The carrier gas(95%N2+5%H2)for 2 hours was also used with a 20 sccm flow rate. In the end,we cooled down the prepared Zn2SiO4nanostructures in the presence of flow gas. The prepared nanostructures were characterized by XRD by using a Siemens D5000 diffractometer with CuKαradiation in a 2θrange of 20°to 60°. PL emission spectra of samples were measured with the help of He—Cd laser(325 nm)as an excitation source.
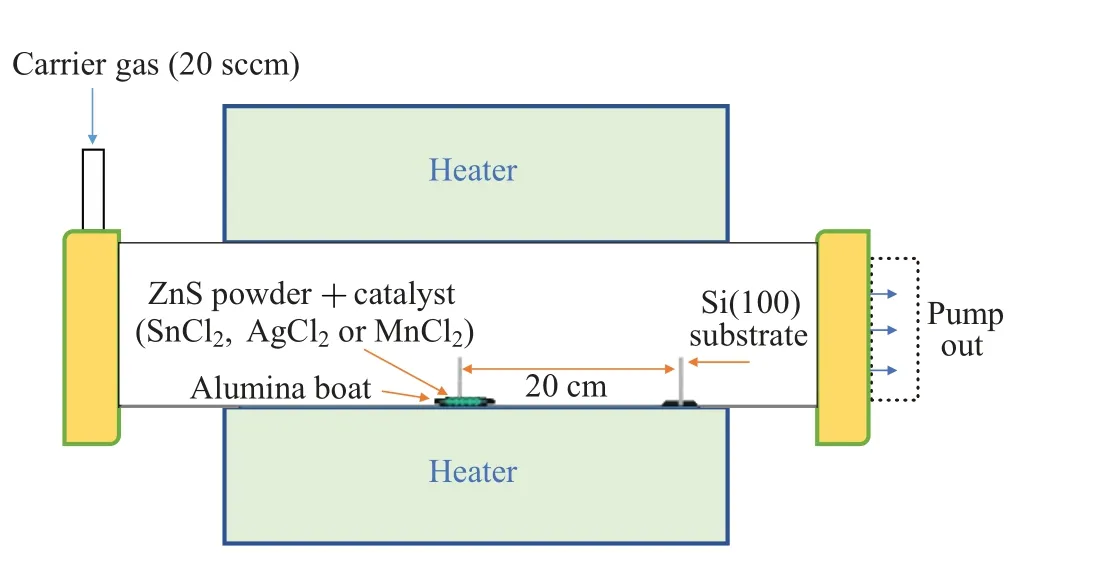
Fig.1. Schematic design of tube furnace used during synthesis.
3. Results and discussion
3.1. Structural,chemical,and optical analysis
3.1.1. XRD analysis
Figures 2(a)—2(f)depict the XRD patterns of zinc silicate nanostructures atTg=600°C and 660°C, through 20 sccm flow rate by using different catalysts (Sn, Ag, and Mn). The diffraction analyses reveal intense and well-defined diffraction peaks, which demonstrate that pure zinc silicate nanostructures have been successfully doped with Sn,Ag and Mn ions.The peak positions correspond to the zinc silicate(Willemite)with the orthorhombic and rhombohedral crystal structure,matched with JCPDS Nos.00-014-0653 and 00-008-0492,respectively. All essential diffraction peaks(215),(023),(226),(0017) and (0215) are visible in the zinc silicate nanostructures,which show the high purity of the crystal structures.
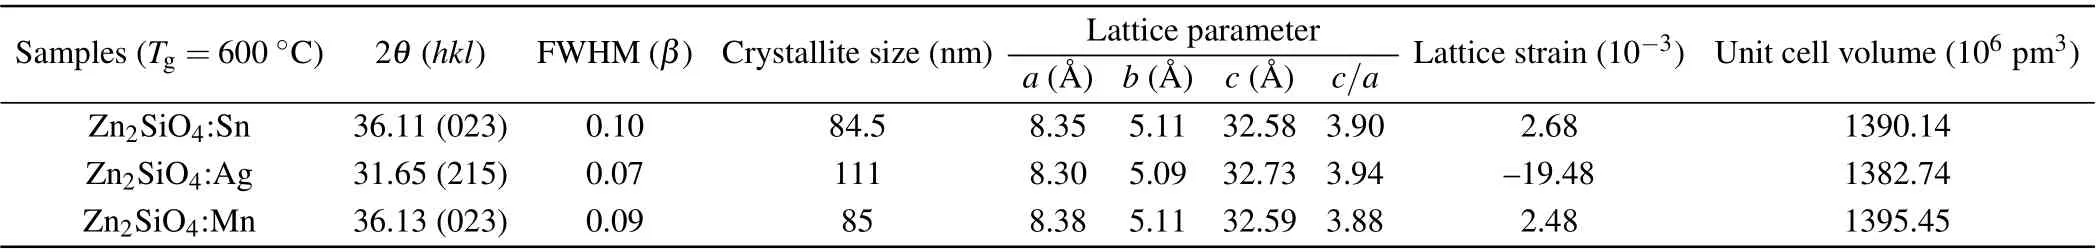
Table 1. Crystallographic parameters of ortho-rhombic zinc silicate nanostructures at a growth temperature of 600 °C.
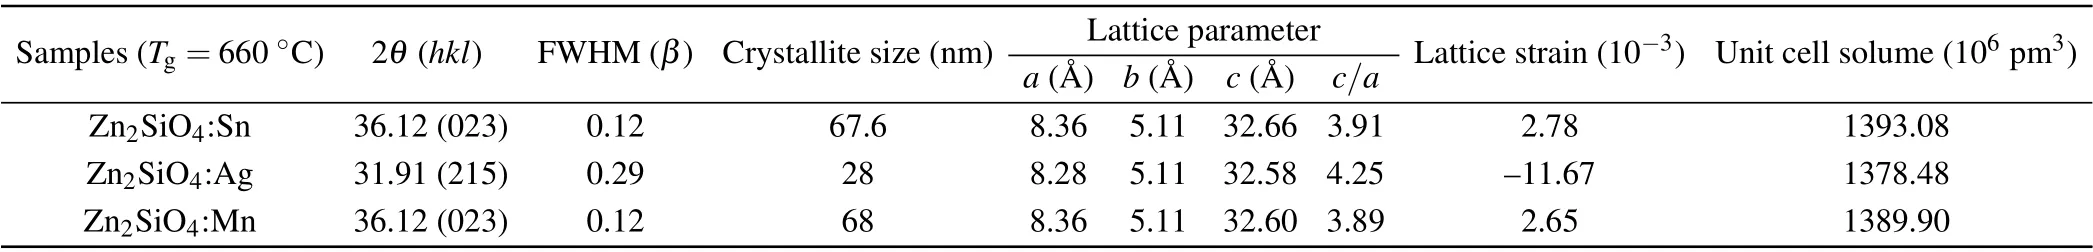
Table 2. Crystallographic parameters of ortho-rhombic zinc silicate nanostructures at a growth temperature of 660 °C.
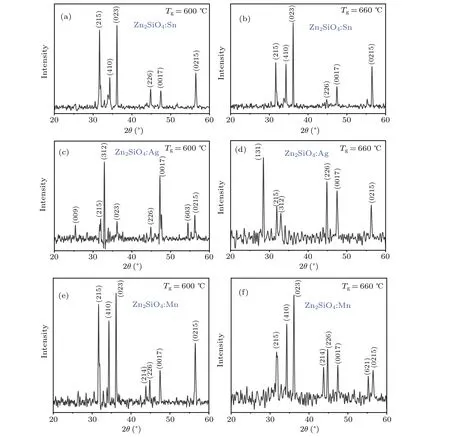
Fig.2. (a)—(f)XRD patterns of Zn2SiO4 nanostructures at Tg=600 °C and 660 °C through 20 sccm flow rate using different catalysts(Sn,Ag,Mn).
Tables 1 and 2 show crystallographic parameters of orthorhombic zinc silicate nanostructures at growth temperatures of 600°C and 660°C. The crystallite size can be calculated by Debye Scherer’s equation, which shows that crystallite size decreases in zinc silicate nanostructures(Zn2SiO4:Sn,Zn2SiO4:Ag and Zn2SiO4:Mn) with the increase in growth temperature.This happens due to the presence of lattice strains in the prepared samples that were estimated by calculating shift in the inter planer spacing of reflection plane with the help of the following formula:
whereεis lattice strain,dis the sample inter planer spacing at various temperatures andd0is the inter planner spacing,taken from the corresponding JCPDS card. In Zn2SiO4:Sn,lattice parameteraslightly increases while lattice parameterbremains unchanged,but lattice parametercalso increases with the increase in growth temperature. This is the indication of tensile stress ona—bplane while tensile strain alongc-axis.Although,in Zn2SiO4:Ag,lattice parametersaandbdecrease while lattice parametercincreases whenTg=600°C.This is the indication of compressive stress ona—bplane while tensile strain alongc-axis. Whereas,atTg=600°C,lattice parameteradecreases while other lattice parameters,bandc, increase.This is the indication of compressive stress alonga-axis and tensile stress alongb—cplanes.So,it is found that lattice is expanded at lower temperature 600°C while it shrunk at higher temperature 660°C.Similarly,in Zn2SiO4:Mn,lattice parameteraslightly decreases while other lattice parameters,bandc, slightly increase atTg=600°C andTg=600°C. This is the indication of compressive stress along a-axis while tensile strain alongb—cplane. So, it is found that overall lattice expanded with the decrease in temperature.
Also the volume of unit cells is increased in zinc silicate nanostructures(Zn2SiO4:Sn,Zn2SiO4:Ag,Zn2SiO4:Mn)as shown in Tables 1 and 2 because dopant ions go to the interstitial sites present in the unit cell. Thus, interstitial incorporation of dopant ions in the unit cell may lead to tensile strain at the residing site while nearby planes have compressional stress that might be the reason for expansion in the unit cell of the zinc silicate crystal structure. Moreover, it is observed that lattice symmetry changes with assembly of zinc silicate nanostructures that can be modified by varying growth temperature. This is indicated by axial ratio(c/a)for the prepared samples in Tables 1 and 2.
From all these, it is observed that growth parameters affect the diffraction peak intensity along the plane direction which significantly influences the crystallite size. The lattice symmetry in zinc silicate changes as indicated by the axial ratio (c/a) with different dopant ions (Sn, Ag, Mn) in the unit cell due to the deficiency of oxygen stoichiometry leading to defects and as a result, the diverse photoluminescent properties of the prepared nanostructures are obtained.
3.1.2. Raman spectroscopy
The zinc silicate nanostructures have been investigated by Raman spectroscopy to obtain chemical analysis of the crystal structures. Zinc silicate indicates trigonal symmetry that has a rhombohedral unit cell,linked with the space groupR-¯3.However,the orthorhombic unit cell hasβ-phase and the corresponding Raman spectra generally indicate a shift towards greater values that are strongly dependent on the dopant types in the lattice. Figures 3(a)—3(f) show the Raman spectra of Zn2SiO4nanostructures grown atTg=600°C and 660°C by using different catalysts (Sn, Ag, Mn). In undoped-Zn2SiO4Raman active modes reported experimentally in the range of 800—1100 cm-1are found around 864 cm-1, 908 cm-1and 940 cm-1,[30,31]ascribing the stretching and bending vibrations of the tetrahedral silicate ion.
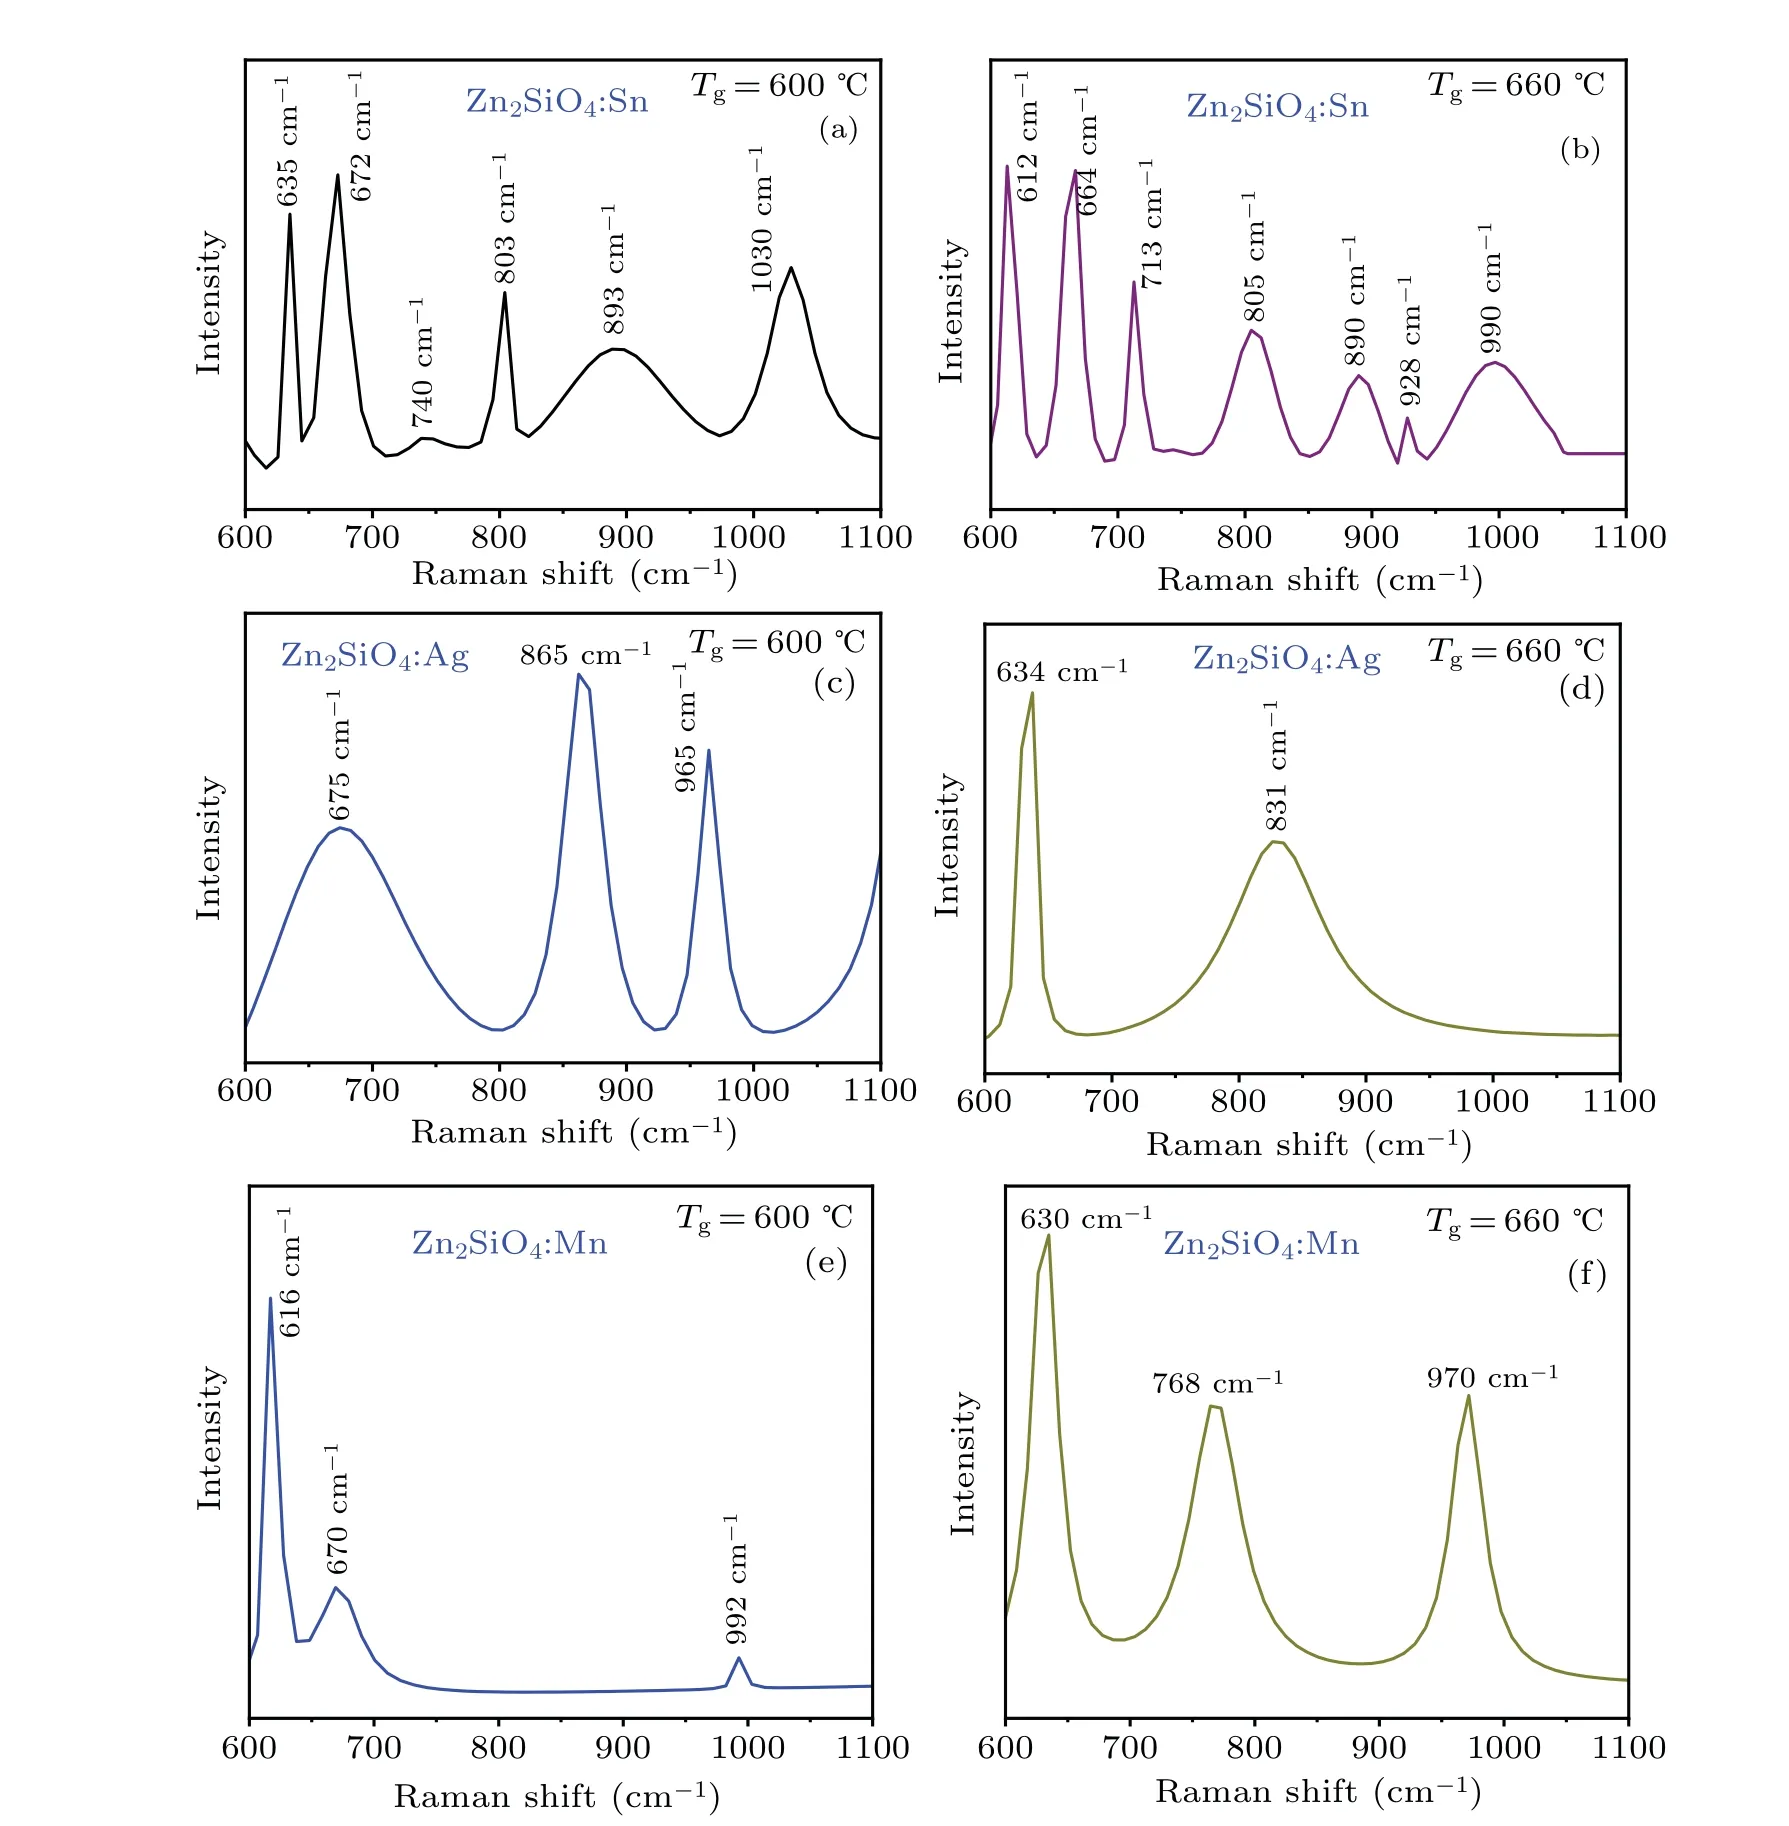
Fig.3. (a)—(f)Raman spectra of Zn2SiO4 nanostructures grown at Tg=600 °C and 660 °C using different catalysts(Sn,Ag,Mn).
Nevertheless, in the doped-Zn2SiO4nanostructures(Zn2SiO4:Sn, Zn2SiO4:Ag, and Zn2SiO4:Mn), Raman active modes are found to be shifted towards the greater values,i.e.,893 cm-1, 1030 cm-1, 865 cm-1, 965 cm-1, and 970 cm-1,representing compressional stress in the material. The vibrational bands are also shifted toward the higher values, i.e.,635 cm-1,672 cm-1,675 cm-1,and 630 cm-1,due to Zn—O bond vibrations in the tetrahedral ZnO4-ions. The frequency shift exhibits the compressive stress in the synthesized material,which may be due to the substitution of different catalysts(Sn+2, Ag+2, Mn+2ions) into the zinc silicate lattice. Thus,Raman spectroscopic analysis confirms the results obtained by XRD.
3.1.3. Growth process
The structural, chemical and optical aspects of different catalysts (Sn, Ag, Mn) doped zinc silicate nanostructure are the focus of this work. However, the phenomenon of the growth of Zn2SiO4:Sn(Ag or Mn)nanowires is also necessary to illustrate. In VLS method, nanowires growth is facilitated by the creation of catalyst liquid droplets. Here, it is considered that disintegration of Cl from SnCl2(AgCl2or MnCl2)interacted with silicon substrate and scratched it randomly,resulting in a permeable or rough silicon surface. The Sn—Zn—Si(Ag—Zn—Si or Mn—Zn—Si)alloy catalyst liquid droplet was generated when Sn (Ag or Mn) and Zn vapors were continually accumulated on the substrate. It is greatly effective for the creation of nucleation points for Zn—Si alloy liquid droplets due to its eutectic temperature of 420°C that generated excellent circumstances for the increased formation of zinc silicate nanowires.[32]So,the scratched Si surface and the development of Sn (Ag or Mn) mixed Zn—Si droplets as catalytic nuclei for growth were assumed to be the cause of arrays of nanowires. Pure Willemite Zn2SiO4has revealed its ability to nucleate in arrays from a structural perspective. Accordingly, small threads were created first, then swiftly gathered into arrays of threads,which were then altered into bigger arrays/bundles. The gathered arrays were then converted into more complicated patterns.
3.1.4. Photoluminescence spectroscopy
With the objective to determine the photoluminescence spectra of zinc silicate nanostructures,the nanostructures were excited with the help of He—Cd laser at wavelength of 325 nm at room temperature. Regarding the optical properties,the PL spectra with PL percentage emission intensity were measured and fluorescence microscopy has also been studied. PL investigations have been recognized as one of the most sensitive and extensively employed methods for exploring the physical features of materials, such as optical bandgap and emission colors,due to their high precision and non-destructive nature. In Figs. 4(a)—4(b), the spectra of zinc silicate grown atTg=600°C andTg=600°C in the presence of Tin catalyst were obtained and fitted with the help of three Gaussian functions to determine the entire emissions of PL. The obtained spectra gave an extensive range of features with a slight shift in the position and, conversely, low variation in the intensities. The eminent property of pure Zn2SiO4is that it cannot give radiations in the visible range of the electromagnetic spectrum[33,34]but in Zn2SiO4:Sn nanostructure, it is found that a wide multi-band spectrum of light covers the visible range indicating the successful incorporation of Sn ions creating numerous emission centers in the Zn2SiO4crystal structure. AtTg=600°C,the prepared sample gets a larger crystallite size which shows the less solubility of Sn ions in the host Zn2SiO4lattice confirmed by the XRD graph. The insets of Figs. 4(a) and 4(b) show that those ions contribute to the formation of sub-lattices with specific energy band structures,hence the impurity electrons of Si 3s and Zn 3d in oxygen 2p states develop the lower and upper parts of the conduction and valance bands respectively. Also, Sn cations have dual valency in nature,i.e.,Sn4+and Sn2+,and the host lattice normally holds these cations. However,as a result of the allowed transitions, the transition probability of Sn4+is much lower than that of Sn2+. For instance, Sn2+hasns2-type electronic configuration with the excited state (ns1np1) and the ground states(ns2), the coordination fields strongly affect the behavior. The allowed 5s→5p transitions give a huge cross-section of absorption that generates strong photoluminescence. The higher oxidation state of Sn4+occupied by the Sn ions at the tetrahedral cationic site is mainly due to the low concentration of Sn because of oxygen and zinc vacancies and hence green(523 nm)and blue(481 nm)lights are observed respectively.In the host Zn2SiO4lattice, a higher crystal field causes the yellow (581 nm) emission. The energy level diagrams of the Zn2SiO4:Sn at various growth temperatures are quite similar due to the same defects in the host lattice but the emission intensities of all colors are different indicating that Zn2SiO4:Sn nanostructure has a wide visible range.
Now the PL spectrum of Zn2SiO4nanostructures in the presence of silver catalyst at different growth temperatures is shown in Figs. 4(c)—4(d) and the obtained PL spectrum has been fitted by using two Gaussian functions that indicate the involvement of the two sources. In Zn2SiO4:Ag nanostructures, a wide multi-band spectrum of light covers the visible range and the energy level diagrams of the Zn2SiO4:Ag at various growth temperatures are quite different due to the different coordination fields of Ag-ions in the host lattice.At 600°C there are cyan (496 nm) and green (562 nm) emissions corresponding to zinc and oxygen vacancies respectively, while at 660°C blue (451 nm) and red (655 nm) emissions are observed corresponding to the zinc and intrinsic zinc vacancies respectively. Figures 4(e)—4(f) show the PL spectrum of Zn2SiO4nanostructures in the presence of manganese catalysts at different growth temperatures. At 600°C, violet(429 nm) and green (501 nm) emissions are observed corresponding to zinc-oxygen bond vibrations and oxygen vacancies respectively, while at 660°C cyan (490 nm) and yellow(572 nm)emissions are observed corresponding to the zinc and oxygen vacancies respectively. On the other hand,by investigating the relationship between the growth temperature and crystallite size, it is found that decreasing the crystallite size in nanostructures with increasing growth temperature leads to the enhancement of photoluminescence property.
The comparative percentages of different emissions to the PL spectrum of the prepared nanostructures concerning growth temperature are shown in Fig. 5. In Fig. 5(a), it can be seen that the percentage emission intensities are higher at lower temperatures and decrease with an increase in temperature due to an increase indspacing as a result of the decrease in oxygen and intrinsic oxygen vacancies in the grown nanostructures,while zinc vacancies almost remain the same.Figure 5(b)gives the comparative percentages of the different emission intensities of the PL spectra of the prepared samples in the presence of silver at different growth temperatures. It can be observed that at 600°C percentage emission intensities are higher as compared to those at 660°C due to the decrease in the zinc vacancies in the grown nanostructure.Hence indicate that at higher temperatures greater wavelength is obtained due to intrinsic zinc vacancies. The comparative percentage of the different emission intensities of the PL spectra of prepared samples in the presence of manganese catalyst at different growth temperatures is illustrated in Fig.5(c). It can be seen that when the temperature increases the wavelength is shifted towards a higher value.
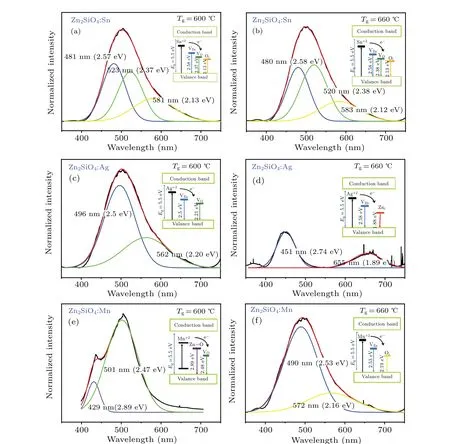
Fig. 4. (a) and (b) PL spectra of Zn2SiO4 nanostructures grown in the presence of tin at Tg =600 °C & Tg =600 °C. Insets: Energy band diagrams showing transition of Sn+2 electron to Zn vacancies(VZn),oxygen vacancies(VO),and intrinsic oxygen vacancies(Oi). (c)and(d)PL spectrum of Zn2SiO4 nanostructures in the presence of silver grown at Tg=600 °C&Tg=600 °C.Insets: Energy band diagrams showing transition of Ag+2 electron to zinc vacancies (VZn), intrinsic Zn vacancies (Vzni), and oxygen vacancies (VO). (e) and (f) PL spectrum of Zn2SiO4 nanostructures in the presence of manganese catalyst grown at Tg=600 °C,and Tg=660 °C.Insets: Energy band diagrams showing transition of Mn+2 electron to Zn—O vacancies,zinc vacancies(VZn),intrinsic oxygen vacancies(Oi),and oxygen vacancies(VO).
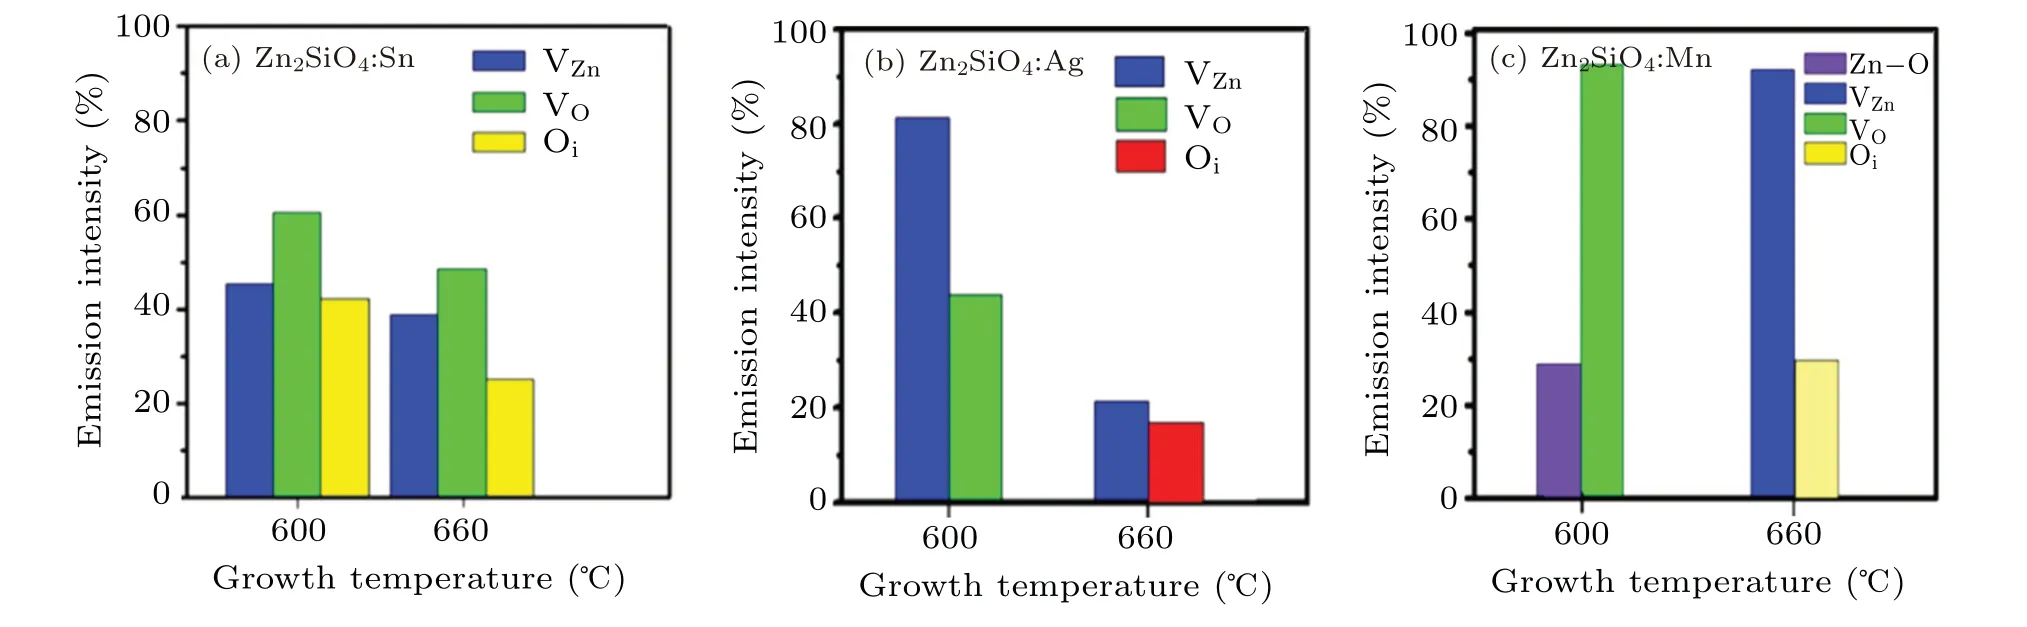
Fig.5. (a) The variation in the PL percentage emission intensities in the presence of tin, at different growth temperatures, related to oxygen vacancies (VO), intrinsic oxygen vacancies (Oi), and Zn vacancies (VZn). (b) The variation in the PL percentage emission intensities in the presence of silver,at different growth temperatures,related to oxygen,intrinsic Zn,and Zn vacancies. (c)The variation in the PL percentage emission intensities in the presence of manganese,at different growth temperatures,related to oxygen,intrinsic Zn,and Zn vacancies.
In brief, incorporation of various catalysts (Sn, Ag, and Mn)at different growth temperatures into the Zn2SiO4lattice provides broad visible spectral range of PL emissions because zinc silicate (Zn2SiO4) has wide-ranging bandgap of 5.5 eV due to its inner shell electronic transitions between the 3d5energy levels. Photoluminescence percentage emission intensity is maximum at lower temperatures and decreases with an increase in temperature due to an increase indspacing.Hence, the oxygen vacancies and intrinsic oxygen vacancies are decreased in the grown nanostructures with an increase in temperature while zinc vacancies almost remain the same.Therefore, at higher temperatures greater wavelength is obtained. This is observed from the energy level diagrams of the Zn2SiO4nanostructures at various growth temperatures due to the different coordination fields of (Sn, Ag, and Mn) ions in the host lattice.
The allowed transitions of different catalysts in the zinc silicate lattice offer a huge cross-section of absorption that generates strong photoluminescence.
3.1.5. Fluorescence microscopy
Zn2SiO4nanostructures are grown by the VLS method at different growth temperatures and silicon is used as a substrate. Luminescence of various samples grown in the presence of Sn, Ag, and Mn was observed. Sn ions are the main cause of the observed emissions that reside at different sites of the synthesized Zn2SiO4lattice structure that may result in different emission centers as observed in Fig. 6. The sample grown atTg=600°C(Fig.6(a))is dense and the green spectral range of the emission is observed. While sample grown atTg=660°C(Fig.6(b))is not very dense in nature representing the spectral emission in the color range of green and blue.When Ag is used as a catalyst then there is no as dense crystal growth as observed in the case of Sn. AtTg=600°C and 660°C,green and blue spectral ranges are detected as shown in Figs. 6(c)—6(d). However, by using Mn as a catalyst, it is observed that sample grown atTg=600°C is very dense in nature and show green and blue spectral emissions while sample grown atTg=660°C is not so dense and it also shows green and blue spectral emissions as shown in Figs.6(e)—6(f).
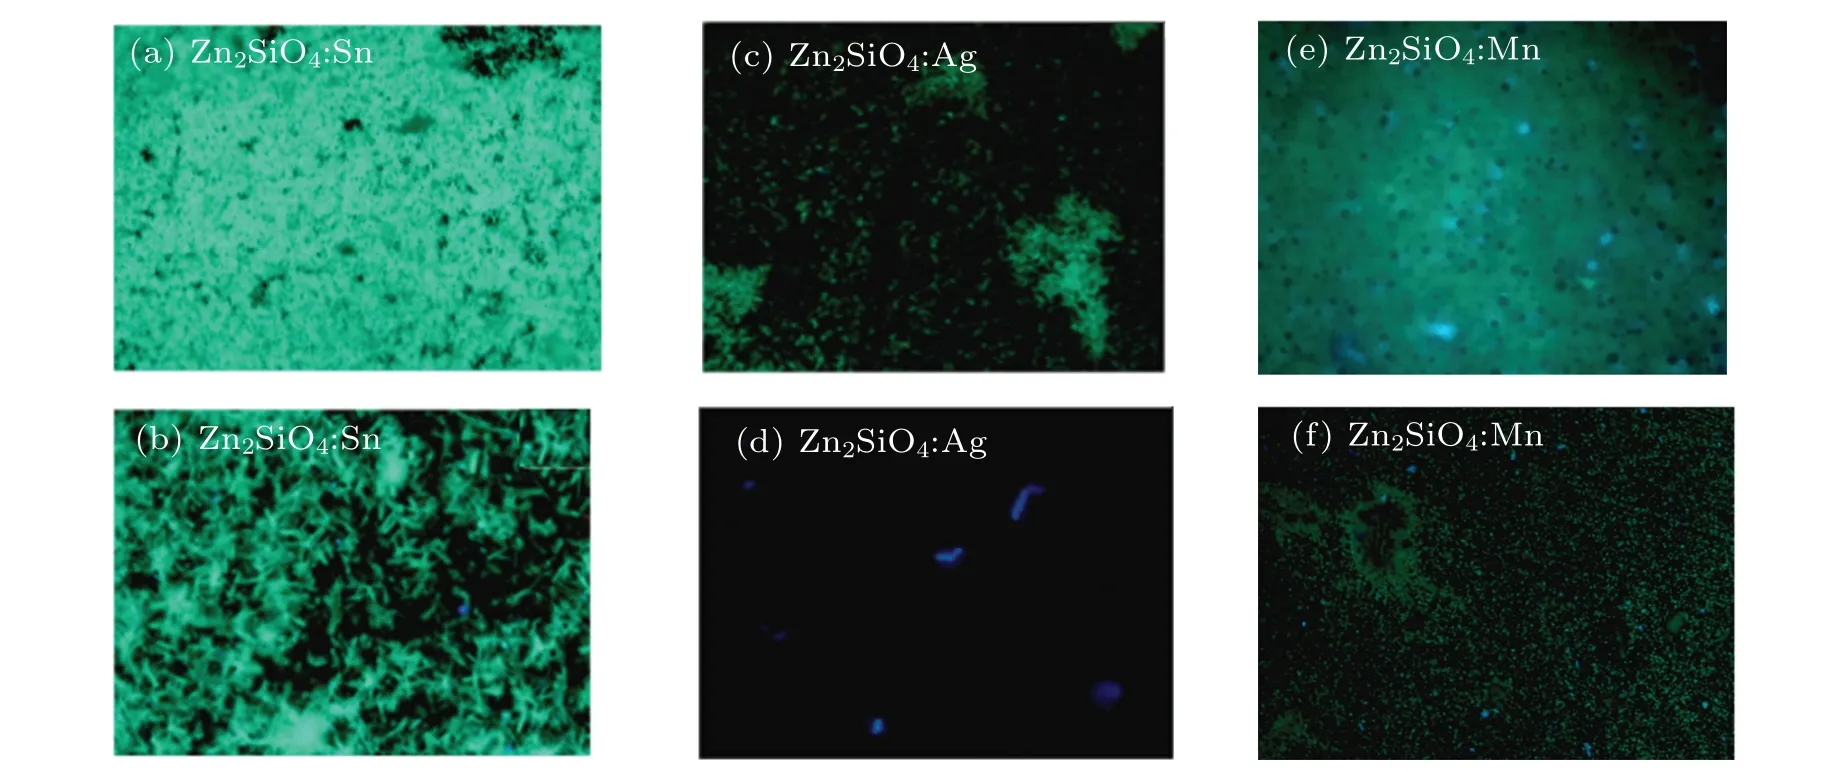
Fig. 6. (a) and (b) Fluorescence-microscopy images taken at 10×, (a) Tg =600 °C and (b) Tg =600 °C for Zn2SiO4 nanostructures grown by using tin as a catalyst. (c) and (d) Fluorescence-microscopy images taken at 10×, (c) Tg =600 °C and (d) Tg =660 °C for Zn2SiO4 nanostructures grown by using silver as a catalyst. (e) and (f) Fluorescence-microscopy images taken at 10×, (e) Tg =600 °C and (f) Tg =660 °C for Zn2SiO4 nanostructures grown by using manganese as a catalyst.
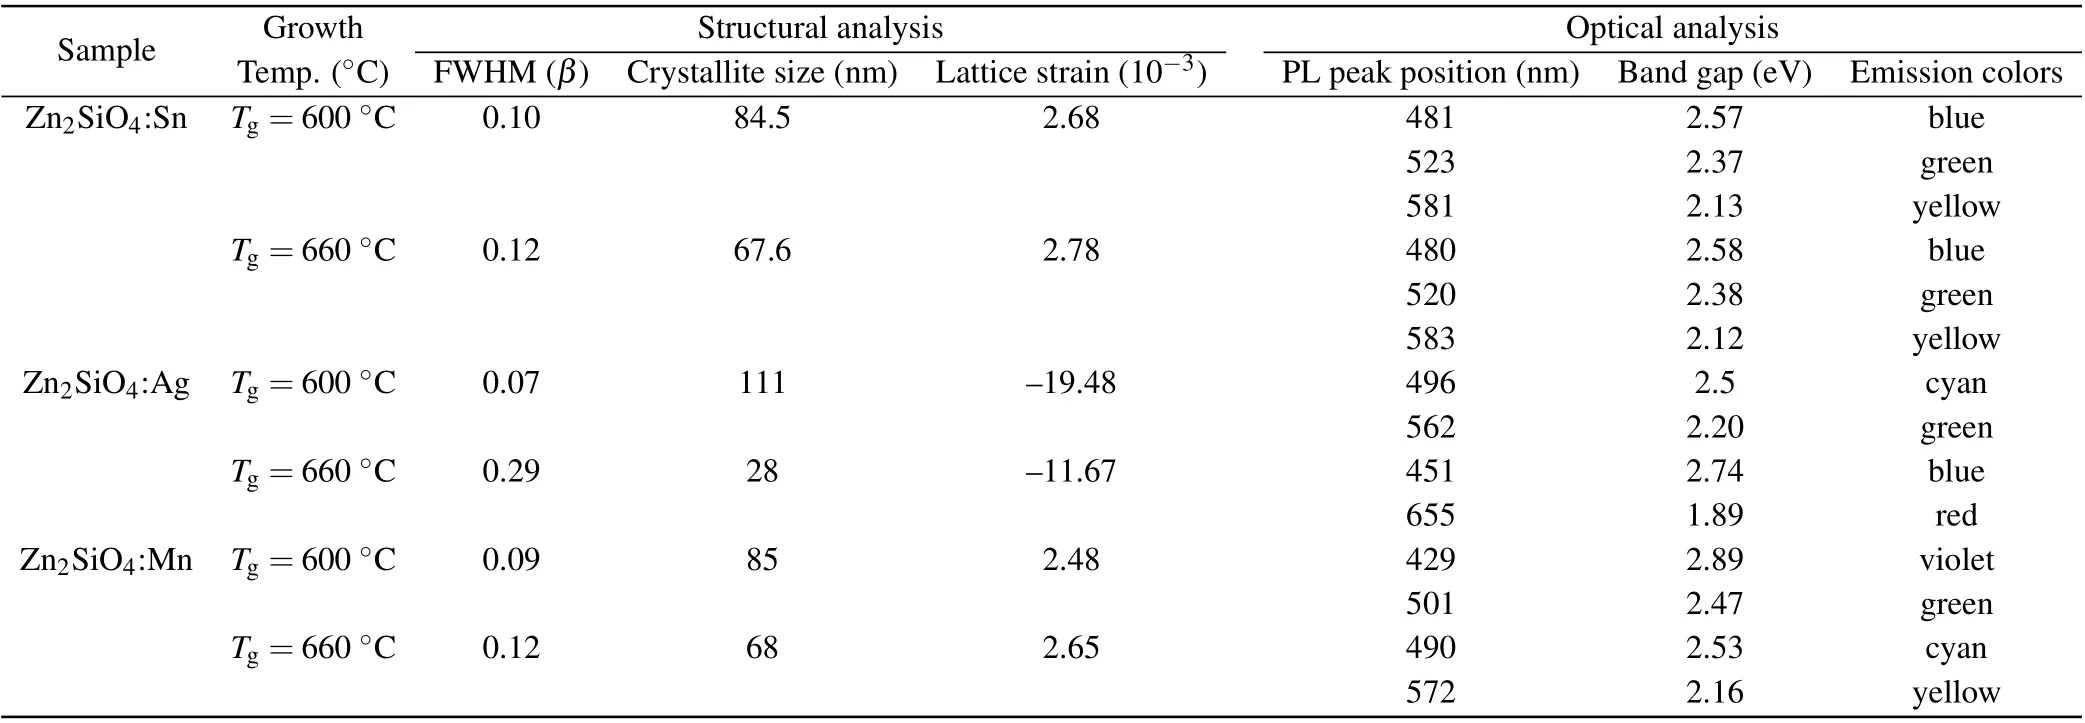
Table 3. Summary of the results.
From Table 3, it has been observed that the decrease of temperature leads to an increase in diffraction peak intensity which significantly influences the crystallite size that leads to peaks of different widths. With elevating the temperature,the full-width half maxima (FWHM) likewise rises, resulting in a small crystalline size. Therefore, at high temperature of 660°C,we observed lower crystallinity of prepared nanostructures that reveal very strong and shifted emission peak which shows that more defects are generated in Zn2SiO4, hence stronger photoluminescence peak positions with the bandgap of 2.58 eV (480 nm), 2.38 eV (520 nm), 2.12 eV (583 nm),2.74 eV (451 nm), 1.89 eV (655 nm), 2.53 eV (490 nm),2.16 eV (572 nm) corresponding to emission colors of blue,green,yellow,red and cyan,respectively,have been observed.So,the prepared photoluminescent nanostructures are promising candidates for applications in optical emission devices.
4. Conclusion
In summary,Zn2SiO4nanostructures by varying catalysts like Mn, Ag and Sn were synthesized via VLS method. The structural, chemical and photoluminescence properties were investigated in detail. XRD reveals that Zn2SiO4lattice symmetry varies due to the deficiency of oxygen stoichiometry leading to defects and with the increase in temperature, the crystallite size decreases. Furthermore, Raman spectroscopic analyses confirmed the results obtained by XRD.The intensity of photoluminescence emission is highest at lower temperatures and decreases as the temperature rises owing to an increase in d spacing.Also,with increasing temperature,oxygen vacancies and intrinsic oxygen vacancies decline in the produced nanostructure, whereas zinc vacancies almost remain constant. As a result, at higher temperatures, a longer wavelength,i.e.,red emission,is obtained. PL analyses show broad multi-band spectra of Zn2SiO4nanostructures in the visible region with PL peak position and optical bandgap of 2.89 eV(429 nm), 2.74 eV (451 nm), 2.53 eV (490 nm), 2.38 eV(520 nm), 2.12 eV (583 nm), 1.89 eV (655 nm) corresponding to emission colors of violet,blue,cyan,green,yellow and red,respectively,due to the presence of different catalysts(Sn,Ag,and Mn)and hence the allowed transitions of different catalysts in the zinc silicate lattice offer a huge cross-section of absorption that generates strong PL.Finally, this is a promising outcome in terms of using transition metal photoluminescent nanostructures for the development of solid-state lighting and display devices applications.
Acknowledgement
The authors acknowledge the technical support provided by the COMSATS University and National Centre for Physics,Islamabad Pakistan.
杂志排行

Chinese Physics B的其它文章
- Erratum to“Boundary layer flow and heat transfer of a Casson fluid past a symmetric porous wedge with surface heat flux”
- Erratum to“Accurate GW0 band gaps and their phonon-induced renormalization in solids”
- A novel method for identifying influential nodes in complex networks based on gravity model
- Voter model on adaptive networks
- A novel car-following model by sharing cooperative information transmission delayed effect under V2X environment and its additional energy consumption
- GeSn(0.524 eV)single-junction thermophotovoltaic cells based on the device transport model