拉张速率和岩石圈流变结构对大陆岩石圈破裂影响的数值模拟研究
2022-05-11信延芳MartarezGussiny
信延芳, 闫 义, Marta Pérez-Gussinyé, 罗 阳
拉张速率和岩石圈流变结构对大陆岩石圈破裂影响的数值模拟研究
信延芳1, 2, 3, 4, 闫 义1, 2, 5, 6*, Marta Pérez-Gussinyé4, 罗 阳7
(1. 中国科学院 广州地球化学研究所, 边缘海与大洋地质重点实验室, 广东 广州 510640; 2. 中国科学院深地科学卓越创新中心, 广东 广州 510640; 3. 中国科学院大学, 北京 100049; 4. 不莱梅大学 海洋环境 研究中心, 德国 不莱梅; 5. 南方海洋科学与工程广东省实验室(广州), 广东 广州 511458; 6. 中国科学院南海生态环境工程创新研究院, 广东 广州 510301; 7. 中石化胜利油田发展规划部, 山东 东营 257001)
拉张速率和岩石圈流变结构是影响大陆岩石圈破裂的重要因素, 共同控制大陆裂谷的演化过程, 最终形成不同结构的被动大陆边缘。本文通过热‒动力学数值模拟, 分析了拉张速率和岩石圈流变结构对初始裂谷形态及最终大陆边缘结构的影响。模拟结果显示, 在不同下地壳厚度(15 km或20 km)和拉张速率(半拉张速率为2~50 mm/a)条件下, 大陆岩石圈的破裂时间、破裂过程及大陆边缘结构均会发生明显改变。两种不同初始流变结构模型的初始裂谷均为窄裂谷。当下地壳的厚度为15 km时, 较慢的拉张速率下(2~5 mm/a)最终产生了对称型大陆边缘, 较快的拉张速率下(10~25 mm/a)形成了非对称型大陆边缘。而当下地壳的厚度为20 km时, 不同的拉张速率下均形成非对称型大陆边缘。同时, 对于不同的岩石圈流变结构, 拉张速率越快, 岩石圈破裂发生时间越早。在超慢速数值模拟实验中, 由于岩石圈破裂时间长, 岩石圈热冷却程度较高, 上地壳主要发育脆性断裂, 壳幔耦合程度较高, 进而形成过度伸展的地壳。在超慢拉张速率(2~5 mm/a)和超快拉张速率(50 mm/a)下, 大陆边缘对称性较高。对于不同流变结构的岩石圈, 在超快拉张速率下会发育类似宽度的共轭大陆边缘。
被动大陆边缘; 拉张速率; 岩石圈流变结构; 数值模拟
0 引 言
被动大陆边缘记录了大陆岩石圈从张裂到海底扩张的完整地质信息, 其构造演化研究是地球系统科学的重要前沿领域。被动大陆边缘形成的概念模型包括纯剪模型(McKenzie, 1978)和单剪模型(Wernicke and Burchfiel, 1982; Wernicke, 1985), 以及两者的派生模型(Jarvis and McKenzie, 1980; Spohn and Schubert, 1983; Huismans and Beaumont, 2002, 2008)。近年来, 随着地球物理探测技术的进步及大洋钻探的不断实施, 对被动大陆边缘构造演化的认识不断深入。越来越多的研究表明, 岩石圈流变结构和拉张速率是大陆岩石圈破裂的重要影响因素, 控制大陆裂谷的演化过程, 最终形成不同的大陆边缘结构(Manatschal, 2004; 夏斌等, 2005; 崔学军等, 2005; Lavier and Manatschal, 2006; Péron-Pinvidic and Manatschal, 2009; Reston, 2009; Huismans and Beaumont, 2011; Franke, 2013; 吴哲等, 2014; 孙珍等, 2016; Andrés- Martínez et al., 2019)。
关于岩石圈流变结构和拉张速率对被动大陆边缘影响的研究很多。如Nemčok et al. (2012)通过研究全球被动大陆边缘和拉张速率的关系, 发现慢拉张速率主要与窄的、有薄韧性层的被动大陆边缘相关, 而快拉张速率主要与宽的、有厚韧性层的被动大陆边缘相关。Pérez-Gussinyé et al. (2001)认为Iberian大陆边缘的极度伸展减薄区域, 主要是由于过慢拉张速率导致岩石圈冷却, 造成了地壳的脆化变形。除了地质和地球物理方面的研究, 还有学者通过物理模拟和数值模拟, 对大陆岩石圈裂解及裂谷形态开展研究, 取得了很多成果(Buck, 1991; Brun, 1999; Buck et al., 1999; Huismans et al., 2001; Le Pourhiet et al., 2004; Lavier and Manatschal, 2006; Huismans and Beaumont, 2011; Huet et al., 2011; Beaumont and Ings, 2012)。但是, 关于岩石圈流变结构和拉张速率对早期裂谷盆地和大陆边缘形态影响的重要性, 还不够重视。本文在前人研究的基础上, 系统研究了拉张速率和岩石圈流变结构对被动大陆边缘构造演化, 尤其是对大陆裂谷初期形态及大陆边缘对称性结构的影响。
1 被动大陆边缘拉张速率
被动大陆边缘的拉张速率, 可以由大地测量学、板块重建以及现代大洋的扩张速率等方法获得。但是, 不同方法跨越的时间尺度以及所处被动大陆边缘的演化阶段不同, 得到的被动大陆边缘的拉张速率存在一定差异。全球不同的主动裂谷、被动大陆边缘及大洋的拉张速率见表1。不同地区的拉张速率区别很大, 主动裂谷的扩张速率主要集中在0~20 mm/a, 如Rio Grande裂谷、贝加尔裂谷、亚丁湾等。Rio Grande裂谷拉张速率较慢, 为0.2~1.2 mm/a。而埃塞俄比亚裂谷的拉张速率则比较快, 为3~20 mm/a, 这种较高拉张速率可能是受岩浆作用的影响。并且, 主动裂谷的拉张速率随着时间而变化, 如埃尔法裂谷由初始的25 Ma前拉张速率小于16 mm/a增长至现今的20 mm/a (Tesfaye et al., 2003), 盆岭省从16 Ma时的20 mm/a减少至5 Ma时的10 mm/a(Snow and Wernicke, 2000)。
被动大陆边缘的构造重建, 也可以对裂谷的拉张速率提供参考。Heine et al. (2013)通过地质重建的方法得到南大西洋南部的拉张速率大约为10 mm/a。Brune et al. (2016)通过应用一种新的地质构造分析方法, 调查了全球裂谷的拉张速率, 显示北大西洋北部、Iberian-Newfondland裂谷以及南海等大陆边缘的拉张速率分别为2~20 mm/a、3~15 mm/a和4~45 mm/a。并且, 随着裂谷的发育, 拉张速率可能在某个阶段加速。
现代大洋中脊的扩张速率较快, 大约为10~ 150 mm/a, 其中太平洋洋隆和东南印度洋洋中脊的全扩张速率比较快, 在50~150 mm/a之间; 而西南印度洋洋中脊、大西洋洋中脊和北冰洋洋中脊扩张速率比较慢, 为10~40 mm/a。

表1 全球部分主动裂谷盆地及大洋的全拉张速率
2 数值模拟实验方法
本文利用基于MILAMIN的热‒力学求解程序(Dabrowski et al., 2008)的二维粘‒塑‒弹性地壳动力学模型(Andrés-Martínez al., 2019; Pérez-Gussinyé et al., 2020), 探讨岩石圈流变结构和拉张速率与被动大陆边缘构造演化的关系。在模型中, 包含了应力自由界面模型(Kaus et al., 2010; Andrés-Martínez et al., 2015)、应变弱化以及剪切生热等模块。
模型中将大陆岩石圈和软流圈的流变结构分为3部分: ①上地壳, 由湿石英组成; ②下地壳, 由镁铁质橄榄岩(mafic granulite, MG)组成; ③地幔, 被一个5 km的过渡带分为两部分, 上部分是干橄榄岩组成的岩石圈地幔, 下部分是湿橄榄岩组成的软流圈地幔(图1)。初始模型的宽度是400 km, 深度是150 km, 其中上地壳为20 km, 分辨率是1 km; 下地壳为15 km或者20 km, 分辨率是5 km; 其余为地幔, 分辨率为5 km(图1b)。其中, 各层的边界处的分辨率较高, 为1 km。实验模型的顶部和底部均设置为固定的温度, 分别是0 ℃和1300 ℃, 并且在左右边界无热量流动, 莫霍面的温度约为600 ℃(图1a)。在模型的底部边界, 应用Winkler边界条件(Buck and Poliakov, 1998; Burov and Poliakov, 2001), 即在底部节点施加向上的恒定应力。这种应力与初始模型岩石圈基底的压力相关, 相当于在盆地底部有一个不变的均衡补偿面, 可以允许岩石圈物质上下的流入和流出。为了避免模型的变形集中在边界上, 与常规的地球动力学模型类似, 在模型的中心设置了一个温度高点, 作为“薄弱带种子点”(weak seed)。关于本文中数值模型的更多信息, 可以参考Andrés-Martínez et al. (2019)和Peréz-Gussinyé et al. (2020)。模型中详细的参数设置见表2。
本次实验设置了两种不同的岩石圈流变结构。第一种流变结构是地壳厚度为35 km, 其中下地壳为15 km, 简称为“MG35”模型。第二种流变结构是地壳厚度为40 km, 其中下地壳为20 km, 简称为“MG40”模型。当下地壳厚度是20 km, 而不是15 km时, 相当于岩石圈地幔顶部的5 km被下地壳取代。由于温度的影响, 岩石圈的流变强度整体降低, 造成壳幔解耦变形(图1a)。针对这两种不同的岩石圈流变结构, 在不同拉张速率下, 研究初始裂谷宽度、形态、破裂时间以及最终大陆边缘的结构和构造。当被动大陆边缘地壳厚度小于200 m时, 认为地壳发生破裂, 即裂谷作用结束, 裂后阶段开始。
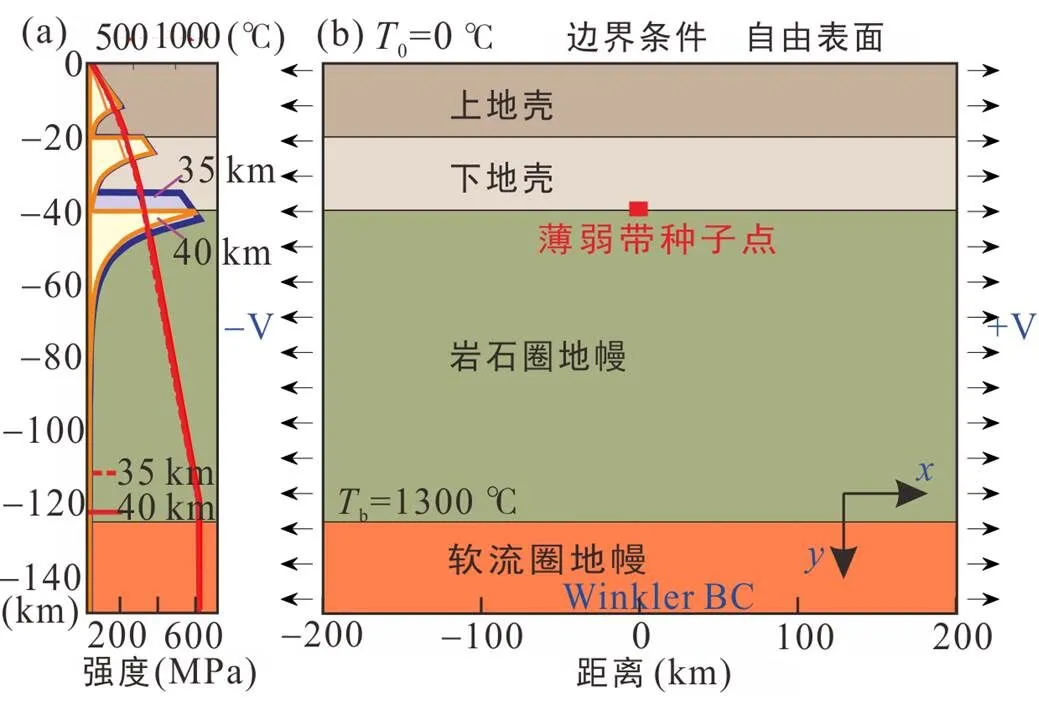
图1 数值模型初始流变结构(a)及动力学和热力学边界条件(b)
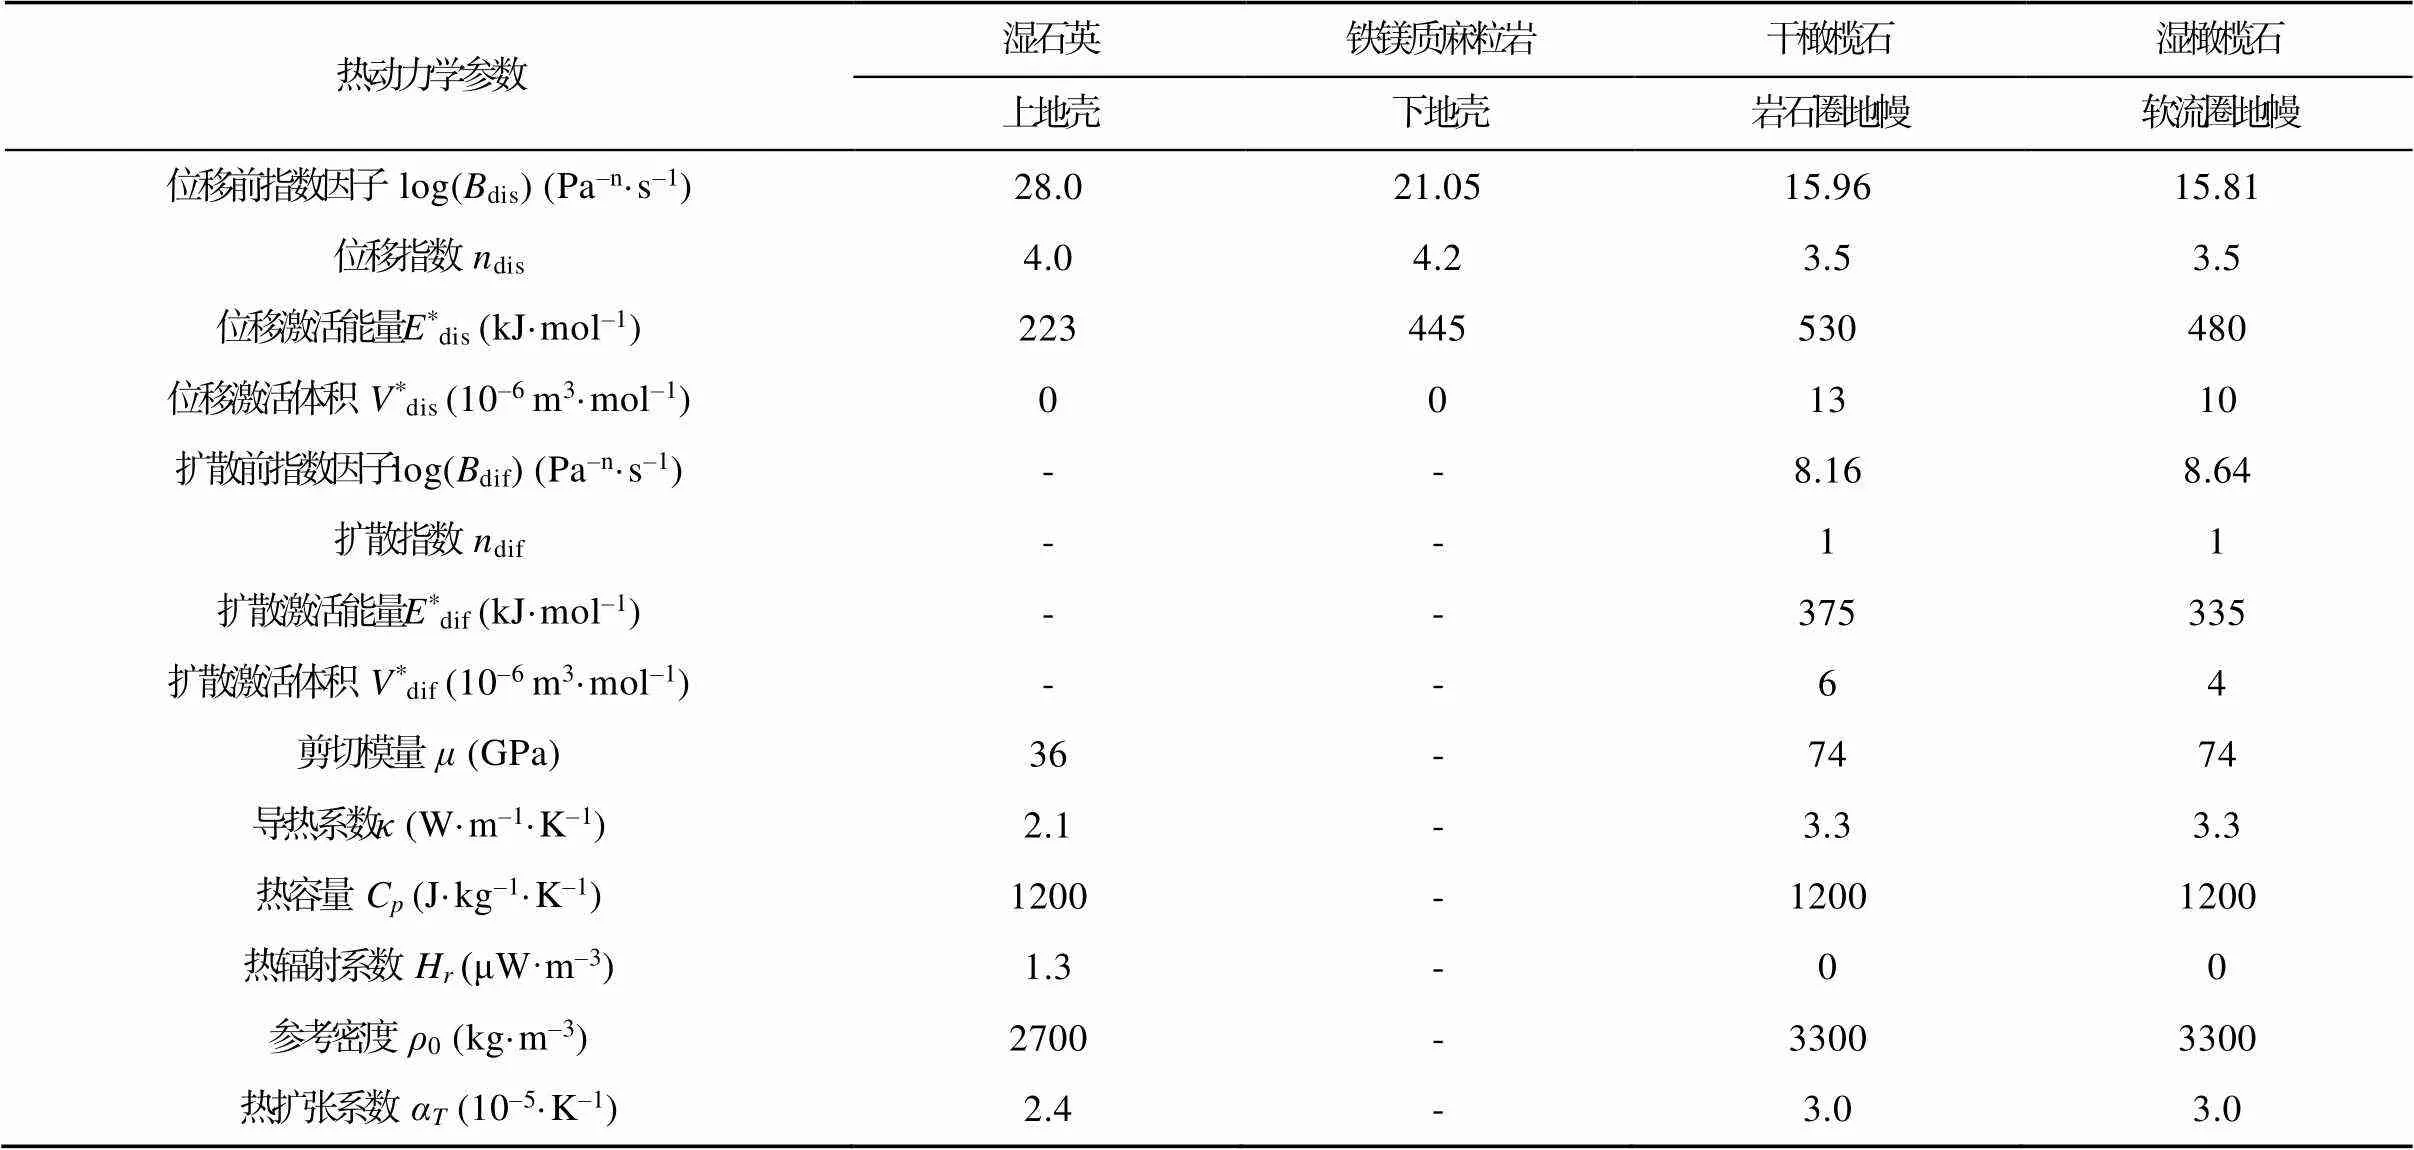
表2 数值模型实验中的基本参数
图1b中, 在模型的两侧施加的拉张速率()为半拉张速率。基于大地测量、地质重建的拉张速率及大洋中脊的扩张速率, 主要设置5组半拉张速率: 分别为2 mm/a、5 mm/a、10 mm/a、25 mm/a和50 mm/a。其中2~5 mm/a为过慢拉张速率, 10 mm/a为中度拉张速率, 25 mm/a为快速拉张速率, 50 mm/a为超快拉张速率。将5组拉张速率分别施加到两组不同流变结构的模型上, 即15 km和20 km的下地壳模型。共计进行了10组模拟实验。
3 实验结果分析
3.1 “MG35”模型实验结果
在不同拉张速率下, “MG35”模型岩石圈发生破裂, 最终形成不同形态的大陆边缘(图2)。初始裂谷形态和破裂时大陆边缘结构及宽度如图3所示。当下地壳的厚度为15 km时, 对于不同的拉张速率, 在初始裂谷阶段均为对称的窄裂谷(图3, Initial Geometry),随后裂谷发育过程中产生了结构差异。2~5 mm/a的慢拉张速率最终产生了对称型大陆边缘, 10~50 mm/a的拉张速率产生了非对称型大陆边缘(图3, Final Geometry)。
3.1.1 对称性大陆边缘
对于拉张速率为2 mm/a和5 mm/a的实验, 被动大陆边缘演化过程具有很大的相似性(图2)。本文仅以=5 mm/a的模型为例, 展示慢拉张速率下被动大陆边缘构造演化。初始裂谷时期, 变形以“薄弱带种子点”为中心对称分布, 发育了若干条正向和反向断裂, 变形主要集中在两条主断裂上, 呈窄的对称型裂谷形态(图2b, 2 Ma)。导致H块体的发育(Lavier and Manatschal, 2006; Huismans and Beaumont, 2011)。在裂谷发育过程中, H块体经历比较大的沉降, 下地壳通过剪切带减薄(图2b, 6 Ma)。600 ℃等温线穿过了下地壳, 导致下地壳温度升高, 韧性变形是主要的变形方式。随着岩浆上涌, 下地壳发生韧性变形且持续变薄(图2b, 6~9 Ma), 上地壳主要为脆性断裂, 直至发生岩石圈破裂(图2b, 11 Ma), 形成对称型共轭大陆边缘。
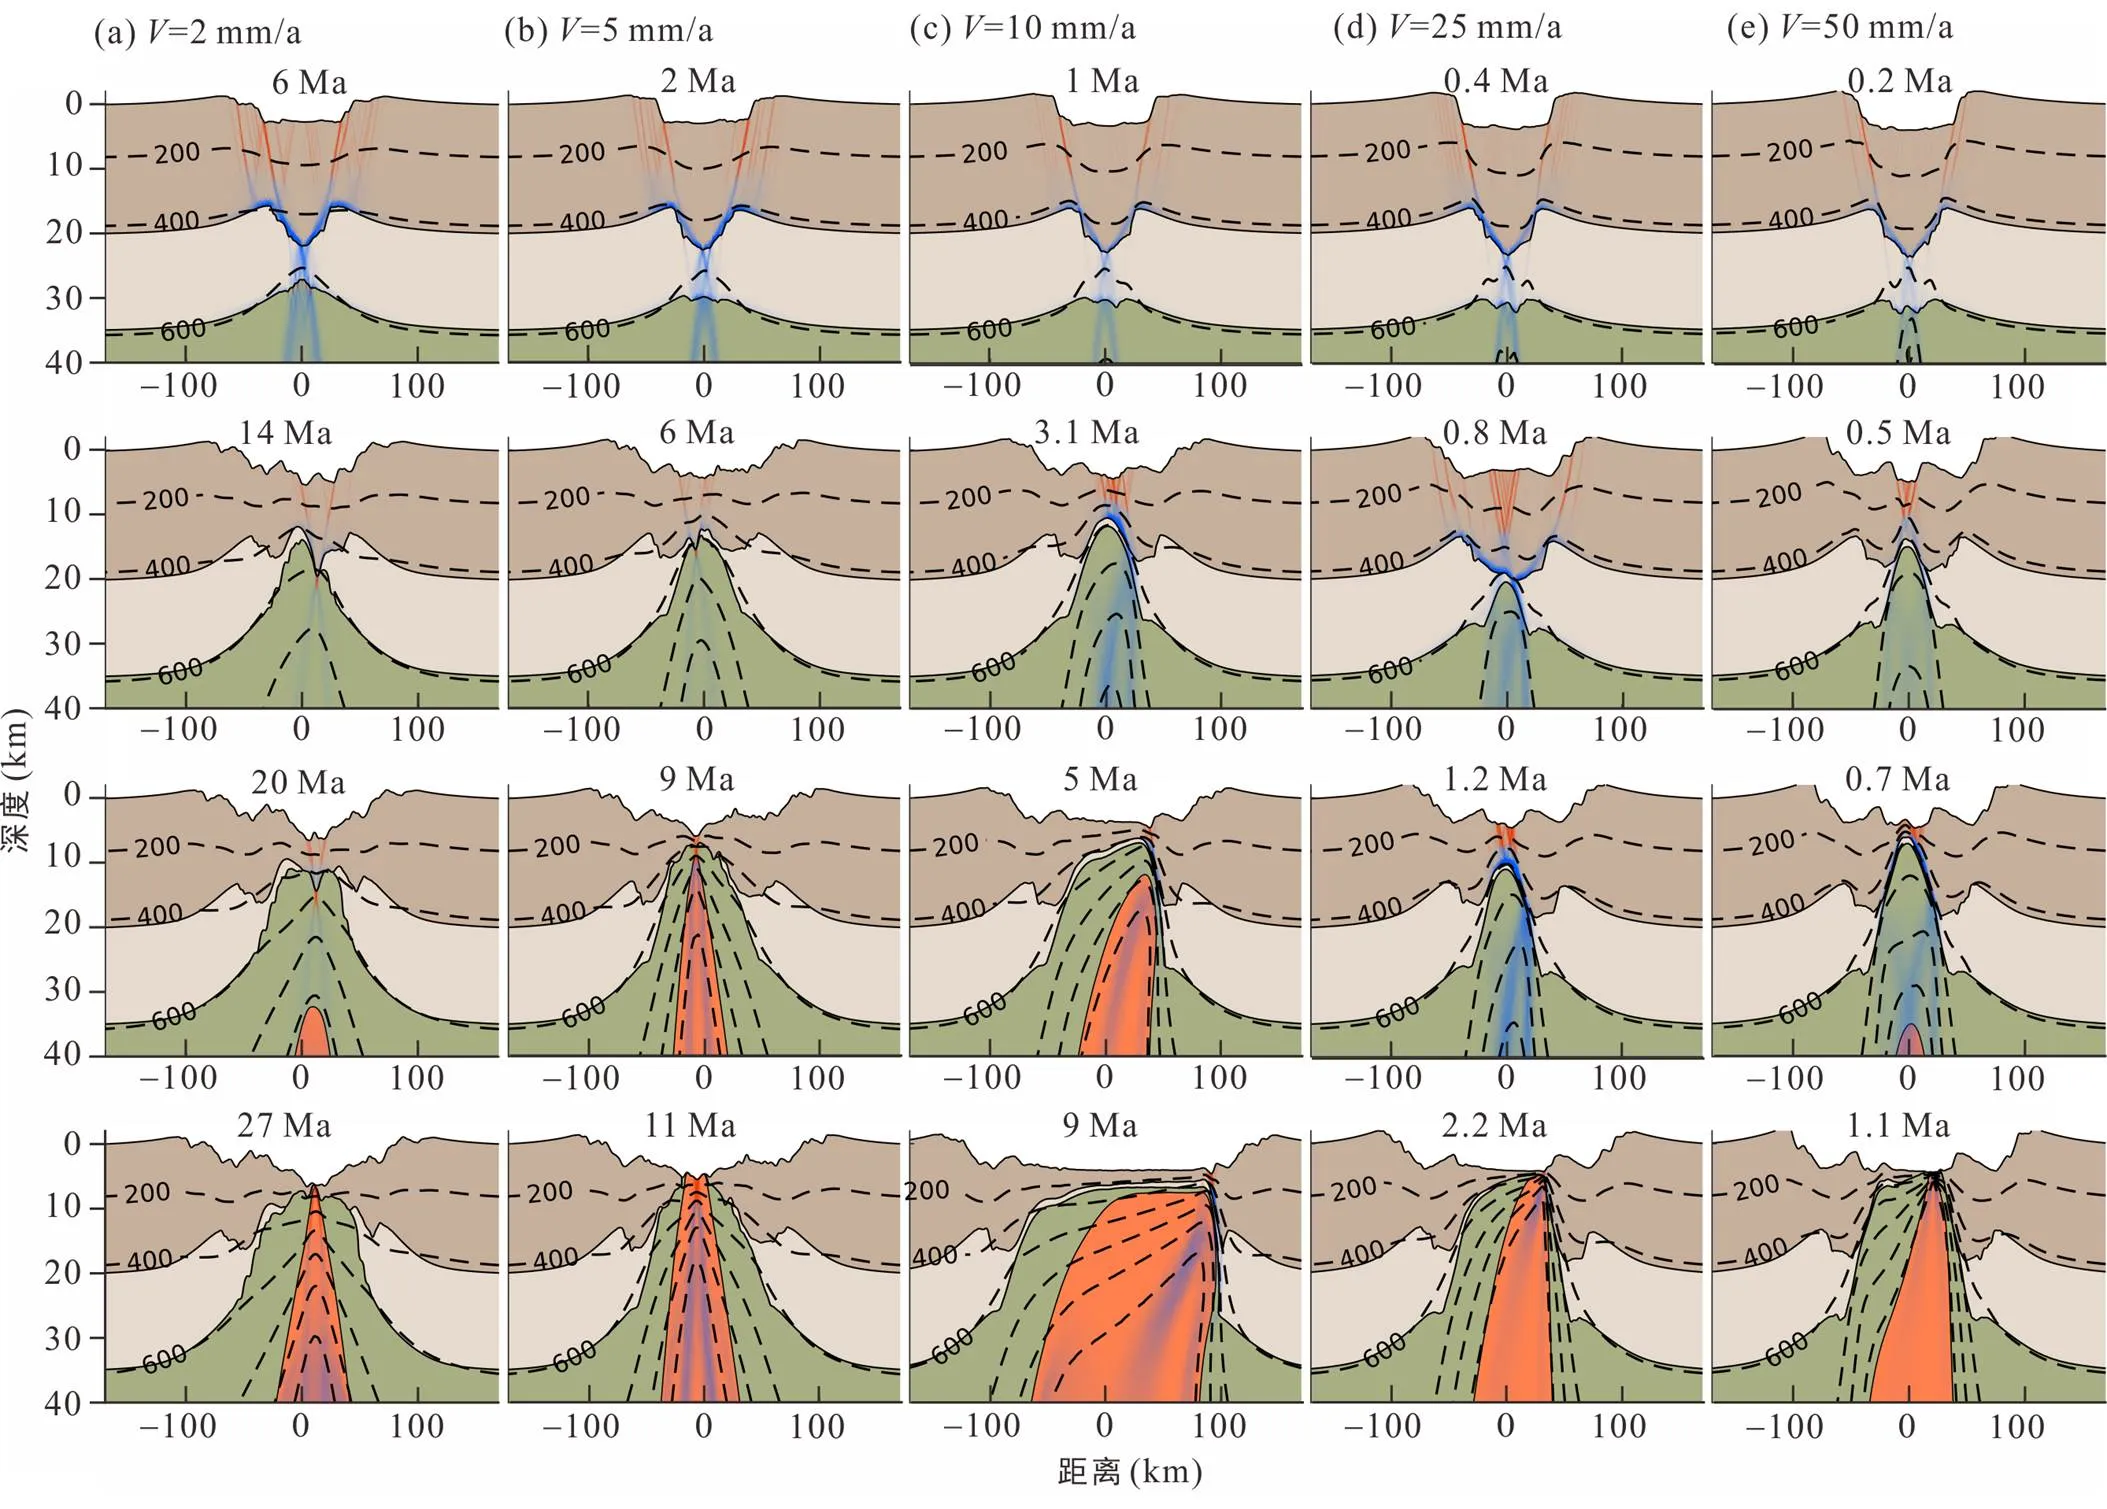
图2 “MG35”数值模型不同拉张速率下大陆边缘构造演化过程

蓝色实线代表大陆边缘的宽度, 黑色虚线为等温线, 等温线间隔为200 ℃。
虽然慢速拉张速率实验中被动大陆边缘演化过程相似, 但是在被动大陆边缘的宽度和破裂时间上仍有差异。=2 mm/a的模型中, 破裂时间是27 Ma, 被动大陆边缘宽度为117 km和76 km(图2a、3a); 而=5 mm/a模型的破裂时间是11 Ma, 被动大陆边缘宽度约为107 km和98.2 km(图2b、3b)。
3.1.2 非对称性大陆边缘
对于拉张速率为10 mm/a、25 mm/a和50 mm/a的数值模拟实验, 早期裂谷阶段构造演化与慢拉张速率实验相似, 均为窄的对称型初始裂谷(图3c~e)。与慢拉张速率实验不同的是, 下地壳发育的韧性剪切带逐渐减薄至某一厚度时, 上地壳开始减薄。并且, 随着地幔上涌, 上地壳温度不断增高, 韧性变形区增大。在下地壳上部和上地壳下部, 发育韧性剪切带, 变形作用主要集中于此(图2c, 3.1 Ma; 图2d, 0.8 Ma; 图2e, 0.5 Ma)。随着地幔的不断上涌, 地幔涌向弱的韧性剪切带一侧。另外一侧地壳发育向海方向倾斜的时序断裂(图2c, 5 Ma; 图2d, 1.2 Ma; 图2e, 0.7 Ma)。最终岩石圈发生破裂, 形成非对称型被动大陆边缘(图3c~e, Final Geometry)。特别需要指出, 当=10 mm/a时, 时序断裂发生的时间长达40 Ma, 形成非常明显的非对称大陆边缘。其机制主要是Brune et al. (2014)提出的下地壳流动导致的裂谷中心迁移作用。下地壳流动的存在需要一定的、从海方向的软流圈上涌作用加热地壳, 也需要一定的从大陆方向的热扩散来冷却大陆地壳和地幔, 所以=10 mm/a模型形成非常明显的非对称大陆边缘。而当拉张速率更快时, 如=50 mm/a, 岩石圈上涌速度也更快, 软流圈对上地壳强度的影响时间比较短, 不足以使其发生长时间的韧性变形。这也证实了拉张速率会通过影响地壳强度, 影响大陆边缘的结构。
虽然中‒超快速拉张速率实验中, 均生成了非对称型大陆边缘(图3), 但是它们在被动大陆边缘的宽度和破裂时间上存在差异。=10 mm/a模型的破裂时间是46 Ma, 被动大陆边缘宽度为996 km和172 km(图3c);=25 mm/a模型的破裂时间是3.3 Ma, 被动大陆边缘宽度约为183 km和79 km(图3d);=50 mm/a模型的破裂时间是1.1 Ma,被动大陆边缘宽度约为117 km和84 km(图3e)。
3.2 “MG40”模型实验结果
“MG40”模型在不同拉张速率下大陆边缘构造演化过程见图4, 其对应的初始裂谷形态和破裂时大陆边结缘结构及宽度见图5。当下地壳的厚度为20 km时, 虽然岩石圈强度比“MG35”模型小(图1a), 但是对于不同的拉张速率, 初始裂谷阶段形态均为对称的窄裂谷(图5); 岩石圈破裂后, 均形成非对称性大陆边缘(图5)。但是, 不同拉张速率的实验结果, 在裂谷宽度、非对称性程度以及演化过程有很多不同的地方。
初始裂谷的发育与“MG35”慢速拉张速率实验结果相似, 两条断裂发育于“薄弱带种子点”之上, 在H块体(Lavier and Manatschal, 2006)两侧形成两个初始地堑(图4), 但是地堑深度比“MG35”模型实验中更深。随着持续的拉张, 由于下地壳剪切带的发育, 下地壳减薄至尖灭, 变形主要集中在H块体上(图4)。同时, 在地壳底部发育两条向外倾斜的剪切带, 剪切带与上地壳倾向地堑中心的断裂相连。最终, 当一侧的剪切带变弱至消失, 变形主要集中于另一侧剪切带时, 裂谷迁移作用开始, 软流圈上涌。下地壳的温度升高, 黏性降低, 促使下地壳物质向上地壳底部流动。当上地壳断裂开始主导变形并且与下地壳剪切带耦合时, 时序断裂阶段开始。由于岩石圈冷却和下地壳强度增加, 地壳应变主要为脆性变形, 最终岩石圈破裂(图4)。

图4 “MG40”数值模型不同拉张速率下大陆边缘构造演化过程
在流变结构为“MG40”拉张速率实验中, 被动大陆边缘的宽度和破裂时间上存在明显的趋势。2 mm/a模型的破裂时间是53 Ma,被动大陆边缘宽度为229 km和131 km(图5a);5 mm/a模型的破裂时间是15 Ma, 被动大陆边缘宽度为166 km和73 km(图5b);10 mm/a模型的破裂时间是7.1 Ma, 被动大陆边缘宽度为162 km和69 km(图5c);25 mm/a模型的破裂时间是3.3 Ma, 被动大陆边缘宽度约为176 km和72 km(图5d);50 mm/a模型的破裂时间是1.1 Ma, 被动大陆边缘宽度约为104 km和91 km (图5e)。

图5 “MG40”数值模型不同拉张速率下破裂时大陆边结缘结构及宽度
4 讨 论
数值模拟实验结果显示, 在不同初始流变结构和拉张速率下, 初始裂谷均为窄的对称型盆地(图3、5)。但是在前人的研究中, 不同的流变结构下初始裂谷可以产生窄的或较宽的裂谷(Huismans and Beaumont, 2007)。本文模拟实验结果中缺乏宽的初始裂谷结构, 可能是由于模型中下地壳流变性质较强所导致(Andréz-Martinéz et al., 2019)。不同拉张速率下模拟实验结果表明, 快速的拉张速率会导致软流圈快速上涌, 从而导致下地壳温度升高, 在初始裂谷形成后发育韧性变形, 导致非对称型被动大陆边缘发育, 如东印度大陆边缘(Nemčok et al., 2013)。大陆边缘发育过程中, 在超慢拉张速率下, 由于破裂前热冷却的时间较长, 地壳趋向于脆性变形, 有利于对称性大陆边缘的发育。
不同流变结构和拉张速率下, 大陆岩石圈破裂发生的时间明显不同(图6)。从图中可以看出, 对于流变结构为“MG40”的模型, 随着拉张速率的增加, 破裂的时间逐渐变早, 即裂谷作用时间变短。“MG35”总体上也有这个趋势, 但是对于10 mm/a的模型, 地壳破裂的时间与总体的趋势不符。这是由于在裂谷的过程中, 温度的增高, 增加了地幔上涌处上地壳的韧性程度, 导致上地壳持续长时间韧性变形。而且, 需要注意的是慢拉张速率下, 流变结构“MG35”的模型, 岩石圈破裂时间比流变结构为“MG40”模型更早。而在超快拉张速率下, 两者的岩石圈破裂时间相近。

图6 岩石圈流变结构和拉张速率与大陆边缘破裂时间关系图
同时, 不同流变结构和拉张速率对大陆边缘结构具有明显影响(图7)。将地壳破裂的地点与裂谷肩部之间的距离, 称为被动大陆边缘的宽度(图2、4)。从图中可以看出, 随着拉张速率的增加, “MG40”模型大陆边缘的总宽度整体上呈减小的趋势。但是, “MG35”模型大陆边缘总宽度的变化趋势并不明显。在慢拉张速率(2 mm/A和5 mm/a)下, “MG35”模型大陆边缘宽度相对更窄, 主要是两种模型同裂谷作用的时间差别较大(图6)。在拉张速率为5 mm/a和50 mm/a时, 两种模型大陆边缘的对称性比较高。当10 mm/a时, 和同裂谷作用时间较长的原因一样, 大陆边缘裂谷的宽度也特别宽。当50 mm/a时, “MG35”和“MG40”两种模型宽的大陆边缘变窄, 窄的大陆边缘变宽, 大陆边缘的对称性增加, 并且, 两种大陆边缘的宽度特征相似, 大陆边缘岩石圈的结构也比较相似(图2、4)。
5 结 论
不同模型数值模拟研究表明, 拉张速率和岩石圈流变结构对被动大陆边缘形成过程中壳幔耦合产生重要影响, 进而控制大陆岩石圈张裂过程及大陆边缘结构。主要有以下几点认识:
(1) 当大陆岩石圈具有较强的下地壳流变结构时, 在张裂过程中均发育窄的初始裂谷。
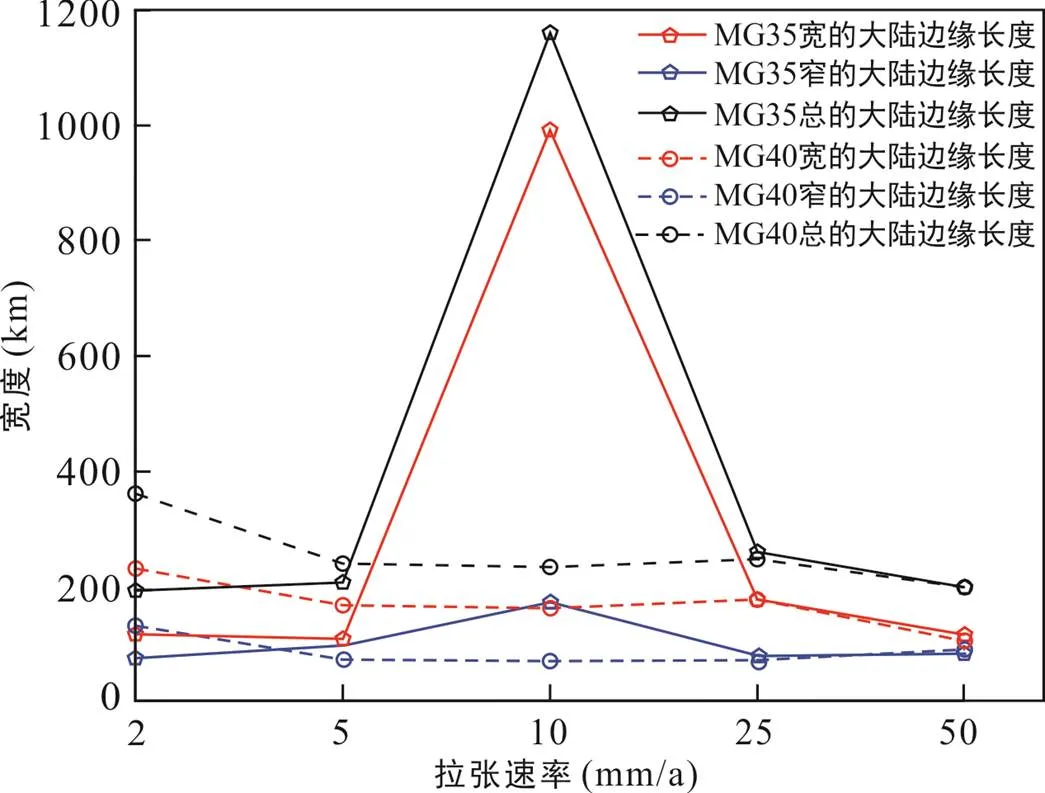
图7 岩石圈流变结构和拉张速率与大陆边缘宽度关系图
(2) 不同岩石圈流变结构和不同拉张速率下, 大陆岩石圈破裂发生的时间明显不同。拉张速率越大, 裂谷时期越短, 岩石圈破裂的越早。
(3) 当下地壳的厚度为15 km时, 较慢的拉张速率下最终产生了对称型大陆边缘, 较高的拉张速率下形成了非对称型大陆边缘。而当下地壳的厚度为20 km时, 不同的拉张速率下均形成非对称性大陆边缘。
(4) 在超慢拉张速率和超快拉张速率下大陆边缘对称性相对较高, 中‒快速拉张速率下有利于非对称大陆边缘的发育。在超快拉张速率下, 不同流变结构的大陆岩石圈可以发育类似宽度的共轭大陆边缘。
致谢:感谢中国科学院南海海洋研究所李付成副研究员和赵中贤副研究员在审稿过程中对本文提出的建设性意见和建议, 对提高文章质量起到了重要作用!
崔学军, 夏斌, 张宴华, 刘宝明, 王冉, 闫义. 2005. 地幔活动在南海扩张中的作用数值模拟与讨论. 大地构造与成矿学, 29(3): 334–338.
孙珍, 刘思青, 庞雄, 姜建群, 毛爽. 2016. 被动大陆边缘伸展‒破裂过程研究进展. 热带海洋学报, 35(1): 1–16.
吴哲, 许怀智, 杨风丽, 邵磊. 2014. 南海东北部岩石圈伸展的构造模拟约束. 大地构造与成矿学, 38(1): 71–81.
夏斌, 崔学军, 张宴华, 刘宝明, 王冉, 闫义. 2005. 南海扩张的动力学因素及其数值模拟讨论. 大地构造与成矿学, 29(3): 328–333.
Andrés-Martínez M, Morgan J P, Pérez-Gussinyé M, Rüpke L. 2015. A new free-surface stabilization algorithm for geodynamical modelling: Theory and numerical tests.ors, 246: 41–51.
Andrés-Martínez M, Pérez-Gussinyé M, Armitage J, Morgan J P. 2019. Thermomechanical implications of sediment transport for the architecture and evolution of continental rifts and margins., 38(2): 641–665.
Beaumont C, Ings S J. 2012. Effect of depleted continental lithosphere counterflow and inherited crustal weakness on rifting of the continental lithosphere: General results., 117, B08407.
Bendick R, McClusky S, Bilham R, Asfaw L, Klemperer S. 2006. Distributed Nubia–Somalia relative motion and dike intrusion in the Main Ethiopian Rift., 165(1): 303–310.
Bennett R A, Wernicke B P, Davis J L. 1998. Continuous GPS measurements of contemporary deformation across the northern Basin and Range province., 25(4): 563–566.
Berglund H T, Sheehan A F, Murray M H, Roy M, Lowry A R, Nerem R S, Blume F. 2012. Distributed deformation across the Rio Grande rift, Great Plains, and Colorado plateau., 40(1): 23–26.
Brun J P. 1999. Narrow rifts versus wide rifts: Inferences for the mechanics of rifting from laboratory experiments.:,, 357(1753): 695–712.
Brune S, Williams S E, Butterworth N P, Müller R D. 2016. Abrupt plate accelerations shape rifted continental margins., 536(7615): 201–204.
Buck W R. 1991. Modes of continental lithospheric extension.:, 96(B12): 20161–20178.
Buck W R, Lavier L L, Poliakov A N. 1999. How to make a rift wide?:,, 357(1753): 671–693.
Buck W R, Poliakov A N. 1998. Abyssal hills formed by stretching oceanic lithosphere., 392(6673): 272– 275.
Burov E, Poliakov A. 2001. Erosion and rheology controls on synrift and postrift evolution: Verifying old and new ideas using a fully coupled numerical model., 106(B8): 16461– 16481.
Calais E, Lesne O, Déverchère J, San’kov V, Lukhnev A, Miroshnitchenko A, Buddo V, Levi K, Zalutzky V, Bashkuev Y. 1998. Crustal deformation in the Baikal rift from GPS measurements., 25(21): 4003–4006.
Dabrowski M, Krotkiewski M, Schmid D W. 2008. MILAMIN: MATLAB-based finite element method solver for large problems.,,, 9(4), 2007GC001719.
Franke D. 2013. Rifting, lithosphere breakup and volcanism: Comparison of magma-poor and volcanic rifted margins., 43: 63–87.
Golombek M P, McGILL G E, Brown L. 1983. Tectonic and geologic evolution of the Espanola Basin, Rio Grande Rift: Structure, rate of extension, and relation to the state of stress in the western United States., 94(1–4): 483–507.
Hammond W C, Thatcher W. 2004. Contemporary tectonic deformation of the Basin and Range province, western United States: 10 years of observation with the Global Positioning System., 109(B8). doi: 10.1029/2003JB002746
Heine C, Zoethout J, Müller R D. 2013. Kinematics of the South Atlantic rift., 4(2): 215–253.
Huet B, Le Pourhiet L, Labrousse L, Burov E B, Jolivet L. 2011. Formation of metamorphic core complex in inherited wedges: A thermomechanical modelling study., 309(3–4): 249–257.
Huismans R, Beaumont C. 2011. Depth-dependent extension, two-stage breakup and cratonic underplating at rifted margins., 473(7345): 74–78.
Huismans R S, Beaumont C. 2002. Asymmetric lithospheric extension: The role of frictional plastic strain softening inferred from numerical experiments., 30(3): 211–214.
Huismans R S, Beaumont C. 2007. Roles of lithospheric strain softening and heterogeneity in determining the geometry of rifts and continental margins.,,, 282(1): 111–138.
Huismans R S, Beaumont C. 2008. Complex rifted continental margins explained by dynamical models of depth- dependent lithospheric extension., 36(2): 163– 166.
Huismans R S, Podladchikov Y Y, Cloetingh S. 2001. Transition from passive to active rifting: Relative importance of asthenospheric doming and passive extension of the lithosphere., 106(B6): 11271–11291.
Jarvis G T, McKenzie D P. 1980. Sedimentary basin formation with finite extension rates., 48(1): 42–52.
Kaus M, Kowal J, Sauer D U. 2010. Modelling the effects of charge redistribution during self-discharge of supercapacitors., 55(25): 7516–7523.
Lavier L L, Manatschal G. 2006. A mechanism to thin the continental lithosphere at magma-poor margins., 440(7082): 324–328.
Le Pourhiet L, Burov E, Moretti I. 2004. Rifting through a stack of inhomogeneous thrusts (the dipping pie concept)., 23(4), doi: 10.1029/2003TC001584
Manatschal G. 2004. New models for evolution of magma- poor rifted margins based on a review of data and concepts from West Iberia and the Alps., 93(3): 432–466.
McClusky S, Reilinger R, Ogubazghi G, Amleson A, Healeb B, Vernant P, Sholan J, Fisseha S, Asfaw L, Bendick R, Kogan L. 2010. Kinematics of the southern Red Sea — Afar Triple Junction and implications for plate dynamics., 37(5), doi: 10.1029/ 2009GL041127
McKenzie D. 1978. Active tectonics of the Alpine — Himalayanbelt: The Aegean Sea and surrounding regions., 55(1): 217–254.
Müller R D, Sdrolias M, Gaina C, Roest W R. 2008. Age, spreading rates, and spreading asymmetry of the world’s ocean crust.,,, 9(4), 2007GC001743
Nemčok M, Sinha S T, Stuart C J, Welker C, Choudhuri M, Sharma S P, Misra A A, Sinha N, Venkatraman S. 2013. East Indian margin evolution and crustal architecture: Integration of deep reflection seismic interpretation and gravity modelling.,,, 369(1): 477–496.
Nemčok M, Stuart C, Rosendahl B R, Welker C, Smith S, Sheya C, Sinha S T, Choudhuri M, Allen R, Reeves C, Sharma S P. 2012. Continental break-up mechanism; lessons from intermediate- and fast-extension settings.,,, 369(1): 373–401.
Pérez-Gussinyé M, Andrés-Martínez M, Araújo M, Xin Y, Armitage J, Morgan J P. 2020. Lithospheric strength and rift migration controls on synrift stratigraphy and breakup unconformities at rifted margins: Examples from numerical models, the Atlantic and South China Sea margins., 39(12), 2020TC006255.
Pérez-Gussinyé M, Reston T J, Morgan J P. 2001. Serpentinization and magmatism during extension at non-volcanic margins: The effect of initial lithospheric structure.,,, 187(1): 551–576.
Péron-Pinvidic G, Manatschal G. 2009. The final rifting evolution at deep magma-poor passive margins from Iberia-Newfoundland: A new point of view., 98(7): 1581–1597.
Reston T J. 2009. The structure, evolution and symmetry of the magma-poor rifted margins of the North and Central Atlantic: A synthesis., 468(1–4): 6–27.
Snow J K, Wernicke B P. 2000. Cenozoic tectonism in the central Basin and Range; magnitude, rate, and distribution of upper crustal strain., 300(9): 659–719. doi: 10.2475/ajs.300.9.659
Spohn T, Schubert G. 1983. Convective thinning of the lithosphere: A mechanism for rifting and mid-plate volcanism on Earth, Venus, and Mars., 94(1–4): 67–90.
Tesfaye S, Harding D J, Kusky T M. 2003. Early continental breakup boundary and migration of the Afar triple junction, Ethiopia., 115(9): 1053–1067.
Vigny C, Huchon P, Ruegg J C, Khanbari K, Asfaw L M. 2006. Confirmation of Arabia slow motion by new GPS data in Yemen., 111(B2), doi: 10.1029/2004JB003229
Wernicke B. 1985. Uniform-sense normal simple shear of the continental lithosphere., 22(1): 108–125.
Wernicke B, Burchfiel B C. 1982. Modes of extensional tectonics., 4(2): 105–115.
Woodward L A. 1977. Rate of crustal extension across the Rio Grande rift near Albuquerque, New Mexico., 5(5): 269–272.
Impact of Extension Rate and Crustal Rheology on the Evolution of Passive Continental Margins
XIN Yanfang1, 2, 3, 4, YAN Yi1, 2, 5, 6*, Marta Pérez-Gussinyé4, LUO Yang7
(1. Key Laboratory of Ocean and Marginal Sea Geology, Guangzhou Institute of Geochemistry, Chinese Academy of Sciences, Guangzhou 510640, Guangdong, China; 2. CAS Center for Excellence in Deep Earth Science, Guangzhou 510640, Guangdong, China; 3. University of Chinese Academy of Sciences, Beijing 100049, China; 4. Marum-center for Marine Environmental Sciences, University of Bremen, Germany; 5. Southern Marine Science and Engineering Guangdong Laboratory (Guangzhou),Guangzhou 511458, Guangdong, China; 6. Innovation Academy of South China Sea Ecology and Environmental Engineering, Chinese Academy of Sciences, Guangzhou 510301, Guangdong, China; 7. Department of Developing and Planning in Shengli Oil Field, SINOPEC Group, Dongying 257001, Shandong, China)
Continental rifted margins, which record the processes from continental lithosphere extension and thinning to seafloor spreading, are a frontier research area in solid earth science. In order to investigate the influence of lithospheric extension rate and crustal structure on the configuration of continental rifted margins, ten sets of high-resolution two-dimensional elastic-visco-plastic thermodynamic numerical simulations with different crustal thicknesses and extension rates are carried out. In all models, the thickness of the quartz upper crust is set at 20 km, while the thickness of the crust is mainly controlled by the thickness of the mafic lower crust. When the thickness of the crust is 35 km, symmetric continental margins are eventually reproduced at lower extension rates, while asymmetric continental margins are formed at higher tension rates. The asymmetry reaches its maximum at an extension rate of 10 mm/a, with the wider side of the rift margin reaching a width of nearly 1000 km, while the narrower side of the rift margin is less than 100 km wide. The formation of this type of asymmetric continental rift margin is mainly caused by the oceanward migration of the spreading center. The oceanward migration of the spreading center is driven by the lower crustal flow formed at the root of the fault. The formation of the lower crustal flow requires that the upwelling of the asthenosphere to heat and weaken the fault roots while allowing sufficient time for thermal diffusion to cool and harden the lithosphere on the continental side. When the thickness of the lower crust of the model is 40 km, asymmetric continental margins are formed at different extension rates. Models with relatively high extension rates, asymmetric rift margins are also formed by the migration of the rift center. When the model has a very slow half extension rate (2 mm/a), the upper crust mainly develops brittle fractures due to the long lithospheric rupture time and high thermal cooling rate of the lithosphere, and the crust-mantle coupling is high, which leads to the formation of hyperextended rifted margins with a relatively wide width. On the contrary, continental margins tend to form symmetric configuration at ultra-slow half extension rates (2 – 5 mm/a) and ultra-fast half extension rates (50 mm/a).
passive continental margins; extension rate; lithosphere rheology; numerical modelling
P542; TE352
A
1001-1552(2022)02-0191-011
2021-03-09;
2021-03-31
国家自然科学基金项目(41676048、U1701641)、南方海洋科学与工程广东省实验室团队项目(GML 2019ZD0205)和中国科学院南海 生态环境工程创新研究院自主部署项目(ISEE2020YB07)联合资助。
信延芳(1991–), 女, 博士研究生, 构造地质学专业。E-mail: xinyanfang1990@163.com
闫义(1974–), 男, 研究员, 主要从事边缘海构造与盆地演化方面的研究工作。E-mail: yanyi@gig.ac.cn
