Possible contribution of Arctic sea ice decline to intense warming over Siberia in June
2022-04-26YingZhngMengqiZhngJiehuDongChenToWng
Ying Zhng , , , , Mengqi Zhng , Jiehu M , , , Dong Chen , To Wng , ,
a Climate Change Research Center, Institute of Atmospheric Physics, Chinese Academy of Sciences, Beijing, China
b Nansen-Zhu International Research Center Centre, Institute of Atmospheric Physics, Chinese Academy of Sciences, Beijing, China
c Key Laboratory of Meteorological Disaster, Ministry of Education/Collaborative Innovation Center on Forecast and Evaluation of Meteorological Disasters, Nanjing University of Information Science & Technology, Nanjing, China
Keywords:Intense Siberian warming Arctic sea ice decline Surface radiation flux Turbulent heat flux
ABSTRACT Siberia experienced intense heat waves in 2020, and this unusual warming may have caused more wildfires and losses of permafrost than normal, both of which can be devastating to ecosystems. Based on observational data, this paper shows that there was an intense warming trend over Siberia (60°—75°N, 70°—130°E) in June during 1979—2020. The linear trend of the June surface air temperature is 0.90°C/10 yr over Siberia, which is much larger than the area with the same latitudes (60°—75°N, 0°—360°, trend of 0.46°C/10 yr). The warming over Siberia extends from the surface to about 300 hPa. Increased geopotential height in the mid-to-upper troposphere plays an important role in shaping the Siberian warming, which favors more shortwave radiation reaching the surface and further heating the overlying atmosphere via upward turbulent heat flux and longwave radiation. The Siberian warming is closely related to Arctic sea-ice decline, especially the sea ice over northern Barents Sea and Kara Sea. Numerical experiments carried out using and atmospheric general circulation model (IAP-AGCM4.1)confirmed the contribution of the Arctic sea-ice decline to the Siberian warming and the related changes in circulations and surface fluxes.
1. Introduction
Siberia suffered intense heat waves in 2020. The meteorological station at Verkhoyansk, a Russian Arctic town, reported a new record temperature of 38 °C on 20 June 2020 ( WMO, 2021 ; Overland and Wang, 2020 ). These extreme events attracted public attention, since unusual warming over Siberia may result in wildfires and losses of permafrost, both of which can be devastating for ecosystems and have substantial impacts on the whole climate system. Based on observational data and climate model simulations, Ciavarella et al. (2021) showed that human-induced climate change dramatically increased the probability of occurrence and magnitude of Siberian heat waves in 2020. In the present study, we analyzed the climate features of early summer warming over Siberia and investigated the possible contribution of Arctic sea ice decline to the warming trend.
Along with global warming, the rapid decline of Arctic sea ice is one of the most important features in recent decades. Arctic sea ice decline has both local and remote impacts on the climate system( Vihma, 2014 ; Gao et al., 2015 ). Locally, Arctic sea-ice loss has been found to make an important contribution to the enhanced warming over the Arctic —the so-called “Arctic amplification ” ( Screen and Simmonds, 2010 ; Dai et al., 2019 ). Remotely, sea ice decline has been connected with Eurasian cooling in winter, albeit this remains controversial owing to discrepancies among modeling and observational studies( Liu et al., 2012 ; Wu et al., 2017 ; Zhang et al., 2018 ; Mori et al., 2019 ;Screen and Blackport, 2019 ) .
Previous work on connections in temperature between the Arctic and Eurasia has mainly focused on the cold season. Recently, Arctic sea ice and temperature anomalies have also been linked to Eurasian temperature changes in other seasons. Chen and Wu (2017) found that early autumn Arctic sea ice anomalies have impacts on spring Eurasian temperature variations. Wu and Francis (2019) found that East Asian heat waves are closely linked to summer Arctic cold anomalies. However,the connection between Arctic sea ice and summer temperature changes over Siberia remains unclear. This study investigated the connection between Arctic sea ice decline and the warming trend over Siberia in June and the related circulation changes.
2. Data, methods, and model
2.1. Data and methods
The latest version of the Met Office Hadley Centre/Climatic Research Unit global surface temperature dataset (HadCRUT5; Morice et al.,2021 ; https://www.metoffice.gov.uk/hadobs/hadcrut5 ) was employed to assess the change in surface air temperature (SAT). HadCRUT5 combines sea surface temperature measurements over the ocean from ships and buoys and near-surface air temperature measurements over land from weather stations relative to the period 1961—1990, which is on a regular 5° × 5° grid from 1850 to the present day. The Hadley Centre Sea Ice and Sea Surface Temperature dataset (HadISST2.2.0.0; Titchner and Rayner, 2014 ; downloaded from https://www.metoffice.gov.uk/hadobs/hadisst2 in January 2021) was used to evaluate the change in sea-ice concentration, which is on a 1° × 1° grid since 1850.
The other monthly atmospheric data are from the European Centre for Medium-Range Weather Forecasts (ECMWF) ERA5 Reanalysis ( Hersbach et al., 2020 ; https://www.ecmwf.int/en/forecasts/datasets/reanalysis-datasets/era5 ). The variables include air temperature, geopotential, surface net shortwave flux, surface net longwave flux,surface sensible heat flux, and surface latent heat flux, with a resolution of 1° × 1° during 1979—2020.
The area of 60°—75°N and 70°—130°E (boxes in Fig. 1 ) defines Siberia in this paper. The linear trends were estimated by calculating regression coefficients via the least-squares method on the time dimension. The Student’st-test was used for significance testing.
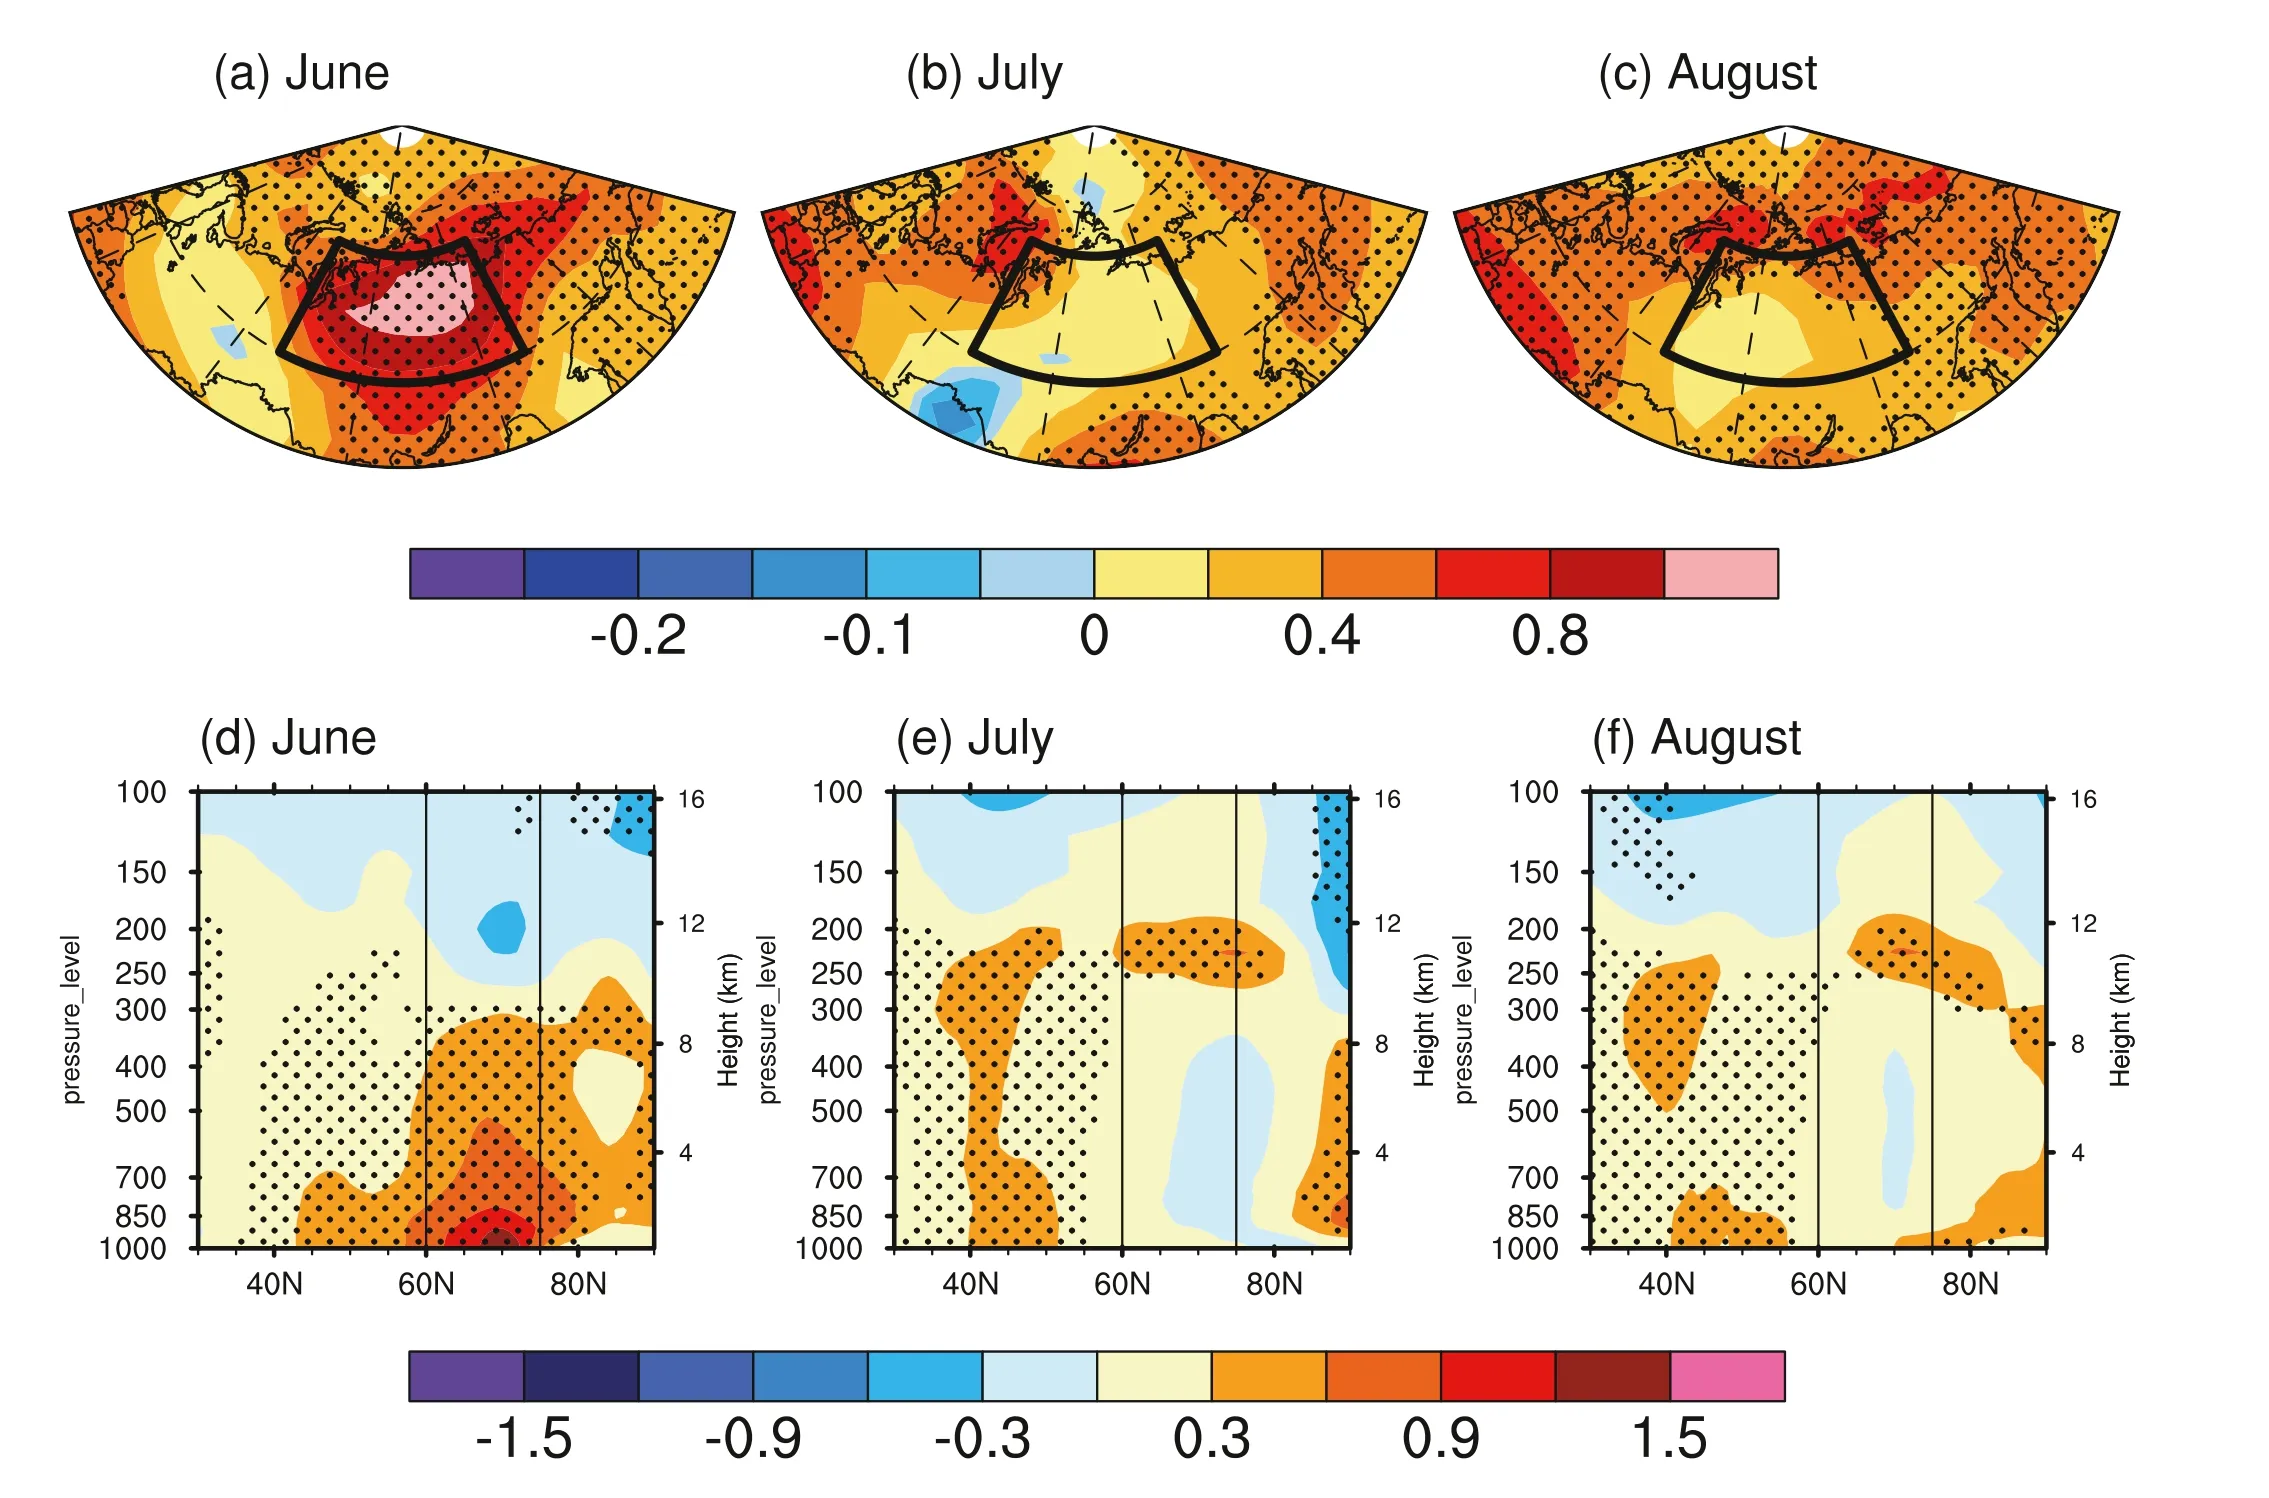
Fig. 1. Linear trends of SAT (units: °C/10 yr) in (a) June, (b) July, and (c) August during 1979—2020. Latitude—pressure section of linear trends of air temperature(units: °C/10 yr) in (d) June, (e) July, and (f) August averaged over 70°—130°E during 1979—2020. Stippled regions indicate the trends are significant at the 0.1 level.
2.2. Model
Atmospheric general circulation model (AGCM) experiments were conducted to estimate the possible contribution of sea ice to the Siberian warming. The model used in this study was the Atmospheric General Circulation Model of the Institute of Atmospheric Physics, version 4.1(IAP-AGCM4.1; Sun et al., 2012 ). It has 30 vertical levels with the top at 2.2 hPa and a horizontal resolution of 1.4° × 1.4°.
3. Results
3.1. Intense warming over Siberia in June
Fig. 1 (a—c) shows the spatial distributions of the linear trends in SAT for summer months over northern Eurasia. Significant warming trends can be seen over Siberia in June, whereas the trends are weakened and insignificant over the region in July and August. The linear trend of June SAT averaged over Siberia reaches up to 0.90°C/10 yr during 1979—2020. It is widely known that, due to increased anthropogenic emissions of greenhouse gases, almost the entire globe has experienced surface warming during the past several decades ( Hartmann et al., 2013 ).The linear trend of June SAT averaged over the area with the same latitudes (60°—75°N, 0°—360°) is 0.46°C/10 yr during 1979—2020. This result indicates that the warming trend over Siberia largely exceeds the zonal average warming trend at the same latitude. Fig. 1 (d—f) displays the vertical structures of the linear trends in air temperature from the surface to 100 hPa averaged along 70°—130°E. The significant Siberian warming in June extends from the surface to about 300 hPa, with larger magnitude and zonal spread at lower levels. Similar to the SAT, there are generally no significant trends in the tropospheric temperature over Siberia in July and August. The above results suggest that there was an intense and deep warming trend over Siberia in June during 1979—2020.
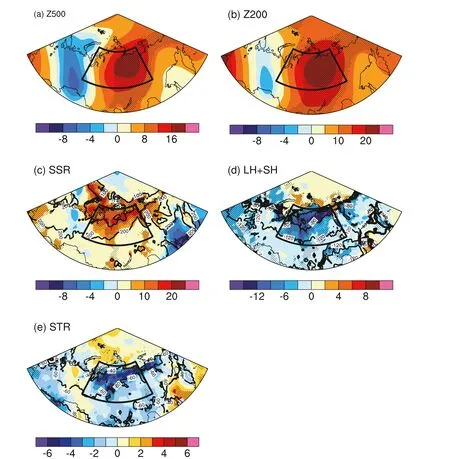
Fig. 2. Linear trends of (a) 500 hPa geopotential height ( Z 500 ; units: m/10 yr), (b) 200 hPa geopotential height ( Z 200 ; units: m/10 yr), (c) surface net downward shortwave flux (SSR; units: W/10 yr), (d) surface turbulent heat flux (LH + SH; latent flux plus sensible flux; units: W/10 yr), and (e) surface net upward longwave flux (STR; units: W/10 yr) in June during 1979—2020. Stippled regions indicate the trends are significant at the 0.1 level. Contours in (c—e) indicate the climatology of SSR (units: W), LH + SH (units: W), and STR (units: W) in June during 1979—2020, respectively. Positive values indicate the direction of flux is downwards.
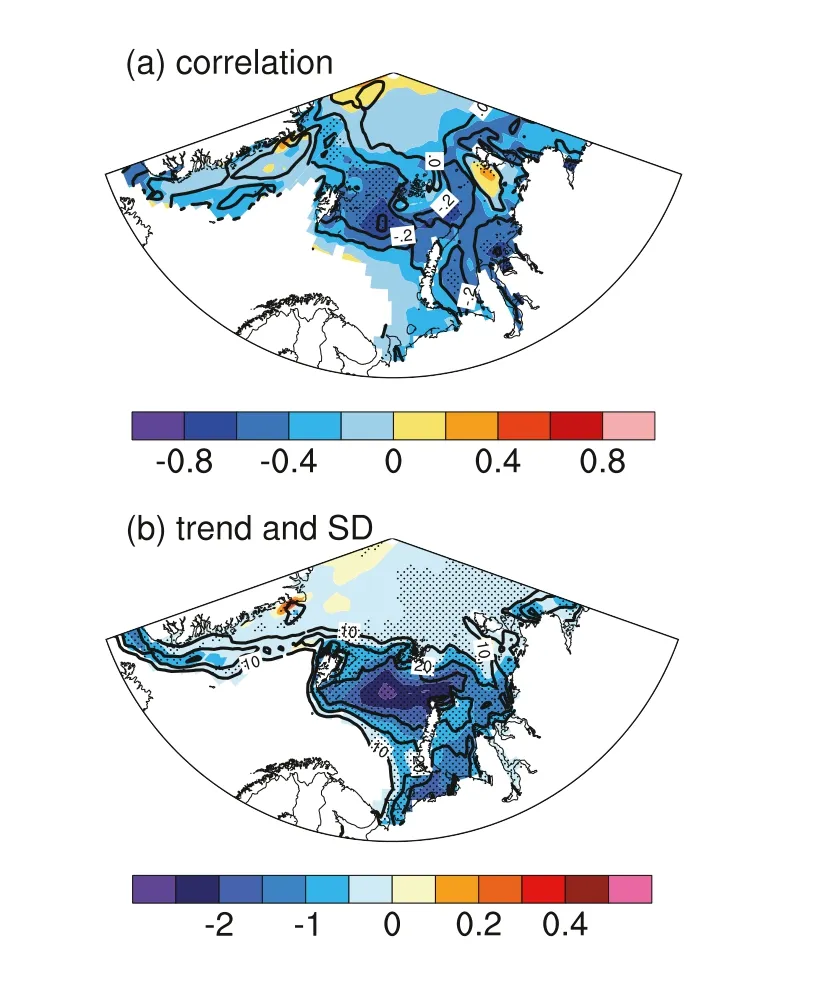
Fig. 3. (a) Simultaneous correlation coefficient of non-detrended (shading) and detrended (contours) sea ice concentration and Siberian SAT in June during 1979—2020. Stippled regions indicate the correlation coefficients between the detrended sea ice concentration and Siberian SAT are significant at the 0.1 level.(b) Linear trends (shading, units: %/yr) and standard deviation (contours; units:%) of sea ice concentration in June during 1979—2020. Stippled regions indicate the trends are significant at the 0.1 level.
3.2. Trends in circulations and surface fluxes
In this section, the linear trends of atmospheric circulations, surface radiation fluxes, and turbulent heat flux in June are presented. Significant increasing trends are apparent in the geopotential height at 500 hPa and 200 hPa over Siberia, with the centers located in the eastern part of the region ( Fig. 2 (a, b)). This indicates that an increase in geopotential height has prevailed in the mid-to-upper troposphere over Siberia,which would favor more anticyclonic circulations in that region. Such an increase in high pressure and anticyclonic activity will then lead to more solar radiation reaching the surface and further heating of the surface. Accordingly, significant increasing trends can be found over Siberia in the surface downward shortwave flux, turbulent heat flux, and upward longwave flux ( Fig. 2 (c—e)). The changes in surface fluxes indicate that the surface is absorbing more solar radiation and then warming up the overlying atmosphere through turbulence and longwave radiation,which is an important process responsible for the intense warming over Siberia.
3.3. Connection between Arctic sea-ice decline and Siberian warming
Arctic sea ice has decreased rapidly in the past several decades,which has had profound impacts on the global climate system. In this section, the connection between sea ice decline and the intense Siberian warming is investigated using observation/reanalysis data. Fig. 3 (a)presents the simultaneous correlation coefficients of sea ice concentration over the Eurasian Arctic with the June SAT averaged over Siberia.The Eurasian Arctic sea ice concentration is generally negatively correlated with the Siberian SAT, with the largest correlation over the northern Barents Sea and Kara Sea. The negative correlations over the northern Barents Sea and Kara Sea are still significant after removing the linear trends. Fig. 3 (b) depicts the trends and standard deviation of sea-ice concentration in June during 1979—2020, revealing there to be generally decreasing trends in the Eurasian Arctic sea ice concentration. The maximum center of the linear trends and standard deviation is over the northern Barents Sea and Kara Sea. These results indicate that the intense warming over Siberia is closely related to the sea ice decline over the northern Barents Sea and Kara Sea, which is also the region with large decreasing trend and variation.
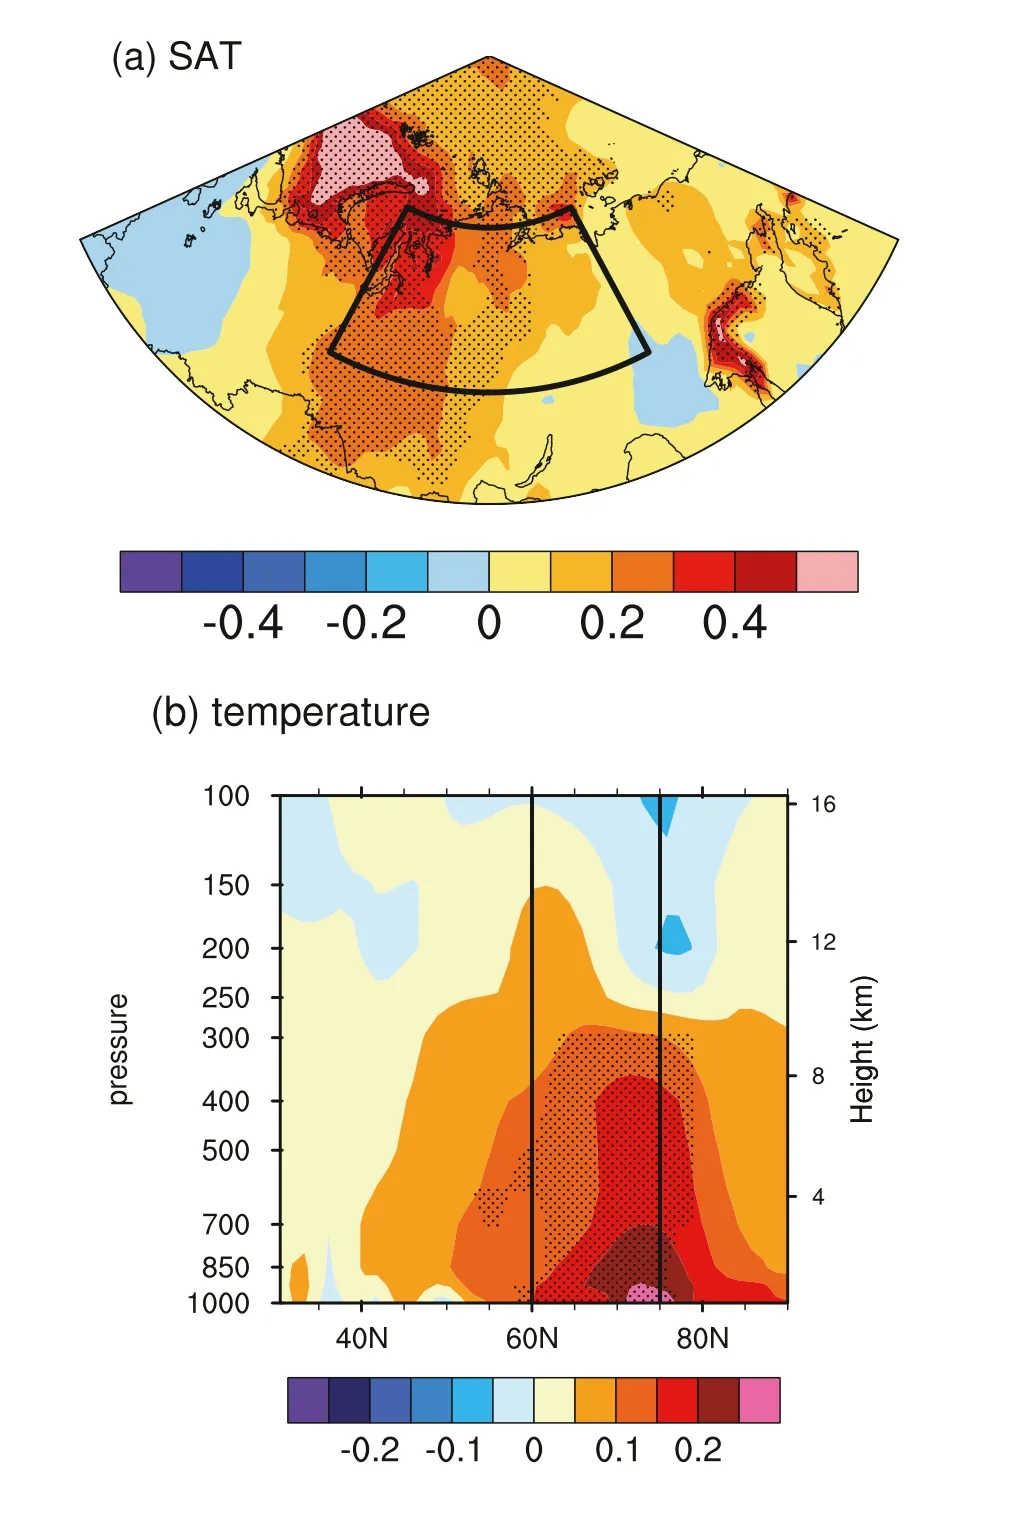
Fig. 4. (a) Linear trends for SAT in June in EXP1-EXP2 (units: °C/10 yr). (b)Latitude—pressure section of linear trends of air temperature (units: °C/10 yr)averaged over 70°—130°E. Stippled regions indicate the trends are significant at the 0.1 level.
3.4. AGCM simulation
To confirm the contribution of sea ice decline to the intense warming over Siberia, two sets of numerical experiments were conducted. Experiment I (EXP1) was forced with observed daily sea surface temperature and sea ice, while experiment II (EXP2) was similar to EXP1 but the sea ice data were replaced with the multi-year daily mean climatology. The climate impacts of sea ice change could be isolated by the difference between the two experiments (the former minus the latter, referred to as EXP1-EXP2). To reduce the impact of atmospheric internal variability,there were 15 members for each experiment. The simulation period was 1979—2015.
Fig. 4 (a) shows the spatial distribution of June SAT trends in EXP1-EXP2. Significant warming trends are also found over Siberia, albeit the warming center is shifted westward compared with that in the observation ( Fig. 1 (a)). The vertical structure of the air temperature trend in EXP1-EXP2 also shows significant warming over Siberia, extending from the surface to about 300 hPa, with larger magnitude at lower levels. However, the warming is shifted polewards compared to that in the observation ( Fig. 1 (b)). The simulated temperature trends over Siberia generally resemble those in the observation, which verifies the contribution of sea-ice decline to the intense warming over Siberia.
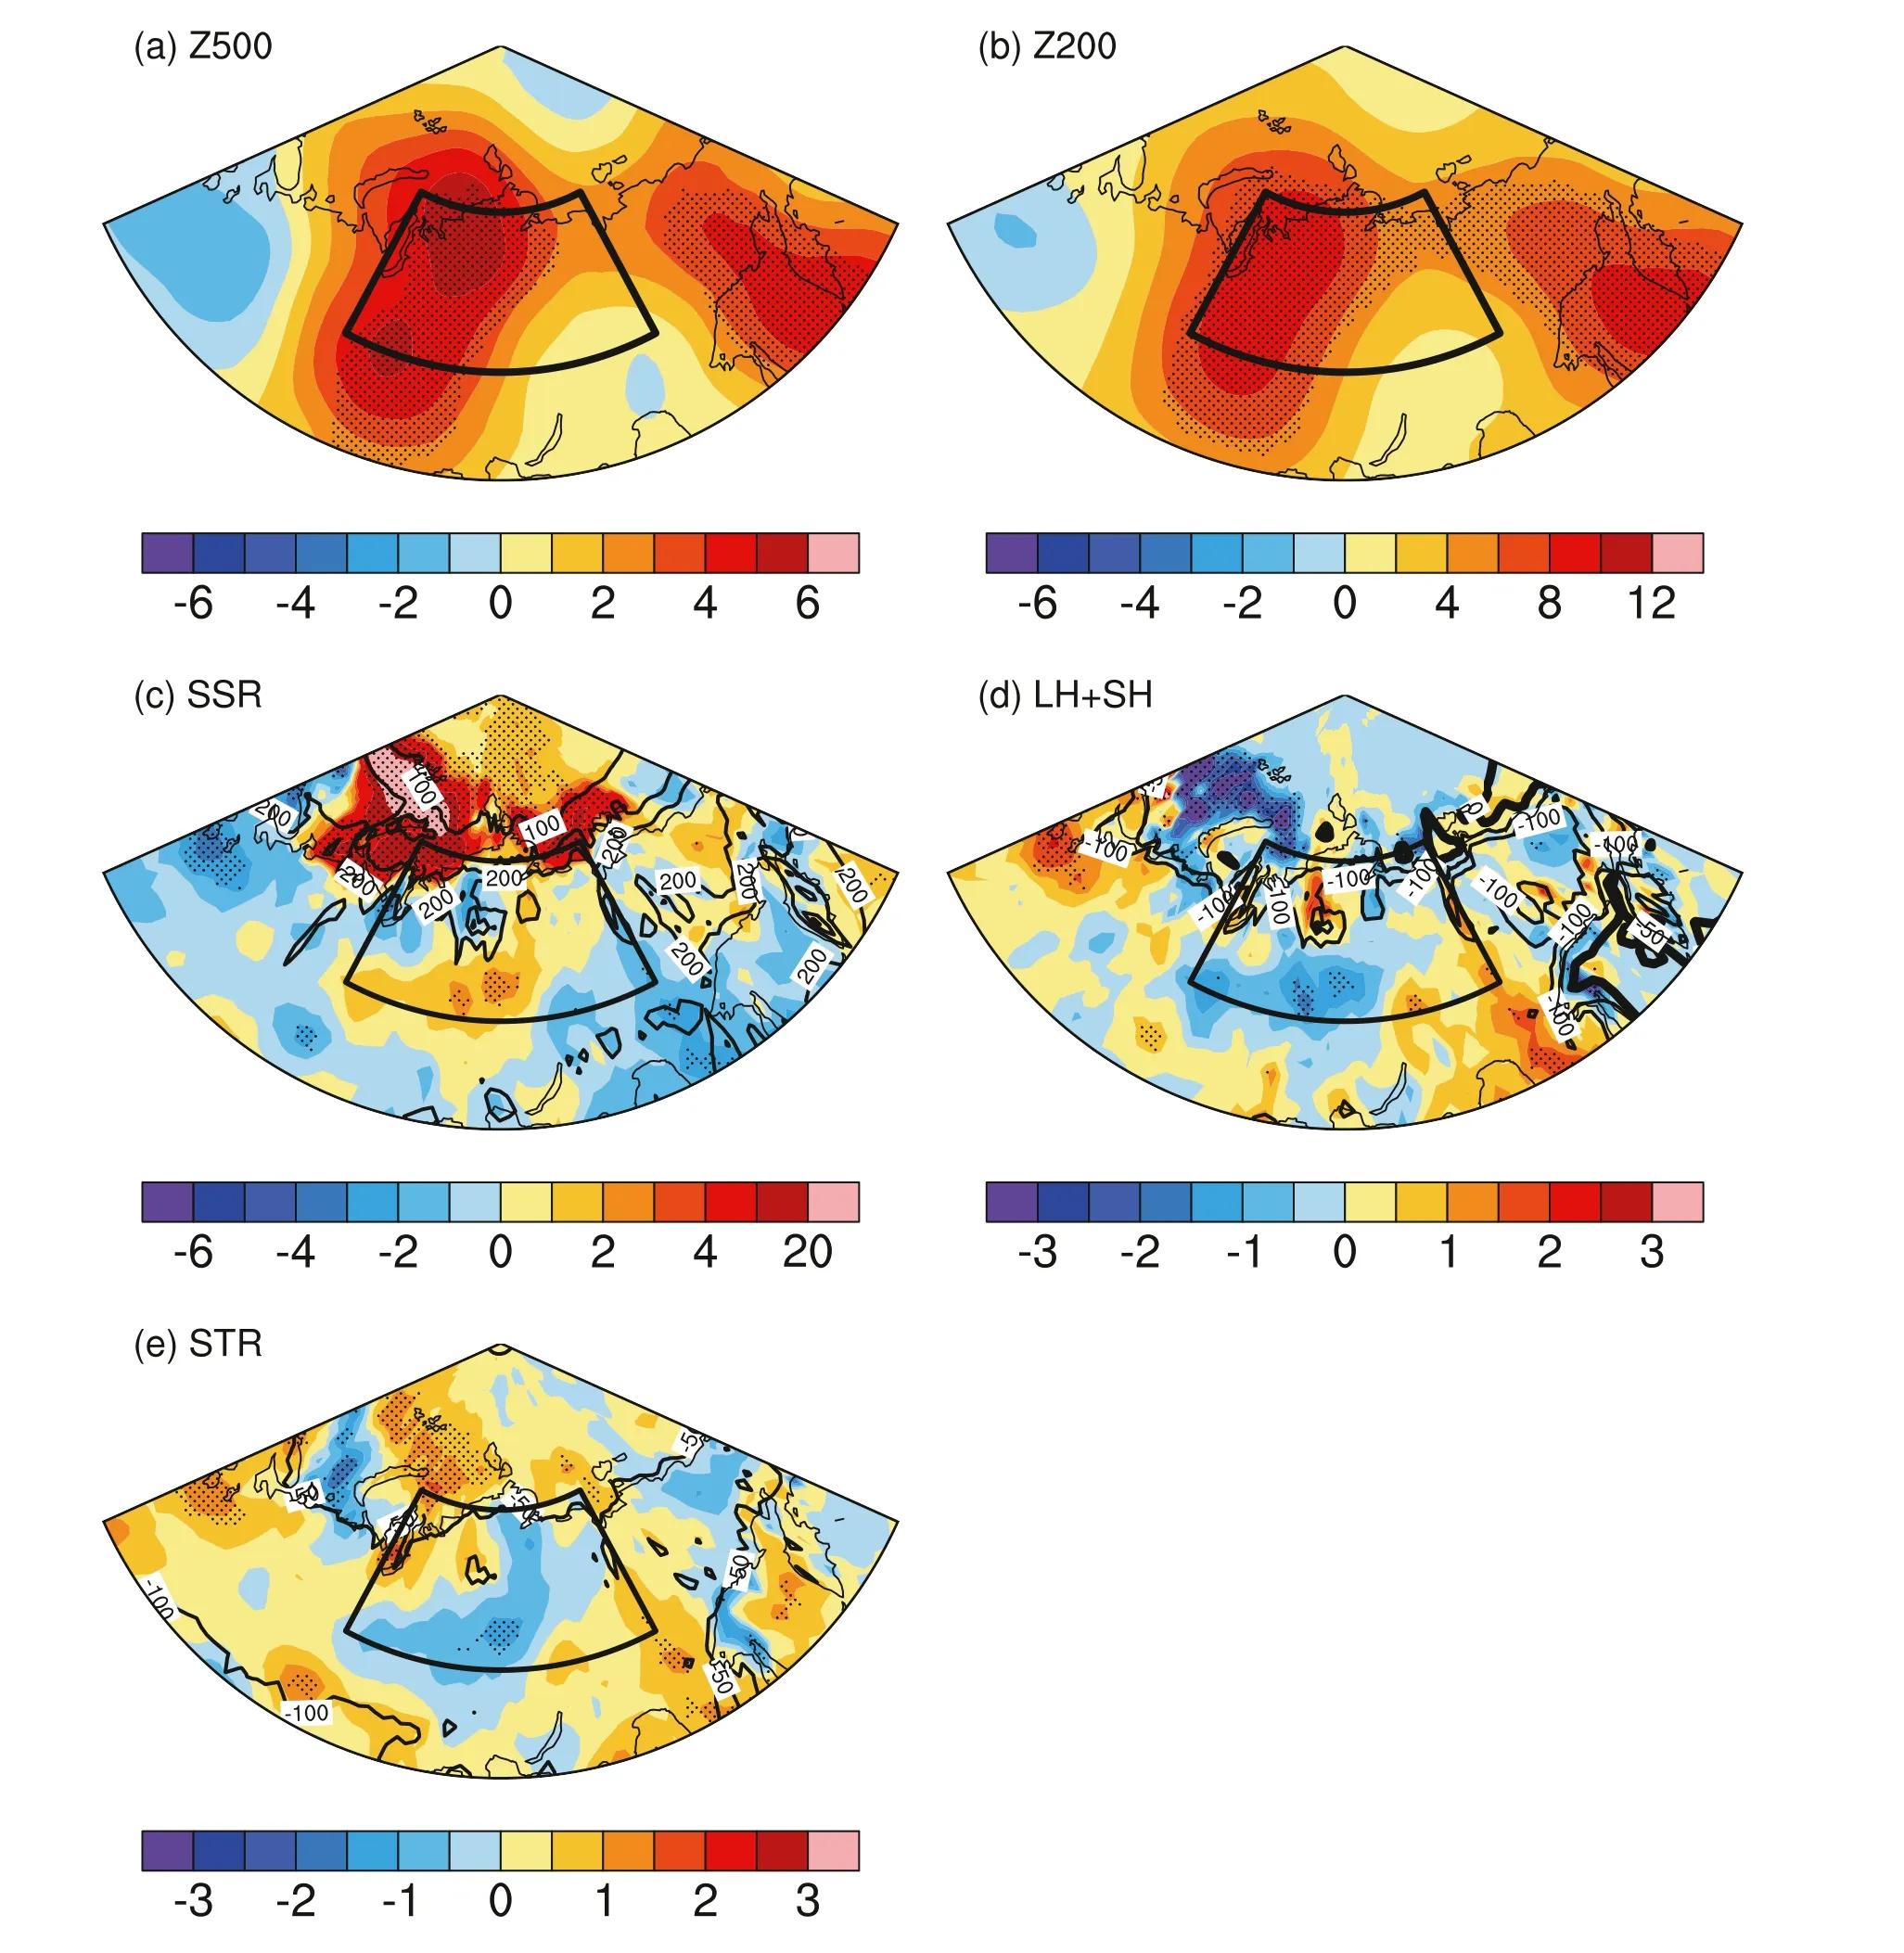
Fig. 5. Linear trends of (a) 500 hPa geopotential height ( Z 500 ; units: m/10 yr), (b) 200 hPa geopotential height ( Z 200 ; units: m/10 yr), (c) surface net downward shortwave flux (SSR; units: W/10 yr), (d) surface turbulent heat flux (LH + SH; latent flux plus sensible flux; units: W/10 yr), (e) surface net upward longwave flux(STR; units: W/10 yr) in June in EXP1-EXP2. Contours in (c—e) indicate the climatology of SSR (units: W), LH + SH (units: W), and STR (units: W) in June during 1979—2015 in EXP1, respectively. Stippled regions indicate the trends are significant at the 0.1 level. Positive values indicate the direction of flux is downwards.
The linear trends of the circulations, radiation fluxes and turbulent heat flux in EXP1-EXP2 are shown in Fig. 5 . Increased geopotential height is found over Siberia at 500 hPa and 200 hPa. The maximum center is located more to the west compared with that in the observation, which is consistent with the westward shift in SAT warming in the simulation. There are also increases in surface net downward shortwave radiation, turbulent heat flux, and upward longwave radiation flux over the Siberian region. This result indicates that the surface absorbs more solar radiation and then heats the overlying atmosphere through longwave radiation and turbulent heat flux. The simulated changes in circulations and surface fluxes generally resemble those in the observation and reanalysis, which further confirms the physical processes linking the Arctic sea ice decline and Siberian warming.
4. Conclusions and discussion
This study shows that there was intense warming over Siberia in June during 1979—2020. The linear trend of June SAT over Siberia reaches up to 0.90°C/10 yr, which is much larger than the trend averaged over the area with same latitudes (trend of 0.46°C/10 yr). The Siberian warming extends from the surface to about 300 hPa. Corresponding to the warming, there are generally increasing trends in geopotential height in the mid-to-upper troposphere over Siberia, which favors more incoming solar radiation reaching the surface and warming of the lower-level atmosphere through upward longwave radiation and turbulent heat flux. Observation/reanalysis data show that the Siberian SAT warming is closely related to sea ice decline over the northern Barents Sea and Kara Sea.
To confirm the results obtained from the observational and reanalysis data, two experiments were carried out using IAP-AGCM4.1. The differences between the experiments (EXP1-EXP2) were able to isolate the impacts of sea ice change on atmospheric circulations. The distribution of temperature trends in EXP1-EXP2 resembled that in the observation, thereby verifying the contribution of sea-ice decline to the Siberian warming. The trends of the circulations, surface radiation fluxes, and turbulent heat flux in EXP1-EXP2 were generally consistent with those in the reanalysis data, implying that the changes in circulations and surface fluxes in association with the sea ice decline have played important roles in forming the intense warming over Siberia.
The results of this study indicate that in addition to the general global warming effect, the sea ice decline over the Arctic has likely given rise to regional atmospheric circulation anomalies over Siberia and induced extra warming in that region. It is important to note that the enhanced Siberian warming disappears in July and August, and the corresponding circulation and surface flux changes in July and August show large difference from those in June. There are no significant changes over Siberia in July and August, with only slight decreases in geopotential height, surface net downward shortwave flux, and surface turbulent heat flux, and a slight increase in surface net upward longwave flux.The underlying process related to this interseasonal variation needs further exploration. Previous work shows that the Siberian SAT is associated with changes in the stratospheric polar vortex, North Atlantic Oscillation/Arctic Oscillation, tropospheric jet stream, and blocking activity in the Greenland region, amongst other factors ( Wang et al., 2019 ;Overland and Wang, 2020 ; Wu and Chen, 2020 ). The specific pathway by which the Arctic sea ice changes impact the Siberian SAT remains to be explored in the future.
Funding
This research was jointly supported by the National Key R&D Program of China [grant number 2017YFE0111800] and the National Natural Science Foundation of China [grant numbers 41790472 and 41822502 ] .
杂志排行
Atmospheric and Oceanic Science Letters的其它文章
- Relationship between cross-equatorial flows over the Bay of Bengal and Australia in boreal summer: Role of tropical diabatic heating
- State of the climate in the Three Gorges Region of the Yangtze River basin in 2020
- Characteristics of diurnal variations of warm-season precipitation over Xinjiang Province in China
- Mechanisms governing the evolution of a long-lived northwest vortex that caused a series of disasters in Northwest China
- Monthly prediction of tropical cyclone activity over the South China Sea using the FGOALS-f2 ensemble prediction system
- Assessment of CMIP6 model performance for temperature and precipitation in Xinjiang, China
