Phylogenetic relationship,biogeography,and conservation genetics of endangered Fraxinus chiisanensis(Oleaceae),endemic to South Korea
2022-04-25ChngkyunKimDongKpKimHngSunJooHwnKim
Chngkyun Kim,Dong-Kp Kim,Hng Sun,Joo-Hwn Kim
aPlant Research Division,Honam National Institute of Biological Resources,Mokpo 58762,Republic of Korea
bForest Biodiversity Division,Korea National Arboretum,Pocheon 11186,Republic of Korea
cCAS Key Laboratory for Plant Biodiversity and Biogeography of East Asia,Kunming Institute of Botany,Chinese Academy of Sciences,Kunming 650204,Yunnan,PR China
dDepartment of Life Science,Gachon University,Seongnam 13120,Republic of Korea
ABSTRACT
Endemic plants are important for understanding phylogenetic relationships,biogeographical history,and genetic variation because of their restricted distribution and their role in conserving biodiversity.Here,we investigated the phylogenetic relationships of the Korean endemic Fraxinus chiisanensis by reconstructing the molecular phylogeny of Fraxinus based on two nuclear DNA(nrITS and phantastica)and two chloroplast DNA(psbA-trnH and rpl32-trnL)regions.Within our fossil-calibrated phylogenetic framework,we also inferred the biogeographical history of F.chiisanensis.To provide a scientific basis for the conservation of F.chiisanensis,we determined the levels of genetic diversity and genetic differentiation in this species.Combining information from nuclear and chloroplast DNA sequence data,our molecular phylogenetic analyses identified F.chiisanensis as a genetically distinct unit from its sister group,Fraxinus platypoda from Japan.Our molecular dating analyses using nuclear and chloroplast DNA data sets show F.chiisanensis diverged from its sister F.platypoda in the Early or Middle Miocene and differentiated in the Late Miocene on the Korean Peninsula.Our results suggest that the divergence of F.chiisanensis was associated with the submergence of the East China Sea land bridge and enhanced monsoons in East Asia.When compared to F.platypoda,F.chiisanensis exhibits low genetic diversity within populations and high genetic differentiation among populations.These results help us to understand the evolutionary history of F.chiisanensis and to develop a conservation strategy for this species.
Keywords:
East China Sea land bridge
Endemic species
Fraxinus chiisanensis
Korean Peninsula
Genetic diversity
Biogeography
1.Introduction
Endemism is an essential factor in studies of the characteristics and origins of a species(Huang et al.,2011;L´opez-Pujol et al.,2011).Phylogenetic and biogeographical studies of endemic plants can also reveal the evolutionary history of species in a specific region(Zhang et al.,2010).However,most endemic species are threatened due to their restricted distribution.To develop a sustainable conservation strategy for protecting endangered endemic species,it is important to understand the phylogenetic relationships and biogeographical history of the species as well as the level of genetic diversity and the genetic differentiation(Ge et al.,2011;Wen et al.,2016).
Fraxinus L.(Oleaceae),commonly known as ash trees,consists of 48 species inhabiting different temperatures in subtropical regions of Europe,East Asia,and North and Central America(Wallander,2013).This genus originated in North America and later dispersed into East Asia during the Oligocene(Hinsinger et al.,2013).In a recent infrageneric classification of Fraxinus,six sections(Dipetalae,Fraxinus,Melioides s.l.,Ornus,Pauciflorae,and Sciadanthus)were recognized based on the position of inflorescence,the presence/absence of a calyx,the number of petals,and the presence/absence of a wing on the leaf petiole(Wallander,2008).This classification is also supported by the reconstruction of the phylogenetic relationships of the genus using nuclear and chloroplast DNA(cpDNA)sequence data(Hinsinger et al.,2013).F.chiisanensis Nakai,in section Melioides s.l.sensu Hinsinger et al.(2013),is endemic to South Korea,and occurs along the stream valleys and low slopes of mountains in the southern part of the Korean Peninsula(Chang et al.,2002;Chang,2007;Lee et al.,2009).F.chiisanensis is characterized by a lack of petals and the presence of a panicle from the lateral bud of the previous year,a persistent calyx,and a brownish terminal bud(Chang et al.,2002;Chang,2007).The results of flavonoid analyses indicate that F.chiisanensis is a distinct species with a different chemical composition from Fraxinus chinensis and Fraxinus mandshurica(Min et al.,2001),which were once considered parental species(Chung,1957;Lee,1980;Song et al.,1988).Thus,morphological and chemical evidence indicate that F.chiisanensis is a distinct species within the genus.However,the sister group of F.chiisanensis is controversial.Previous studies that used nuclear and chloroplast DNA sequence data with limited sampling of F.chiisanensis from arboretums reported that F.chiisanensis is sister to either F.platypoda Oliv.or the Fraxinus cuspidata Torr.-Fraxinus spaethiana Lingelsh.(synonym of F.platypoda)clade(Wallander,2008;Hinsinger et al.,2013;Nesom,2014).Therefore,the phylogenetic relationships of F.chiisanensis need to be evaluated using broader sampling collected from natural populations.
Human-induced habitat loss has decreased population sizes of Fraxinus chiisanensis,which has recently been designated an endangered species on the IUCN Red List of Threatened Species(Kim et al.,2016).Most of South Korea's conservation efforts have been solely directed at endangered species whose populations have declined sharply or whose survival is at risk(NIBR,2012).A preliminary study of F.chiisanensis populations using 15 allozyme loci reported that genetic diversity within F.chiisanensis is low and genetic differentiation among populations is high(Lee et al.,2009).However,some allozymes deteriorate rapidly after collecting plant leaves in the field and,thus,many loci are not detectable(Wendel and Weeden,1989).Also,it is important to assess exact levels of genetic variation within and among populations in F.chiisanensis via comparison with closely related species(Qiu et al.,2009a,b;Chung et al.,2014).
Two theories have been proposed to explain the migration routes of endemic species in South Korea.One theory posits that a refuge existed mainly in northeastern China and these populations colonized South Korea via the Baek-du-dae-gan,the main Korean mountain range that spans most of the Peninsula from the north to south and acted as a refuge during the Last Glacial Maximum(LGM)(Choi,1998;Chung et al.,2006,2017).The second hypothetical route is the East China Sea(ECS)land bridge between East China-South Japan and southern South Korea(Qiu et al.,2009a,b;Qi et al.,2014;Lee et al.,2016).This migration is related to the expansion across the continental shelf that emerged in the ECS as a result of an 85-130-m decrease in the sea level during the LGM(Millien-Parra and Jaeger,1999).However,these migration routes through the Korean Peninsula were determined using terrestrial herbs and shrubs;few woody plants have been examined.Furthermore,biogeographical study of F.chiisanensis has not been conducted.
Most biogeographical studies of plants have been based on cpDNA data,which has revealed genetic variation throughout plant ranges and allowed inferences on evolutionary history(Qiu et al.,2009a;Setoguchi et al.,2006;Sun et al.,2014).However,cpDNA data are unable to provide information about pollen gene flow,a main component forming genetic variation within and among populations(Bai et al.,2010;Liao et al.,2016).One solution to this limitation is to use both nuclear and cpDNA markers.Here,we used two nuclear DNA(nuclear ribosomal internal transcribed spacer region[nrITS];phantastica)and two cpDNA(psbA-trnH;rpl32-trnL intergenic spacer[IGS])regions,which have been successfully used in previous molecular studies of Fraxinus(Arca et al.,2012;Hinsinger et al.,2013),to investigate the systematics and biogeography of F.chiisanensis.Specifically,we aimed to(1)determine the closest relatives of F.chiisanensis;(2)infer the divergence events of F.chiisanensis;and(3)elucidate the level of genetic diversity and differentiation of this species through comparison with sister species.This study provides a phylogeny,genetic information,and a biogeographical history of F.chiisanensis,which together establish a reliable foundation from which to make decisions regarding the conservation of this species.
2.Materials and methods
2.1.Plant materials and sampling strategy
A total of 70 individuals representing five extant populations of Fraxinus chiisanensis were collected in South Korea over the entire geographic range of the species.Because the species is rare and endangered,sampling a large number of individuals was not possible in most populations.Thus,fresh leaves of 10-20 individuals were randomly collected from each population,depending on the availability of adult trees and the population sizes of each location.To compare the level of genetic variation in F.chiisanensis to that of close relatives,we also sampled 133 individuals from nine populations of F.platypoda(4 populations/63 individuals)and F.chinensis(5/70)in South Korea and Japan(Table 1).We also included three individuals of F.platypoda from China.To assess the phylogenetic relationships of F.chiisanensis,we analyzed the Fraxinus species in a broad phylogenetic framework.This data set included 46 species representing six sections of Fraxinus sensu Wallander(2008)and Hinsinger et al.(2013).For molecular dating analyses,we included 42 species,excluding four from which we could not obtain nuclear and/or cpDNA regions used in this study from NCBI.Based on previous phylogenetic studies(Wallander,2008;Hinsinger et al.,2013;Kim et al.,2019),we also included three species(Olea europaea L.,Osmanthus fragrans Lour.,and Ligustrum vulgare L.)of Oleaceae as outgroups.The sampled taxa and GenBank accession numbers of all species are listed in Table S1.
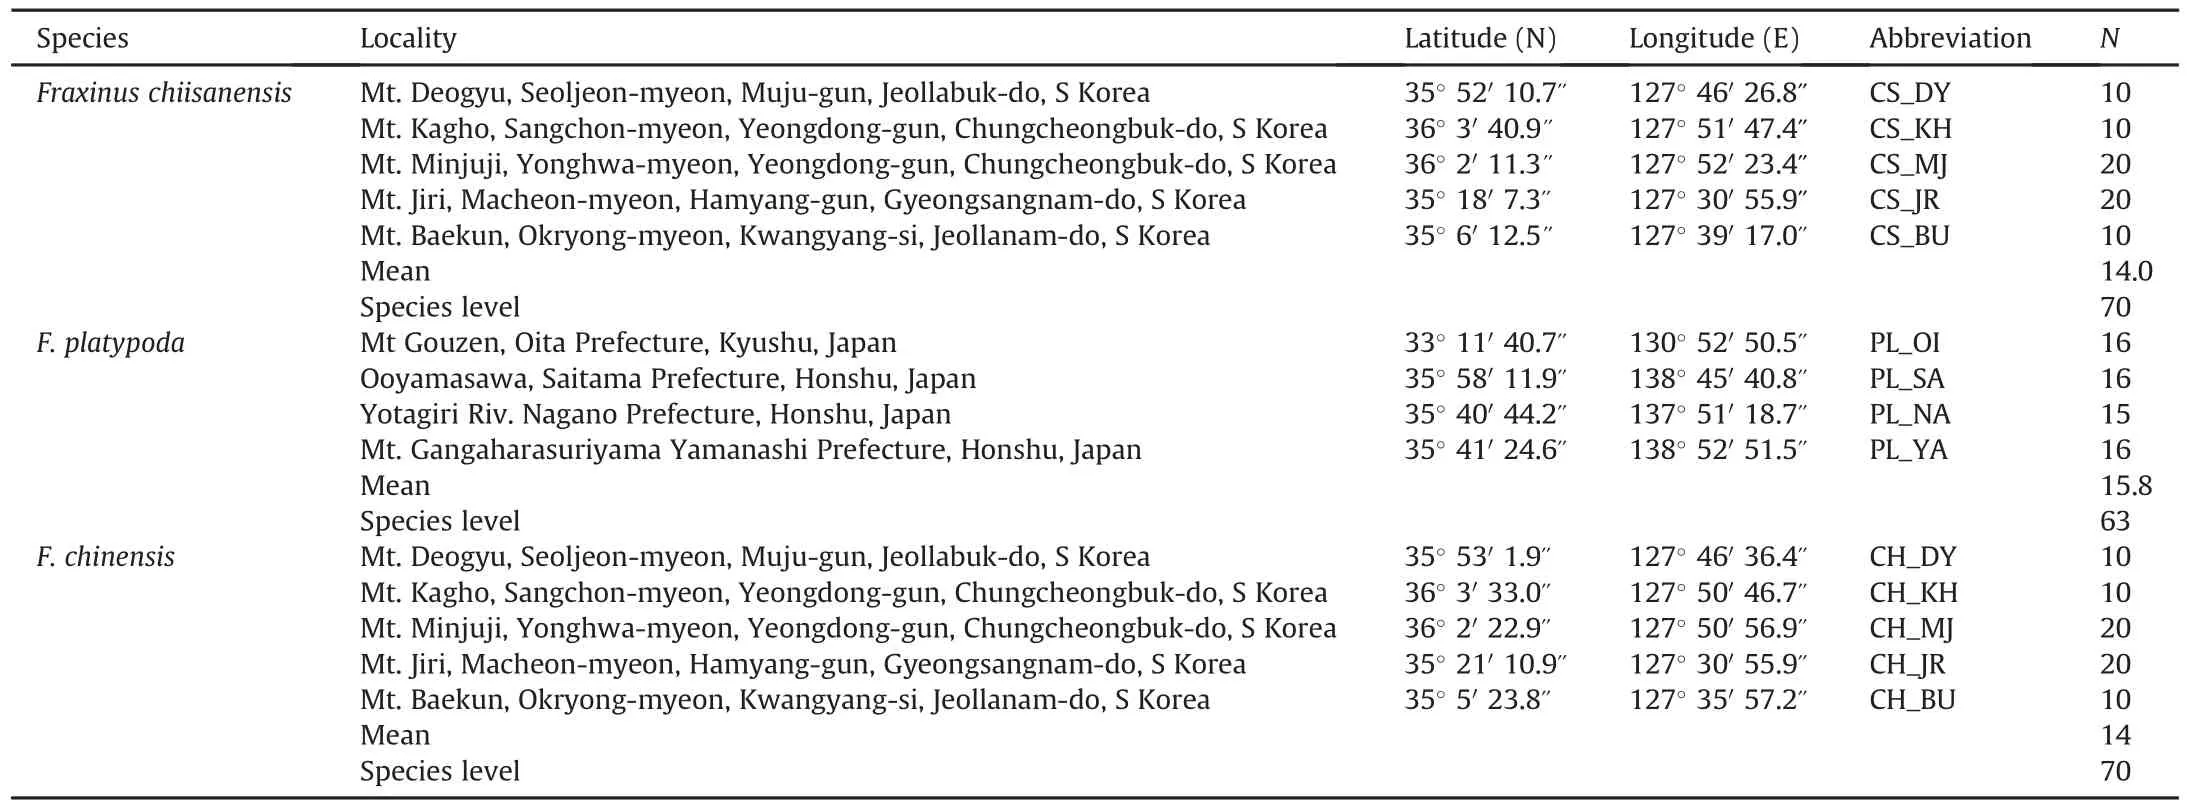
Table 1Population localities and sample size of Fraxinus chiisanensis,F.platypoda,and F.chinensis surveyed for nrITS,phantastica,and two cpDNAs(psbA-trnH and rpl32-trnL).
2.2.Laboratory experiments
Total genomic DNA was extracted from silica-dried leaf material or herbarium specimens using a DNeasy Plant Mini Kit(Qiagen,Valencia,CA,USA)according to the manufacturer's instructions.The entire nrITS region(ITS1-5.8S-ITS2)was amplified using primers ITS1 and ITS4(White et al.,1990).The phantastica region was amplified using primers Phan-F-M13 and Phan-R-M13(Hinsinger et al.,2013).Two cpDNA regions were used:(1)the rpl32-trnL IGS was amplified using the primers rpL32-F and trnL(Shaw et al.,2007);and(2)the psbA-trnH IGS was amplified with the primers psbAF and trnHR(Sang et al.,1997).
The target regions of DNA were amplified from 200 ng of genomic DNA in a 25μL mixture with a PTC-200 thermal cycler(MJ Research,Waltham,MA,USA).Thermocycling conditions were as follows:2 min at 95°C,35 cycles of 20 s at 95°C(denaturation),40 s at 52°C(annealing temperature for nrITS and psbA-trnH)or 56°C(for phantastica and rpl32-trnL),and 1 min 20 s at 72°C(extension),with a final cycle of 10 min at 72°C.The amplified DNA samples were purified for sequencing using a PCR purification kit(Qiagen)according to the manufacturer's instructions.All PCR products were directly sequenced using the amplification primers on an ABI3730 automated sequencer(Applied Biosystems,Foster City,CA,USA).
2.3.Phylogenetic analyses
Complementary DNA sequences were assembled for each individual using DNA Baser v.4(http://www.DnaBaser.com)to evaluate chromatograms for confirmation of base calls and to edit contiguous sequences.A multiple sequence alignment was performed with MAFFT v.6(Katoh et al.,2019)using the default alignment parameters.
The incongruence length difference(ILD)test was used to assess data congruency between nuclear and cpDNA data sets(Farris et al.,1995)using PAUP*4.0b10(Swofford,2002)and 1000 heuristic search replications.The ILD test indicated significant incongruence(P=0.012)between the two data sets(nuclear and cpDNA).Because of the stochastic manner in which lineages sort during speciation and hybridization(Maddison,1997;Nakhleh,2010),it is common that gene trees differ in topology from each other.In the current study,the combined data set was better resolved for the phylogenetic relationship of Fraxinus than either individual analysis although some nodes were still weakly supported.Furthermore,supported(bootstrap support value>80)incongruent clades were not found upon comparison of parsimony bootstrap consensus trees generated from nuclear and cpDNA data sets.Therefore,for our phylogenetic analyses of Fraxinus,we chose to combine two data sets with their weakly-incongruent trees,as suggested by Nie et al.(2008)and Kim et al.(2015).
Phylogenetic reconstructions of the combined sequences were performed by maximum parsimony(MP),maximum likelihood(ML),and Bayesian inference(BI)analyses.For MP analyses,all characters and character states were weighted equally and unordered.The most parsimonious trees were searched with a heuristic algorithm comprising tree bisection-reconnection,branch swapping,MULPARS,and the alternative character state in PAUP*4.0b10.Bootstrap analyses(PBS;1000 pseudoreplicates)were conducted to examine the relative level of support for individual clades on the cladograms of each search(Felsenstein,1985).
Before running ML and BI analyses,the models of nucleotide substitution were selected based on the Akaike information criterion(AIC;Akaike,1974)as implemented in MODELTEST v.3.1(Posada and Crandall,1998). The models were as follows:GTR+I+G(nrITS and cpDNA)and HKY+G(phantastica).For ML analysis of the combined nuclear and cpDNA data set,the IQ-TREE web server(http://iqtree.cibiv.univie.ac.at)was used.Support value(LBS)of branches was calculated with 1000 replicates of rapid bootstrap(Stamatakis et al.,2008).
BI analysis of the combined data set was conducted using MrBayes v.3.12(Ronquist et al.,2012).Four chains of the Markov chain Monte Carlo(MCMC)inference were run simultaneously,with sampling every 1000 generations for a total of 20,000,000 generations.The first 5,000,000 generations(i.e.,5000 trees)were treated as the “burn-in”of the chains and were deleted.We plotted the log-likelihood scores of sample points against generation time using Tracer v.1.6(Rambaut and Drummond,2014)to ensure that stationarity was attained after the first 5,000,000 generations by checking whether the log-likelihood values of the sample points reached a stable equilibrium(Huelsenbeck and Ronquist,2001).In addition,we used AWTY(Nylander et al.,2008)to compare the split frequencies from the different runs and to plot cumulative split frequencies to ensure that stationarity was reached.A maximum a posteriori tree was constructed by summarizing the remaining trees from parallel runs in a majority rule consensus tree,yielding the posterior probability(PP)values for each clade.
2.4.Estimation of divergence time
To estimate the divergence time for crown and stem nodes of Fraxinus chiisanensis based on the nuclear(nrITS and phantastica)and cpDNA(psbA-trnH;rpl32-trnL IGS)sequence data,we used BEAST v.1.5.4(http://beast.bio.ed.ac.uk;Drummond and Rambaut,2007).The BEAUti interface was employed to generate input files for BEAST,in which the GTR+I+G(for both nuclear and cpDNA)model was applied with a birth-death speciation tree prior and an uncorrelated lognormal molecular clock model.Posterior distributions of parameters were approximated using two independent MCMC analyses of 100,000,000 generations with a 10%burn-in.The results were verified using Tracer v.1.6 to ensure that plots from the two analyses converged on the same area and then combined.The samples from the posterior analysis were summarized on a maximum clade credibility tree,which had the maximum sum of posterior probabilities on its internal nodes,using Tree Annotator v.1.5.4(Drummond and Rambaut,2007)with the posterior probability limit set to 0.5,summarizing the mean node heights.Means and 95%higher posterior densities(HPDs)of age estimates were obtained from the combined outputs using Tracer.The results were visualized using FigTree v.1.4.2(Rambaut,2014).
Two calibration points were used to estimate the divergence in Fraxinus phylogeny.Fossils of Fraxinus members are readily recognizable according to their winged samaras(Hably et al.,2000;Jung and Lee,2009).The crown age of Fraxinus was constrained to be 44(±3.5)million years ago(mya)with normal distribution based on the samaras of Fraxinus wilcoxiana Berry,which are the oldest fossils described from the Middle Eocene of North America(Call and Dilcher,1992).In addition,the crown age of European Fraxinus species was calibrated with a log-normal distribution having an offset of 23 mya,a mean of 0.1,and a standard deviation of 1.0 based on the fossil pollens of Fraxinus praedicta Heer,described from the Early Miocene of Europe and related to the extant Fraxinus angustifolia s.l.(Palamarev,1989).Both fossil calibrations were also used to understand the biogeographical history of Fraxinus through molecular clock analysis(Hinsinger et al.,2013).
In addition to the above divergence time estimates,the nature of divergence between F.chiisanensis and F.platypoda was further investigated using individual data sets.This data set comprised all haplotypes of nrITS,phantastica,and cpDNA revealed in F.chiisanensis and F.platypoda,and F.cuspidata as outgroup.To estimate nucleotide mutation rates of nrITS,phantastica,and cpDNA,we applied the same substitution model,tree prior and prior distribution models,and calibration points.We performed two independent runs with 50,000,000 generations each,with parameters sampled every 1000 generations and a burn-in of 10%were performed using BEAST v.1.5.4.According to the analyses,mutation rates of nrITS(2.2×10⁻³substitutions/site/mya[s/s/mya]),phantastica(5.4×10-4s/s/mya),and cpDNA(8.8×10⁻⁴s/s/mya)were obtained for Fraxinus.These mutation rates were used to estimate the divergence times between F.chiisanensis and F.platypoda.
2.5.Genetic variation analyses
Using DnaSP v.6.12 software(Rozas et al.,2017),ribotypes,phantypes,and chlorotypes of Fraxinus chiisanensis,F.platypoda,and F.chinensis were determined based on variations in nrITS,phantastica,and cpDNA sequences,respectively,with gaps excluded.All types of diversity(ribotypes[Rd],phantypes[Pd],chlorotypes[Cd];Nei and Tajima,1983)and nucleotide diversity per site(Pi;Nei,1987)within populations and species were determined from the nrITS,phantastica,and cpDNA data sets.We also used PERMUT to estimate two parameters of genetic differentiation(Gst and Nst)within the species(Pons and Petit,1996).The Gst(coefficient of genetic variation over all populations;Nei,1987)was calculated solely based on haplotype frequencies,whereas Nst(the equivalent coefficient, considering sequence similarities between haplotypes)considered the genetic relationships among haplotypes. The values of Gst and Nst were compared with 1000 permutation tests for the presence of phylogeographical structure.An analysis of molecular variance(AMOVA)was performed with Arlequin v.3.0(Excoffier et al.,2005)based on the Euclidean distance matrix to determine the partitioning of variation within and between populations.Significant levels of variance components were assessed by 1000 permutations.The evolutionary relationships between sequence types were constructed by coalescent simulation using the medianjoining model implemented in NETWORK v.4.5(http://www.fluxusengineering.com;Bandelt et al.,1999).
3.Results
3.1.Sequence characteristics and geographical distribution of sequence types
The nrITS data set resulted in 602 bp of aligned sequence from 70 individuals(five populations)of Fraxinus chiisanensis with two variable sites.Three ribotypes were distinguished within the nrITS matrix.The phantastica data set had 596 bp of aligned sequence with 13 variable sites.Eleven phantypes were identified in F.chiisanensis.The combined cpDNA data set resulted in 1397 bp of aligned sequence with six variable sites and four chlorotypes.The combined data set of the four DNA regions was 2595 bp in length and contained 21 nucleotide substitutions.Based on these polymorphic sites,21 genotypes were identified in F.chiisanensis(Table S2).The number of genotypes of F.chiisanensis was lower than that of F.platypoda(number of genotypes=49)and F.chinensis(26)(Table S3).
The geographic distribution and frequencies of three ribotypes,11 phantypes,and four chlorotypes in five populations of Fraxinus chiisanensis are shown in Table S4.Of these,one ribotype(R3),six phantypes(P4,P6-P8,P10,P11),and one chlorotype(C3)were found in a single population and the remaining types were found in at least two populations.Unlike F.platypoda and F.chinensis(Tables S5 and S6),no single types,exceptC1,dominated across the entire distributional range of F.chiisanensis(Table S4).
3.2.Phylogenetic analyses
The combined data matrix consisted of 2760 characters(nrITS,616;phantastica,605;psbA-trnH,561;rpl32-trnL,978).There were 859(31.1%)variable sites,of which 447(16.2%)were potentially informative. Maximum parsimony analysis of the 21 Fraxinus chiisanensis genotypes with 46 F.platypoda genotypes,26 F.chinensis genotypes,and 43 Fraxinus species(51 accessions)and three outgroup species of Oleaceae resulted in>10,000 parsimonious trees with a length of 2005 steps,a consistency index of 0.531,and a retention index of 0.871.The topology of the ML and BI trees(not shown)were identical to the MP strict consensus(Fig.1).The MP tree showed that six sections of Fraxinus were reciprocally formed clades.The accessions of F.chiisanensis and F.chinensis formed clusters according to traditionally recognized species.However,F.platypoda accessions from China have a strong affinity to F.mandshurica instead of the Japanese accessions.F.chiisanensis was found to be a sister of F.platypoda from Japan(PBS=92,LBS=89,PP=0.99).Our MP tree showed that F.cuspidata and F.chiisanensis-F.platypoda are monophyletic and this clade was sister to the remaining of Melioides s.l.,but with low support(Fig.1).
3.3.Molecular dating analyses
The chronogram and results of divergence time estimation for Fraxinus chiisanensis and F.platypoda are shown in Fig.2.Based on the nuclear DNA data set,the divergence age between F.chiisanensis and its sister F.platypoda was estimated at 22.7 mya(95%HPD=12.1-34.5 mya;node N3),in the Early Miocene.The crown nodes of F.chiisanensis and F.platypoda were estimated to have occurred at 6.7 mya(95%HPD=3.0-11.2 mya;node N1)and 6.4 mya(95%HPD=2.9-10.4 mya;node N2),in the Late Miocene,respectively.Divergence time estimates based on the cpDNA data set were younger or similar as those from the nuclear DNA data set.The split between F.chiisanensis and F.platypoda was estimated at 12.1 mya(95%HPD=5.5-19.2 mya;node C3).The crown nodes of F.chiisanensis and F.platypoda were estimated at 5.5 mya(95%HPD=1.1-9.0 mya;node C1)and 7.4 mya(95%HPD=2.7-13.0 mya;node C2),in the Late Miocene,respectively.
Based on the mutation rates,estimates of divergences of F.chiisanensis and F.platypoda differed between nrITS,phantastica,and cpDNA data sets.Mean estimated divergence dates between F.chiisanensis and F.platypoda in the cpDNA data(9.0 mya[95%HPD=3.0-15.5 mya])were younger than those of nrITS(15.9 mya[95%HPD=7.3-26.1 mya])and phantastica data(20.9 mya[95%HPD=10.5-34.5 mya]).Although the cpDNA estimate was younger than that of the nuclear data set,the HPDs of time estimates on both data sets overlap.
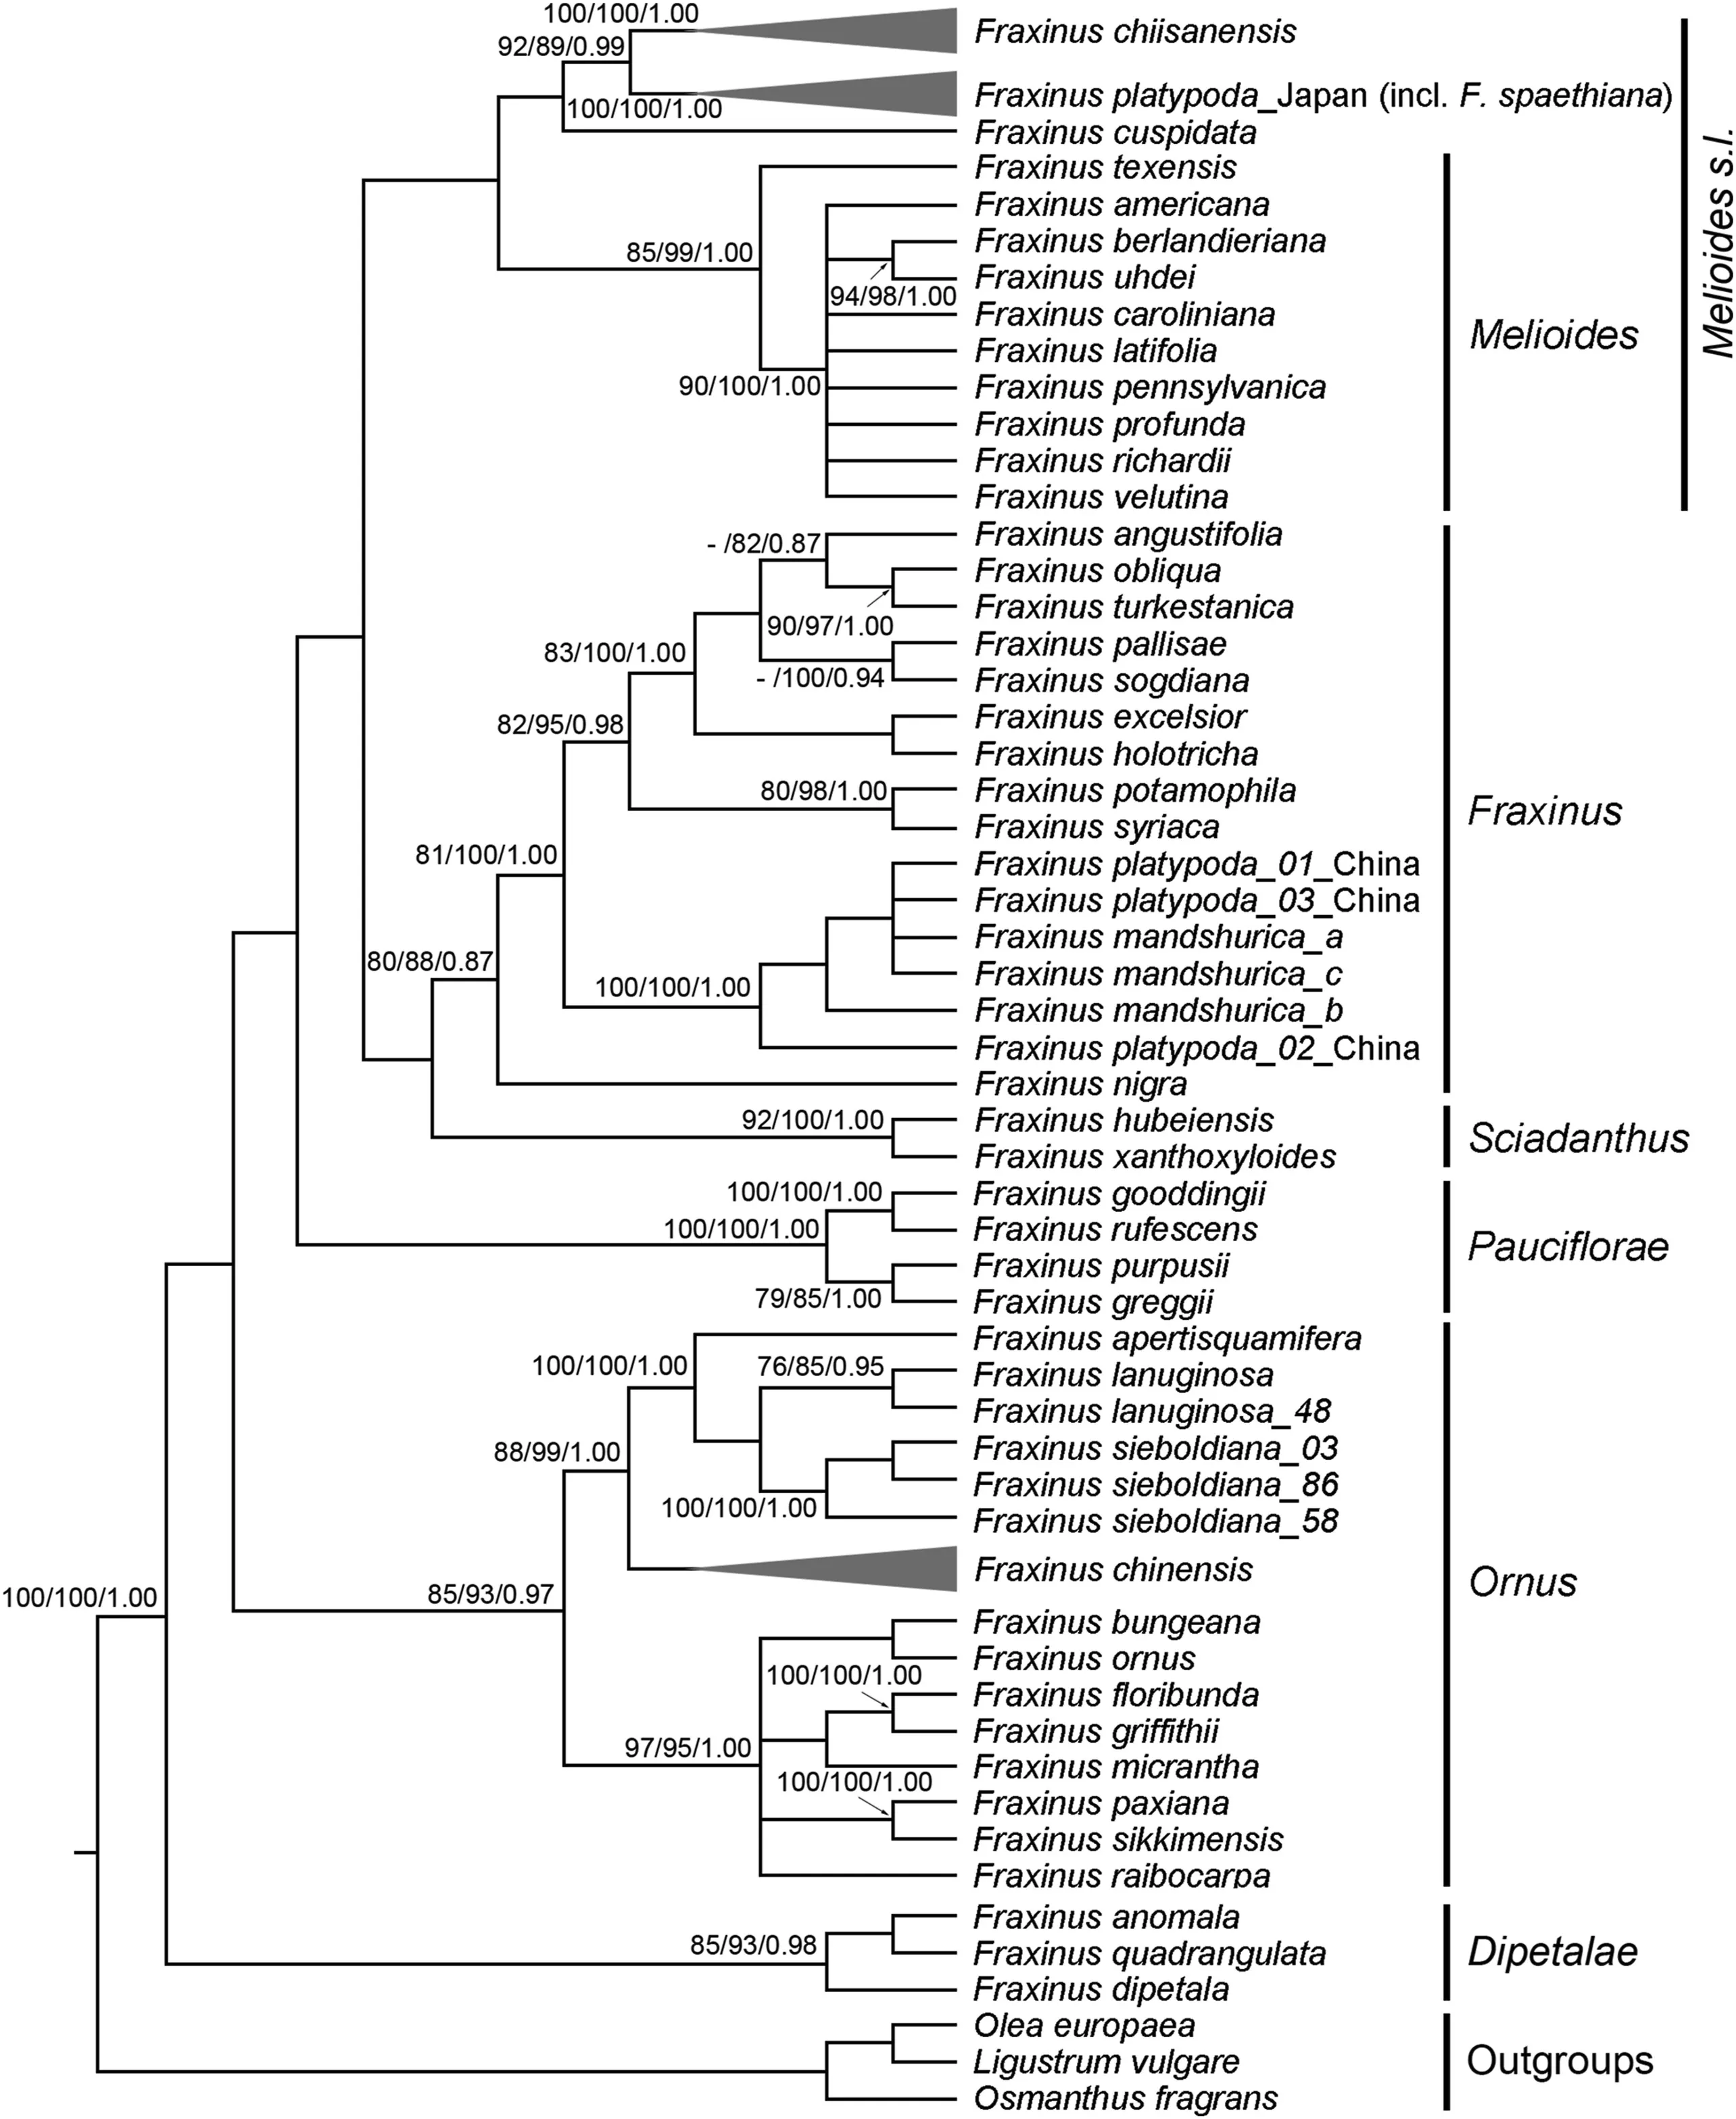
Fig.1.Strict consensus tree of 10,000 most parsimonious trees from the parsimony analysis of the combined sequence data from the two nDNA(nrITS and phantastica)and the two cpDNA(psbA-trnH and rpl32-trnL)regions.The numbers near nodes indicate corresponding support values(maximum parsimony bootstrap[PBS]/maximum likelihood bootstrap[LBS]/Bayesian posterior probability[PP]);a dash(-)indicates that a node did not receive>75%BP in the maximum parsimony analysis.Sections of Fraxinus classification follows Hinsinger et al.(2013).
3.4.Genetic variation analyses
Levels of diversity of three sequence types(Rd,Pd,Cd)and nucleotide diversity(Pi)were investigated using the nrITS,phantastica,and cpDNA regions across all five populations of Fraxinus chiisanensis(Table 2).The Rd and Pd showed the highest diversity in the CS_MJ population of F.chiisanensis,while the Cd exhibited the relatively high diversity in CS_KH and CS_MJ.At the species level,the Rd and Cd of F.chiisanensis(Rd=0.540,Cd=0.653)were lower than those of F.platypoda(Rd=0.744,Cd=0.886),while higher than those of F.chinensis(Rd=0.164,Cd=0.499).The Pd of F.chiisanensis(Pd=0.867)was higher than that of F.platypoda(Pd=0.531)and F.chinensis(Pd=0.693).The same pattern was also observed in a comparison of the nucleotide diversity of F.chiisanensis,F.platypoda,and F.chinensis(Table 2).
Among five populations of Fraxinus chiisanensis,the values of genetic differentiation(Gst)were 0.403 for nrITS,0.279 for phantastica,and 0.405 for cpDNA regions(Table S7).In contrast,low genetic differentiation was detected among populations of F.platypoda(Gst=0.073 for nrITS,0.019 for phantastica,and 0.042 for cpDNA regions)and F.chinensis(0.038 for nrITS,0.088 for phantastica,and 0.099 for cpDNA regions).All three Fraxinus species showed significant phylogeographic structures at the species level(Nst>Gst;all P values<0.01;Table S7).
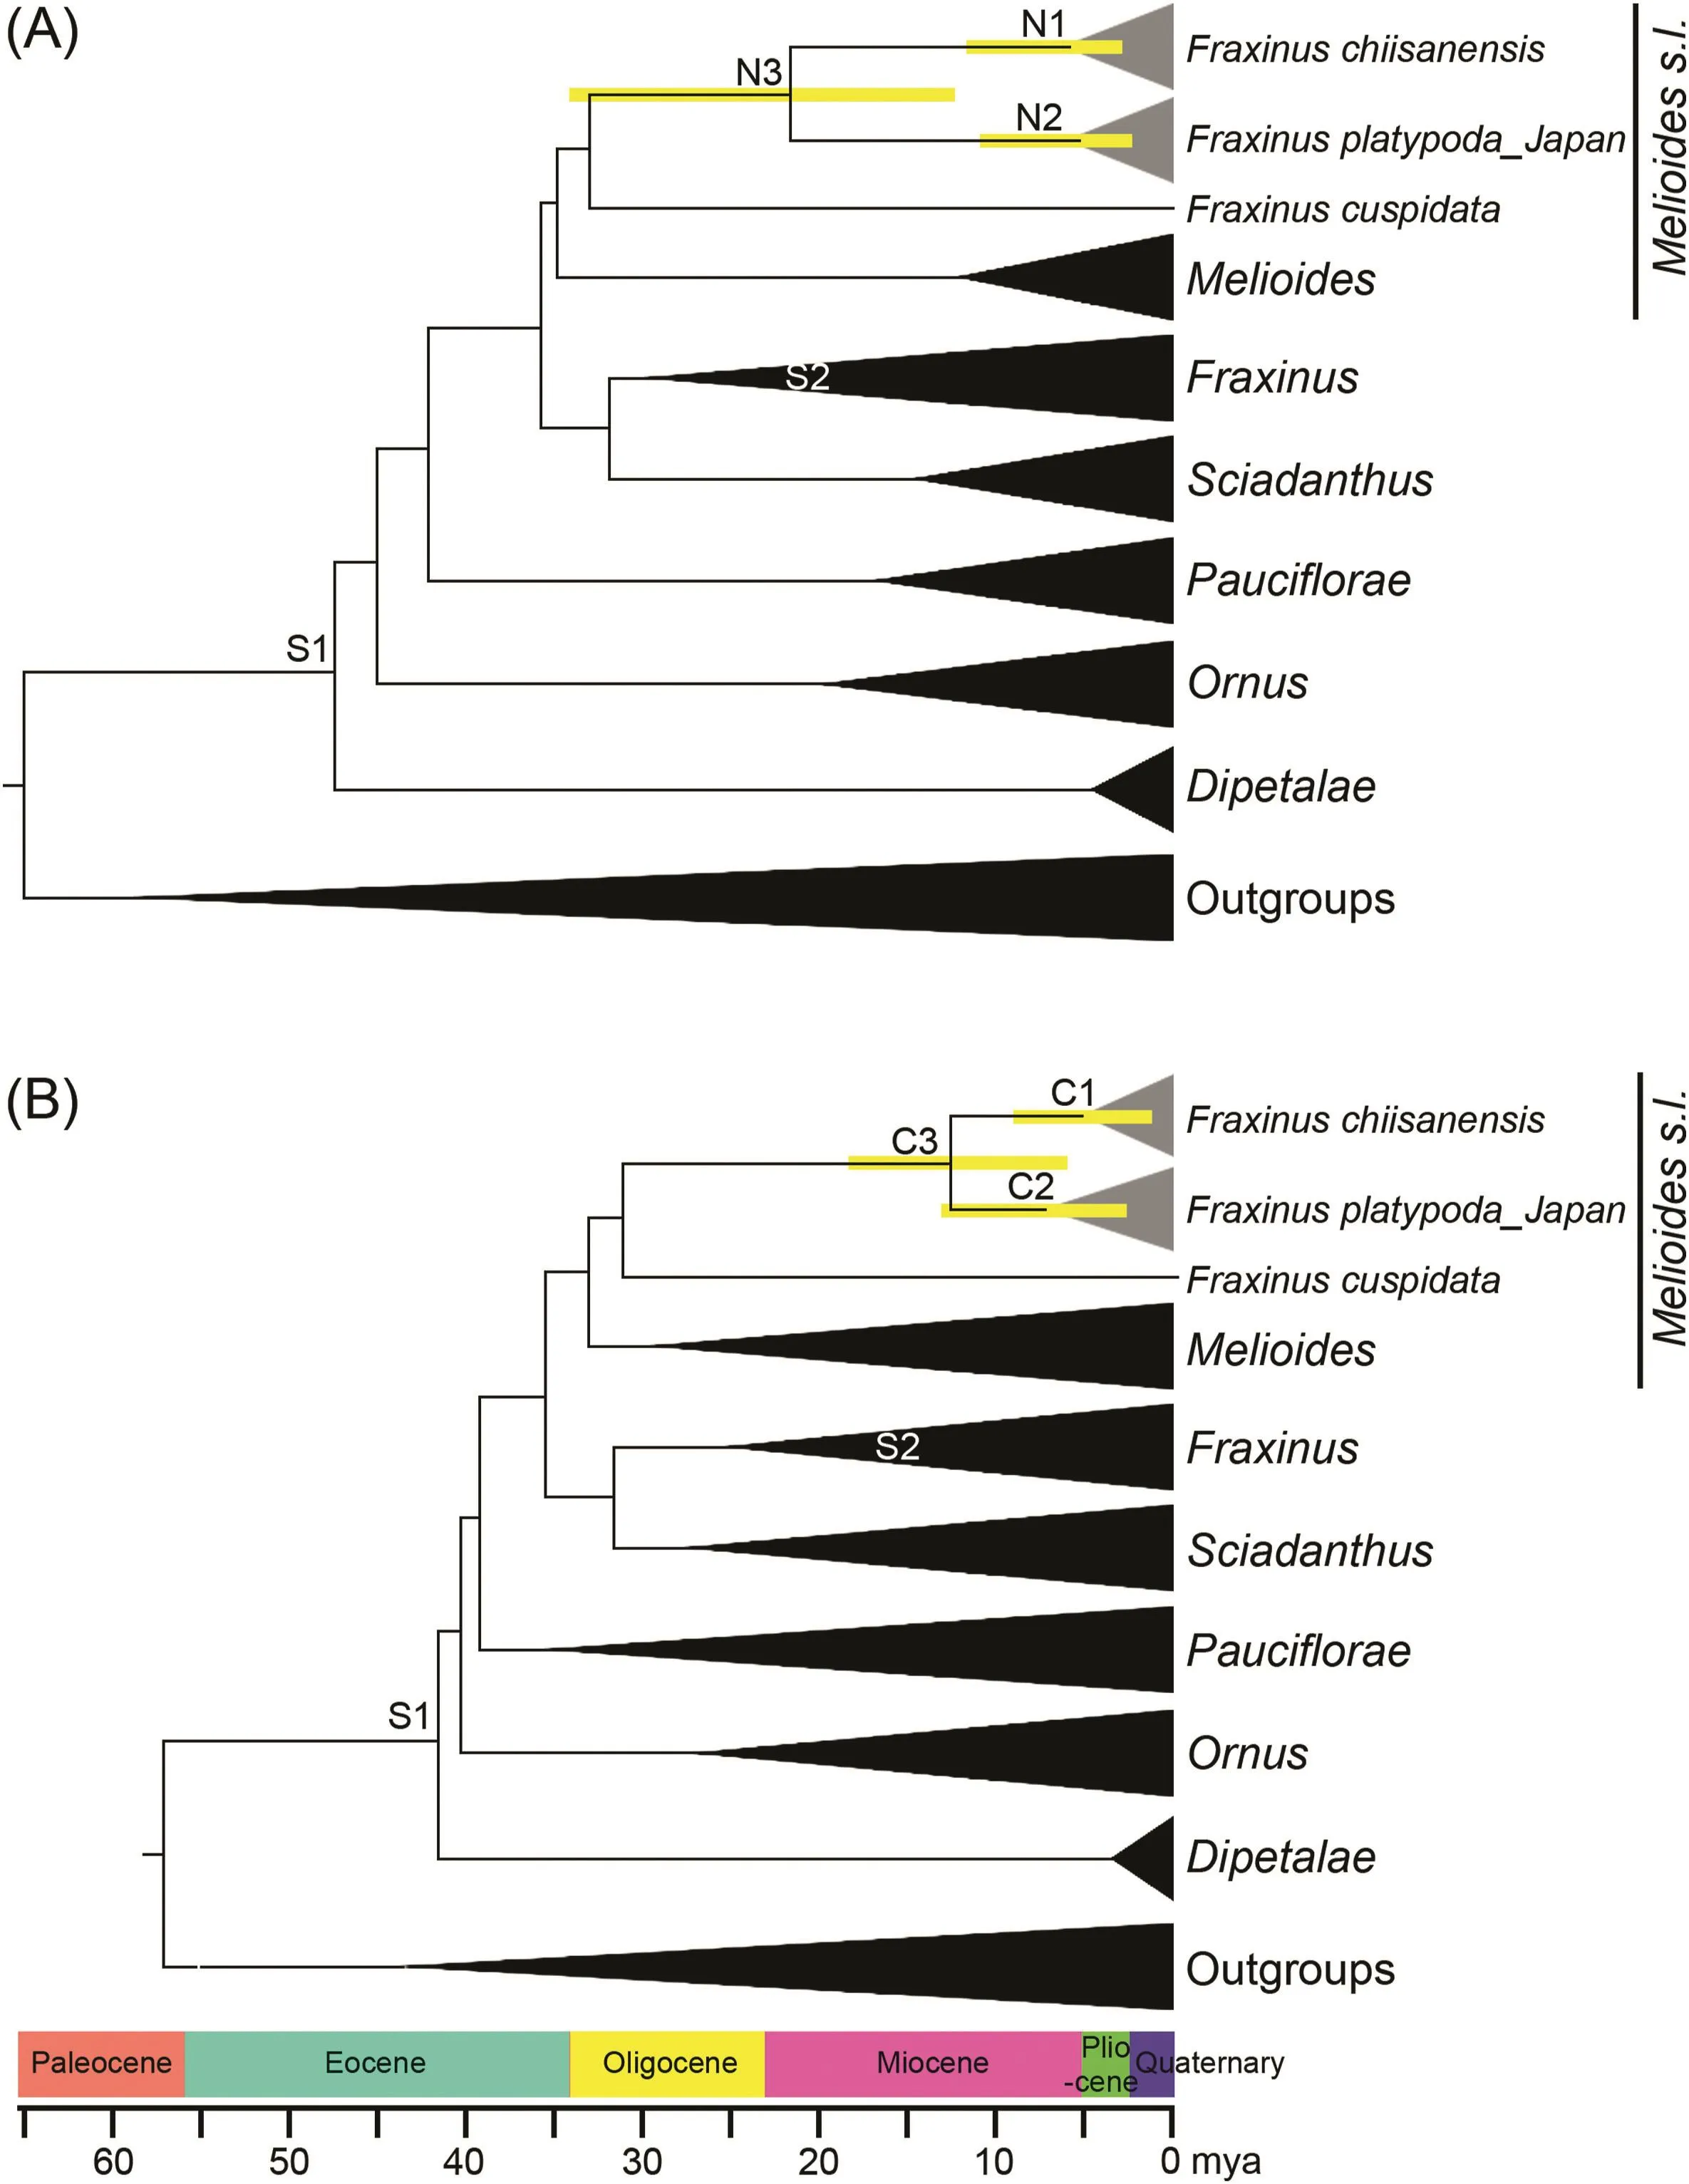
Fig.2.Chronogram showing divergence times estimated in BEAST based on(A)nuclear and(B)cpDNA sequence data.Yellow bars represent 95%high posterior density for the estimated mean dates.Nodes labeled S1 and S2 are calibration points used in the analysis(for more details,see materials and methods).Nodes labeled N1-N3 and C1-C3 indicate nodes of interest.Sections of Fraxinus classification follows Hinsinger et al.(2013).
Analysis of molecular variance(AMOVA)showed significant(P<0.0001)genetic differentiation both among and within populations in the three species(Table 3).The AMOVA partitioned 45.9%,61.5%,and 42.3%of total variation among populations of F.chiisanensis based on nrITS,phantastica,and cpDNA,respectively and 54.1%,38.5%,and 57.7%within populations,respectively.In contrast,an examination of the proportion of diversity among and within populations of the other two species indicated that most of the variation(nrITS=86.8%,phantastica=98.0%,and cpDNA=99.5%in F.platypoda;nrITS=97.9%,phantastica=93.6%,and cpDNA=95.2%in F.chinensis)occurred within populations,with only<14%occurring among populations(Table 3).
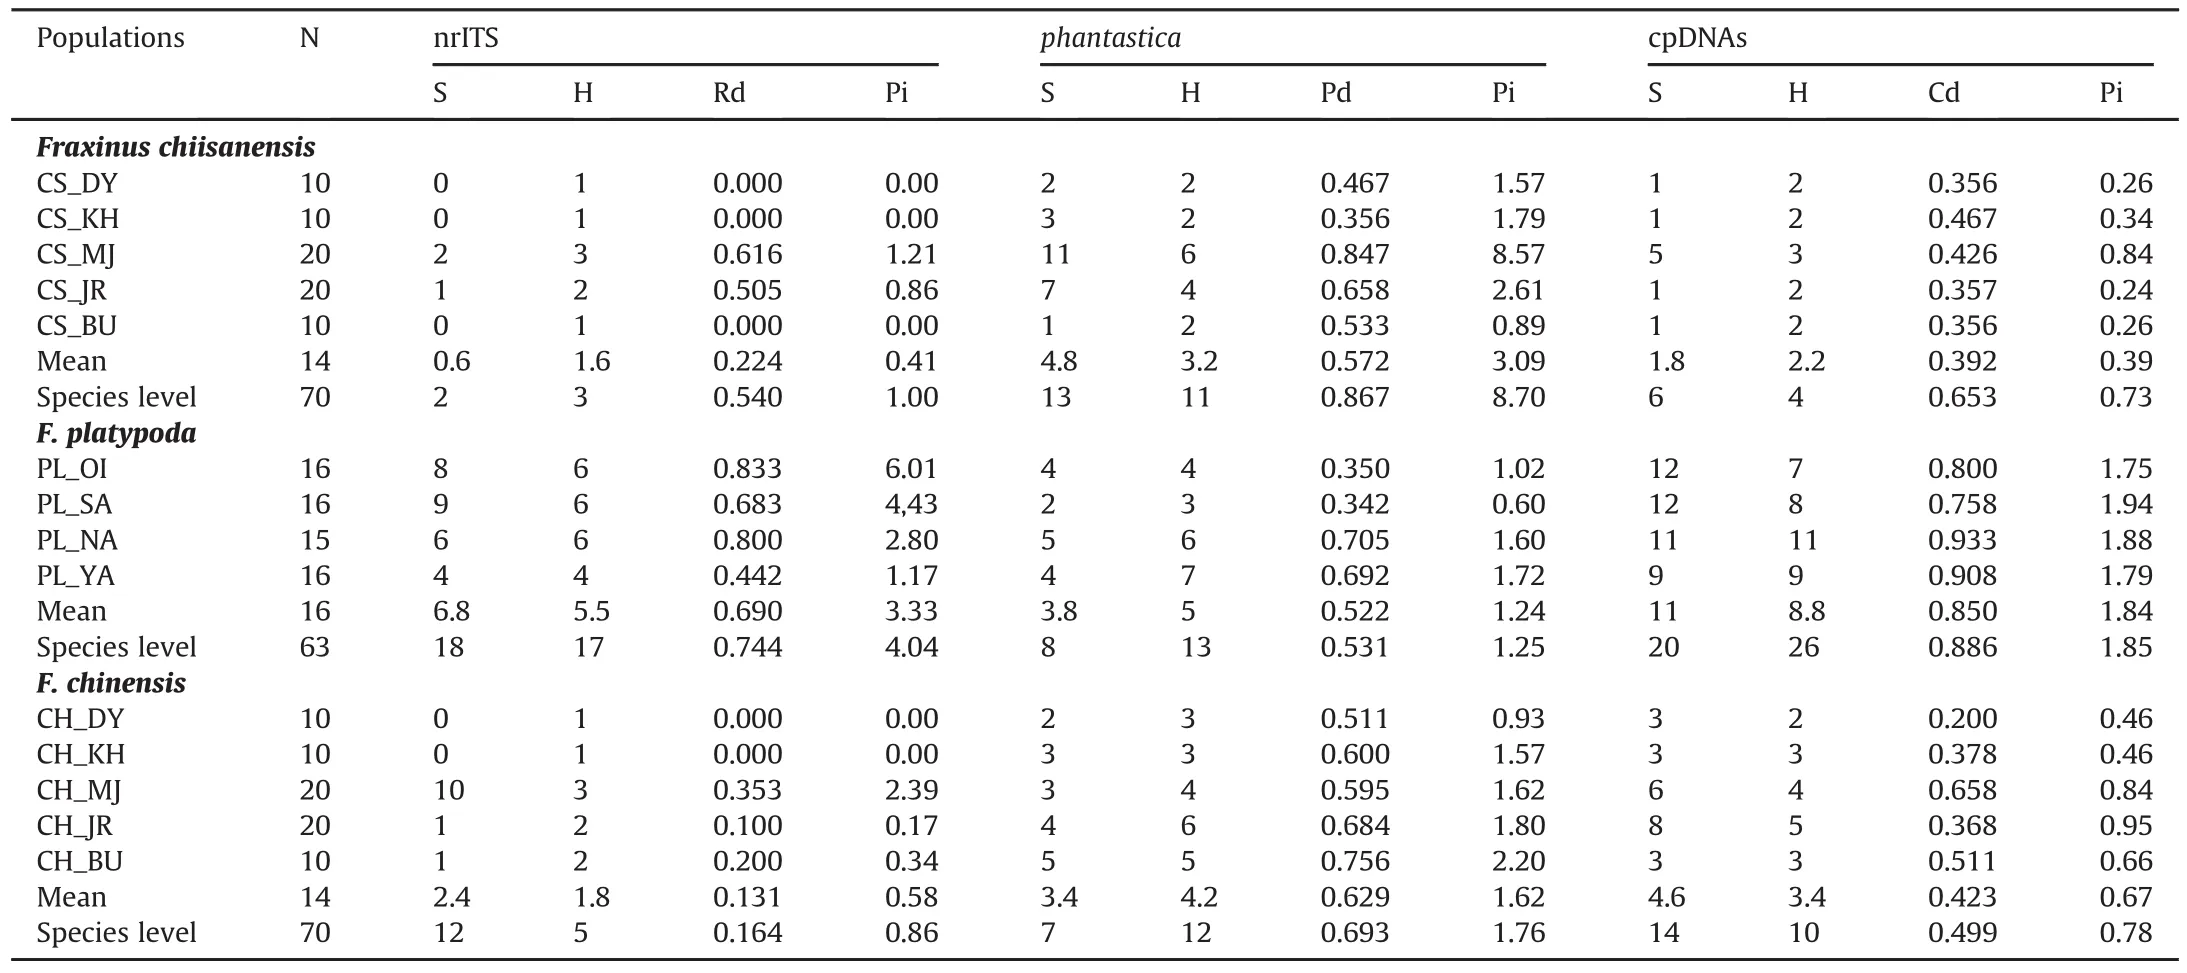
Table 2Sequence polymorphism and genetic diversity within populations of Fraxinus chiisanensis,F.platypoda,and F.chinensis based on nrITS,phantastica,and cpDNA(psbA-trnH and rpl32-trnL).
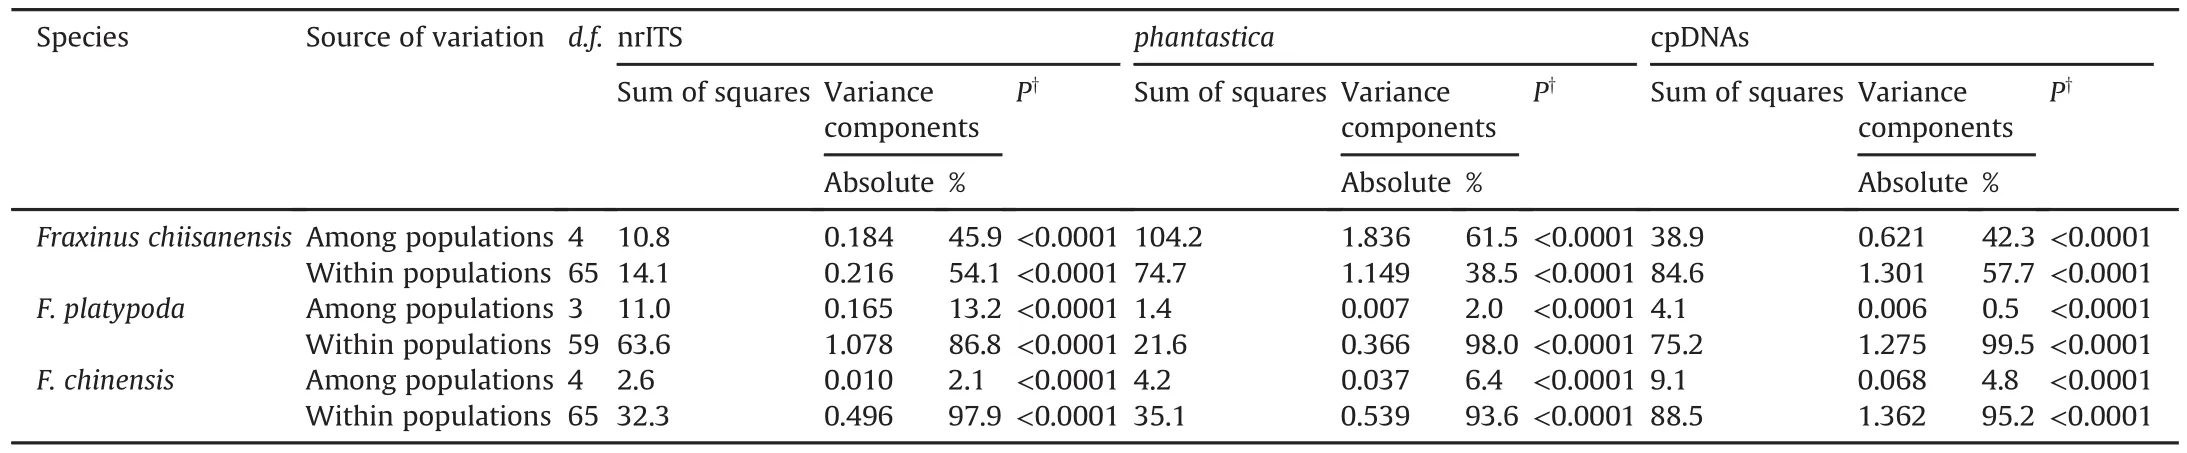
Table 3Analysis of molecular variance for populations of Fraxinus chiisanensis,F.platypoda,and F.chinensis based on nrITS,phantastica,and cpDNA regions.
The genetic relationship among the populations of Fraxinus chiisanensis was assessed by minimum spanning network analyses based on the sequence variation of the nrITS,phantastica,and cpDNA data sets.The reconstructed network of ribotypes and chlorophytes exhibited low resolution in the F.chiisanensis populations(Fig.S1).In contrast,in network analysis using phantypes,the five populations of F.chiisanensis were largely divided into three groups:(I)a group that includes three phantypes(P1,P2,P11)of the CS_JR,CS_MJ,and CS_DY populations;(II)a group that includes four phantypes(P3,P4,P6,P7)of CS_MJ and CS_KH;and(III)a group that includes four phantypes(P5,P8-P10)of CS_MJ,CS_JR,and CS_BU(Fig.3).The phantypes of the CS_MJ population showed a relatively broad distribution to be included in all groups.The grouping of the F.chiisanensis genotypes is associated with the geographical distance between these populations(Fig.S2).
4.Discussion
4.1.Phylogenetic relationships of Fraxinus chiisanensis
Our phylogenetic analyses using the combined data set of two nuclear DNA(nrITS and phantastica)regions and two cpDNA(rpl32-trnL and psbA-trnH) regions support the monophyly of Fraxinus chiisanensis(PBS=100,LBS=100,PP=1.00)(Fig.1).Based on the examination of flowers,apetalous F.chiisanensis was believed to be a hybrid between F.mandshurica and F.chinensis(Chung,1957;Lee,1980;Song et al.,1988).However,our molecular phylogenetic analyses do not support the hybrid origin of F.chiisanensis.Morphologically,F.chiisanensis can be clearly distinguished from F.mandshurica and F.chinensis by a combination of characters including the presence of a panicle from the leafless lateral bud of previous years,a persistent calyx,and a brownish naked bud(Chang et al.,2002).Thus,morphological and molecular features make F.chiisanensis a distinct group within Fraxinus.
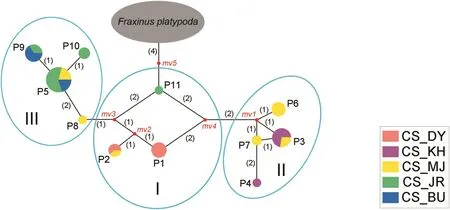
Fig.3.Minimum spanning network of 11 phantypes in Fraxinus chiisanensis.Sizes of colored circles are proportional to genotype frequencies.Median vectors(mv)produced by the network program,representing missing or not sampled genotypes.Population abbreviations are given in Table 1.
Within Fraxinus,the sister of F.chiisanensis is F.platypoda from Japan(PBS=92,LBS=89,PP=1.00;Fig.1).This result is in line with previous studies of the molecular phylogenetic relationships of Fraxinus based on limited sampling of these species(Wallander,2008;Hinsinger et al.,2013).The sister relationship between F.chiisanensis and F.platypoda is also supported by several morphological characteristics(e.g.,apetalous flower,persistent calyx,lateral inflorescence,and samara with a terete seed cavity),although it is difficult to identify morphological synapomorphies for this well-defined clade within Fraxinus.The close relationship between F.chiisanensis and F.platypoda suggests that this species pair should be grouped into the same section in the genus.Since Nakai(1929)suggested that F.chiisanensis belonged to the section Dipetalae,comprising three Fraxinus species from North and Central America,Wallander(2008)proposed that this species should be included in the Melioides section based on the lateral inflorescence and samara shape.Later,Hinsinger et al.(2013)also claimed that this species pair should be included in an expanded Melioides section based on DNA sequence data.Although we found a close relationship between F.chiisanensis-F.platypoda and section Melioides,the support value for this clade is very low(Fig.1).The phylogenetic position of F.chiisanensis-F.platypoda in Fraxinus requires further investigation with a more appropriate data set,including a comprehensive sampling of Melioides s.l.
The accessions of Fraxinus platypoda collected from Japan and China did not form a group according to the taxonomic species(Fig.1).This disparity between the Japanese and Chinese accessions of F.platypoda may have one of two possible explanations.The first is that the Chinese F.platypoda was misidentified.This species has been characterized by swollen petiole bases covering the lateral buds(Wallander,2008).However,this characteristic is also found in other Fraxinus species(Wei and Green,1996).The second explanation is that F.platypoda from Japan and China are different species.F.spaethiana from Japan is morphologically similar to the Chinese F.platypoda and some authors placed the former in synonymy under the latter(e.g.,Wei and Green,1996).However,F.spaethiana can be distinguished from the Chinese F.platypoda by the absence of densely yellowish villous on the abaxial side of the leaves(Wallander,2008).According to the phylogenetic species concept,we suggest resurrecting the taxonomic status of F.spaethiana.
4.2.Biogeography of Fraxinus chiisanensis
Although no studies of East Asian fossils of Fraxinus have indicated its biogeographical history in China, Japan, and Korea, thereare two hypotheses to explain the speciation and migration on theKorean Peninsula (Bai et al., 2010): (1) A refuge existed mainly innortheastern China and these populations colonized South Korea viathe main Korean mountain range (i.e., Baek-du-dae-gan route),which is supported by a study of the widespread, cold-temperatespecies, Pinus koraiensis Sieb. et Zucc. (Kim et al., 2005), Veratrumalbum ssp. oxysepalum (Turcz.) Miyabe Kudo (Kikuchi et al., 2010),and Lilium cernuum Kom. (Chung et al., 2017); (2) A refuge existed insouthern South Korea from south Japan via the ECS land bridge. This hypothesis is verified by phylogeographic analyses of Kirengeshomakoreana Nakai (Qiu et al., 2009b), Neolitsea sericea (Blume) Koidz.(Lee et al., 2013), and Leontopodium japonicum (Thunb.) Miq. (Leeet al., 2016). Our molecular phylogenetic analyses showed that F.chiisanensis populations from South Korea formed a clade with F.platypoda from Honshu and Kyushu (Japan), rather than F. chinensisand F. mandshurica, which mainly occurred in northeastern China(Fig. 1). Based on this phylogenetic relationship and distributionpattern, the ECS land bridge rather than the Baek-du-dae-gan routewas the main route for the formation of F. chiisanensis in the KoreanPeninsula. There are several taxa with divergence patterns similar toF. chiisanensis in South Korea (e.g., K. koreana [Qiu et al., 2009b] andCamellia japonica L. [Ryu et al., 2019]).
The nrITS,phantastica,and cpDNA data sets indicate that the sequence types of Korean Fraxinus chiisanensis and Japanese F.platypoda are both monophyletic lineages(Fig.3 and S1).The current distribution of F.chiisanensis and F.platypoda in South Korea and Japan suggest that the geographic separation of a formerly widespread ancestral stock into two isolated groups occurred through submergence of the ECS land bridge.However,this scenario is unlikely considering the divergence time between F.chiisanensis and F.platypoda.Although divergence time between F.chiisanensis and F.platypoda differed for the nuclear and cpDNA data sets,the two species were found to have diverged in the Miocene epoch(N3 and C3 in Fig.2),which is similar to the finding of previous molecular dating analysis of Fraxinus(Hinsinger et al.,2013).The divergence time between F.chiisanensis and F.platypoda is independent of the submergence of the ECS land bridge during the Late Pleistocene.Instead,partial submergence of a large Miocene land bridge in the Chinese,Japanese,and Korean region may have induced the divergence of two Fraxinus species in South Korea and Japan(Ota,1998).
The climate and geological changes that occurred during the Quaternary have profoundly shaped the present distribution and genetic structure of many plant species in warm temperate regions of East Asia.Unlike most plant species in East Asia that diverged in the Quaternary(Li et al.,2008;Qiu et al.,2009a;Chung et al.,2014),our molecular dating analyses based on nuclear and cpDNA data sets suggest that the divergence of Fraxinus chiisanensis occurred in the Late Miocene(6.7 mya[N1]and 5.5 mya[C1]in Fig.2).The existence of Fraxinus species on the Korean Peninsula during the Miocene is also supported by fossil evidence(Jung and Lee,2009),although it is difficult to determine the relationships between these fossil species and extant F.chiisanensis.This timing indicates that the divergence within F.chiisanensis may have been initiated by the East Asian monsoon,which was enhanced by the continued uplifts of the Himalayas and the Tibetan Plateau(Zheng et al.,2004;Spicer,2017;Spicer et al.,2020).The enhanced monsoon system was involved in the initial species diversification during the Late Miocene and Pliocene(Ha et al.,2018;Chen et al.,2020;Wang et al.,2020).For example,the divergence of Forsythia species in East Asia mainly occurred during the Late Miocene and Pliocene(Ha et al.,2018).The intensification of the East Asian monsoon brought high precipitation in summer during the Late Miocene epoch.As for the relationship between rainfall and diversification of plant species in East Asia,Wang et al.(2011)suggested that annual rainfall is a useful predictor for the species diversification of woody plants.Thus,our results suggest that changing climate conditions and tectonic activities before the Quaternary may have been an important factor in the initial divergence of F.chiisanensis.
4.3.Conservation of Fraxinus chiisanensis
The nrITS and cpDNA data set analyses of five populations of Fraxinus chiisanensis revealed a low degree of sequence type diversity(Rd=0.540,Cd=0.653)compared to its sister species,F.platypoda from Japan(Rd=0.744,Cd=0.886;Table 2),although the Pd of F.chiisanensis showed higher diversity than that of F.platypoda.Based on nrITS and cpDNA data sets,the mean value within the population diversity of F.chiisanensis(mean Rd=0.224,Cd=0.392)was considerably lower than that of F.platypoda(mean Rd=0.690,Cd=0.850).In general,aside from the population size of a species,the level of genetic diversity in a population is associated with breeding system and evolutionary time(Frankham et al.,2002).Species that are pollinated by the wind and have a long evolutionary history exhibit relatively high genetic diversity.Both F.chiisanensis and F.platypoda are anemophilous flowers and have a similar time of species diversification(Fig.2).Therefore,the low genetic diversity detected in F.chiisanensis is not related to the breeding system or evolutionary history in the Late Miocene.Instead,the low genetic diversity of F.chiisanensis may be associated with human activities in addition to its high genetic differentiation(Table S7).Our finding that F.chiisanensis has high population differentiation was reinforced by AMOVA,which showed that a larger proportion of genetic variation exists among F.chiisanensis populations than among F.platypoda populations(Table 3).Over the last several decades,the extant populations of F.chiisanensis have decreased due to human timber collection(Lee et al.,2009).The populations of F.chiisanensis are now smaller and more isolated from each other than in the past,especially the DY,KH,and BU populations.Under these conditions,genetic drift may reduce genetic variation in isolated populations.Furthermore,many studies indicate that smaller populations have lower genetic diversity than larger populations due to genetic drift(Frankham,1996;Fischer et al.,2000).
The main goal of conservation for endemic species is to ensure the existence of a species and to maintain its evolutionary potential by retaining natural levels of genetic diversity(Frankham et al.,2002).In general,there is no alternative to in situ conservation for most wild plant species because it continues to expose natural populations to evolutionary processes(Meilleur and Hodgkin,2004).Therefore,habitat conservation for endangered species,including Fraxinus chiisanensis,is critical.However,even in a natural habitat,populations can suffer a rapid loss of genetic diversity that is predicted to have many negative consequences for population viability(Ellstrand and Elam,1993;Kim et al.,2008a,b).This loss can occur as a result of numerous anthropogenic effects,such as partial habitat destruction,pollution,and climate change.Korean F.chiisanensis populations in this study showed lower genetic diversity and higher genetic differentiation than congenic species that occurred in Korea and Japan(Tables 2 and S7).The survival of Korean F.chiisanensis is increasingly precarious due to habitat destruction caused by humans.Immediate actions are required to prevent further decreases in genetic variation,a decline in adaptive ability,and an increased risk of species extinction.Therefore,it is important to be aware of F.chiisanensis population sizes to implement in situ conservation methods.
Ex situ conservation has numerous limitations and is not an alternative to in situ conservation(Volis and Blecher,2010),but it can help to conserve/restore the genetic diversity of an endangered species,especially when accompanied by reintroduction into natural habitats(Menges,1991;Schwartz et al.,2006).Therefore,ex situ conservation oriented towards reintroduction should be applied to Korean Fraxinus chiisanensis populations with low genetic diversity within populations undergoing a high level of habitat destruction.F.chiisanensis trees mainly reproduce sexually(Wallander,2008).Therefore,seeds can be harvested and maintained ex situ.Because F.chiisanensis has low population genetic variation,its total genetic coverage can be reasonably covered by collecting only a few samples per population.The observed high genetic differentiation between Korean populations implies that the extinction of any population will reduce total genetic variability.Thus,every population of F.chiisanensis should be considered as a target for ex situ conservation.Although translocation can rapidly enlarge the gene flow among populations,it is important to avoid the outbreeding depression that can result from the admixture of individuals from different populations.Each population should be preserved separately in well-designed pools,while individuals from the same population need to be kept in the same pool for genetic enhancement of outcrossing.
Volis and Blecher(2010)proposed ‘quasi in situ conservation’for endangered plant species,which uses ex situ collections in natural or semi-natural environments as a part of a complex ex situ-in situ conservation strategy.Moreover,they demonstrate the effectiveness of quasi in situ conservation using critically endangered Iris atrofusca from Israel(Volis et al.,2009).Thus,to design the most appropriate and effective quasi in situ conservation and environmental management strategies for F.chiisanensis species,detailed studies of field sampling strategies and reproduction biology should be performed.
Author contributions
J-HK conceived and designed the experiments.CK,D-KK,HS,and J-HK collected plant material.CK performed the experiments and analyzed the data.CK wrote the draft and J-HK revised the draft.
Declaration of competing interest
All authors agreed on the contents of the paper and declared that no competing interests exist.
Acknowledgements
The authors thank Drs.S.Kikuchi,S.Kanetani,and J.Worth(Forestry and Forest Products Research Institute)for help in collecting plant material.This work was supported by grants from the Korea National Arboretum(Grant no.KNA1-1-13,14-1)and Gachon University(Grant no.2018-0320)to J-H Kim.
Appendix A.Supplementary data
Supplementary data to this article can be found online at https://doi.org/10.1016/j.pld.2021.06.004.
杂志排行
植物多样性的其它文章
- Non-host plants:Are they mycorrhizal networks players?
- A revision of Dryopteris sect.Diclisodon(Dryopteridaceae)based on morphological and molecular evidence with description of a new species
- Identification and fine mapping of rtms1-D,a gene responsible for reverse thermosensitive genic male sterility from Diannong S-1X
- Genome-wide analysis of the B3 transcription factors reveals that RcABI3/VP1 subfamily plays important roles in seed development and oil storage in castor bean(Ricinus communis)
- Global patterns of fern species diversity:An evaluation of fern data in GBIF
- Oreocharis xieyongii,an unusual new species of Gesneriaceae from western Hunan,China