Optimization of extraction technology of safflower polysaccharide based on central composite design-response surface methodology
2022-04-22RuiWangYaLanLiHaoTianBaiJingYang
Rui Wang, Ya-Lan Li, Hao-Tian Bai, Jing Yang
1. School of Pharmacy,Heilongjiang University of Traditional Chinese Medicine,Harbin 150040,China
2. Basic Medical College of Heilongjiang University of Traditional Chinese Medicine,Harbin 150040,China
Keywords:Safflower polysaccharide Central composite design Extraction process Extraction percentage
ABSTRACT Objective: To explore the best extraction technology of safflower polysaccharide by central composite design response surface methodology and evaluate its quality. Methods: Taking the extraction rate of Carthamus tinctorius polysaccharide as the index, taking the ratio of solid to liquid, extraction time, extraction temperature and extraction times as the investigation factors, based on the single factor experiment, the central composite design-response surface methodology was used to optimize the optimum extraction process of Carthamus tinctorius polysaccharide and verify it. Results: The response surface model was established with the extraction rate of Carthamus tinctorius polysaccharide as dependent variable Y, the ratio of solid to liquid, extraction time and extraction temperature as independent variables X,P<0.0001. The optimum extraction process was as follows: the ratio of solid to liquid was 1: 16.69, the extraction temperature was 91.39℃, and the extraction working time was 89.78min. Under these conditions, the extraction rate of safflower polysaccharide can reach 7.45%, The experimental results show that RSD is 1.05%,and the model can well predict the experimental results. Conclusion: Central Composite Design-Response Surface Methodology has the advantages of high extraction rate, simple, effective and reasonable process operation,high stability and high precision, which can be fully applied to the resource management and utilization of safflower polysaccharide.✉Corresponding author: YANG Jing, Professor, Supervisor of Master Students, M.D..
1. Introduction
Carthamus tinetorius L, also known as "red and blue flower".According to the textual research of Materia Medica, "safflower"first appeared in New Materia Medica, which is a medicine for promoting blood circulation and removing blood stasis. It can help circulation, relieve pain and eliminate blood stagnation[1]. Many literary reports have pointed out that safflower has many biological activities such as inhibiting coronary artery hypertrophy, resisting oxidation, resisting myocardial ischemia, anticoagulation and thrombosis [2-4]. Safflower is not only used as Chinese medicine,but also widely used in the production of Chinese medicine,such as safflower oil, safflower oral liquid, safflower injection and safflower powder [5-6]. At present, there are many studies on safflower hydroxyyellow pigment, safflower hydroxyred pigment and flavonoids, but few studies on safflower polysaccharide, which is one of the main chemical components of safflower, and its main structures are glucose, arabinose, xylose and galactose [7]. In recent years, the research on safflower polysaccharide at home and abroad mainly focuses on its anticancer and immunomodulatory effects.Yang[8] and others have proved that safflower polysaccharide can inhibit cell proliferation and induce apoptosis in vitro, and can be used as an effective candidate drug for anti-cervical cancer drugs.Therefore, through the development and utilization of Carthamus tinctorius polysaccharide resources, discussing the best extraction process will promote the development and utilization of Carthamus tinctorius polysaccharide.
Central Composite Design-Response Surface Method is mainly a five-factor and five-level experimental project to investigate the effect of independent variables. Its basic principle is to describe the effect surface corresponding to the interaction of research factors, select the best effect area from the effect surface, and infer the value range of independent variables studied according to the best experimental conditions-the best effect area [9]. The number of experiments of central point design is less, the predictability is good, and the application is convenient, which can improve the shortcomings of orthogonal experiments to a certain extent and ensure the accuracy of experiments. Although the central point design-response surface method is sufficient for factor analysis, the accuracy is still not enough to completely replace the traditional design. It is best to use the central point response surface method to find the best area first, and then apply the response surface optimization method to a smaller range [10-11]. Give full play to the advantages of the central point design-response surface method.
2. Materials and methods
2.1 Instruments and reagents
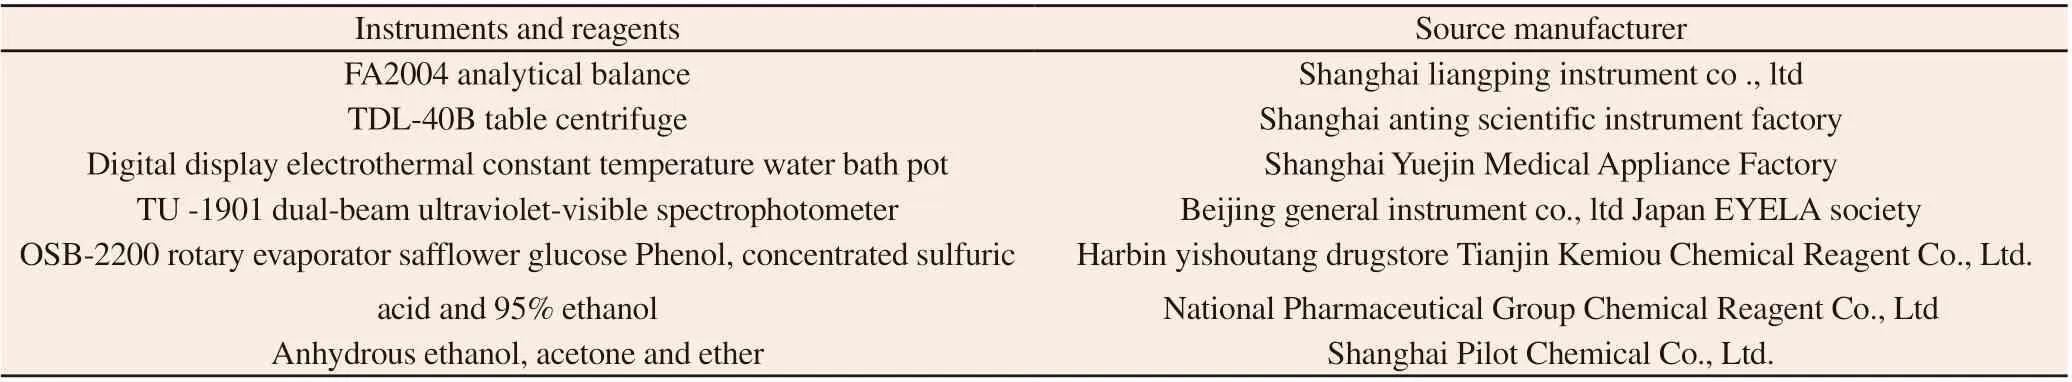
Instruments and reagentsSource manufacturer FA2004 analytical balanceShanghai liangping instrument co ., ltd TDL-40B table centrifugeShanghai anting scientific instrument factory Digital display electrothermal constant temperature water bath potShanghai Yuejin Medical Appliance Factory TU -1901 dual-beam ultraviolet-visible spectrophotometerBeijing general instrument co., ltd Japan EYELA society OSB-2200 rotary evaporator safflower glucose Phenol, concentrated sulfuric acid and 95% ethanol Harbin yishoutang drugstore Tianjin Kemiou Chemical Reagent Co., Ltd.National Pharmaceutical Group Chemical Reagent Co., Ltd Anhydrous ethanol, acetone and ether Shanghai Pilot Chemical Co., Ltd.
2.2 Experimental method
2.2.1 Determination of polysaccharide in safflower
2.2.1.1 Making standard curve
Preparation of standard solution: Weigh 20mg anhydrous dry glucose into a 200mL volumetric flask, and adjust the volume to the scale. Accurately suck 0.1, 0.2, 0.4, 0.8 and 1.0ml of the solution into a 10ml test tube with a stopper, and fix the volume to 2.0ml. 5~ 50 g ml-1 glucose standard solution was prepared [12]. Take 2.0ml distilled water as a blank.
Preparation of safflower polysaccharide solution: According to the preparation steps of standard solution, the concentration of safflower polysaccharide solution was prepared at 200 g mL-1. Pipette 4~20 mL stoppered tubes from the polysaccharide solution, and add water to dilute to 2.0ml, to obtain a 40 g mL-1 polysaccharide solution.
Determination of the maximum absorption wavelength:Accurately measure 1.0ml of the glucose solution and 1.0ml of the polysaccharide solution, and add 1.0 mL of distilled water to the test tube, and mix with 1.0 mL of 5% phenol solution and 5.0ml of concentrated sulfuric acid, respectively, seal, and cool to room temperature. Scan between 400nm and 700nm to determine the highest absorption wavelength.
Establishment of standard curve: To the above standard series solutions, add 1ml of phenol and 5ml of concentrated sulfuric acid,allow to cool at room temperature, and determine the absorbance of the solutions at 481nm.
2.2.1.2 Precision experimentAccurately weigh 20 mg of the polysaccharide sample and perform six consecutive determinations at 481 nm as described in "1.2.2.1".
2.2.1.3 Repeatability experimentSix polysaccharide samples were weighed with precision, and the six solutions at 0.1 mg mL-1 concentration were prepared according to the method of "1.2.2.1", and the OD value was determined.
2.2.1.4 stability experiment
Press "1.2.2.1" to determine the OD value of the same sample within 0-200 min.
2.2.1.5 Sample addition recovery experiment
Accurately weigh 20mg of Flos Carthami polysaccharide, dilute to volume in a 100ml volumetric flask, and absorb 1.0ml to 10ml.Accurately aspirate six parts of 1.0ml polysaccharide sample solution, and place into a 20ml test tube. Add three parts of 30 and 50 g mL-1 of 1.0ml glucose standard solution, respectively. Follow the method under "1.2.2.1" and calculate the recovery rate according to the formula. Place 20mg of Carthamus tinctorius polysaccharide in a 100-mL volumetric flask, absorb 1.0ml of the solution, and add water to 10 ml. Pipette six 1.0ml polysaccharide sample solutions into 20ml tubes, and add three portions of 30 and 50μg ml-1 glucose standard solutions, respectively. Calculate the recovery as per the method under "1.2.2.1".
The recovery rate is (m-c) ÷ v × 100%
In which m is that polysaccharide amount measure after mix, c is the polysaccharide amount in the sample, and v is the added amount of glucose.
2.2.1.6 Determination of polysaccharide content
Correctly weigh 20mg of polysaccharide, mix well in a 100-mL volumetric flask, and add 1.0ml of water to 100ml. Take 1.0ml of the sample solution, determine the OD value under "1.2.2.1", and calculate the content according to the formula.
2.2.2 Single factor experiment
2.2.2.1 investigated the effect of different factors on extraction rateThe other conditions were fixed and the solid to liquid ratio was changed to 1: 5-1: 20, the extraction time was 30 min-120 min,the number of extraction was changed to 1-4 times, the extraction temperature was changed to 70℃-100℃, and the safflower polysaccharide was prepared under the condition of "1.2.1" to investigate the changes in the extraction rate of safflower crude polysaccharide.
2.2.3 Optimization of extraction process of safflower polysaccharide by central composite design-response surface methodology
2.2.3.1 Experimental design of star point
According to single factor analysis, the extraction times had no significant effect on the extraction rate of crude polysaccharide from Carthami Flos (P > 0.05). Therefore, based on the single factor experiment, the solid-liquid ratio (X1), extraction time (X2) and extraction temperature (X3) were set as the investigation factors,and the extraction rate of polysaccharide from Carthami Flos (Y)was taken as the evaluation index. All factors were set at 5 levels.Expressed as-α, -1, 0, +1,+ , respectively. For the three-factor star point design = 1.682. Experimental factors and level arrangement are shown in table 1.
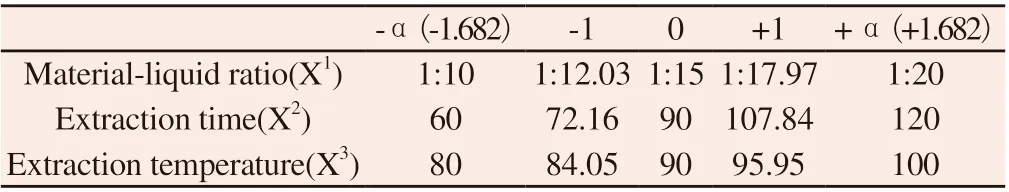
Table 1 Factor level of central point design-response surface method
3. Results
3.1 Safflower polysaccharide content determination
3.1.1 Production of standard curveThe maximum absorption wavelength of safflower polysaccharide was determined by scanning the range from 400nm to 700nm using an ultraviolet spectrophotometer, and the results are shown in Fig. 1 and Fig. 2.

Figure 1 UV scanning curve of safflower polysaccharide
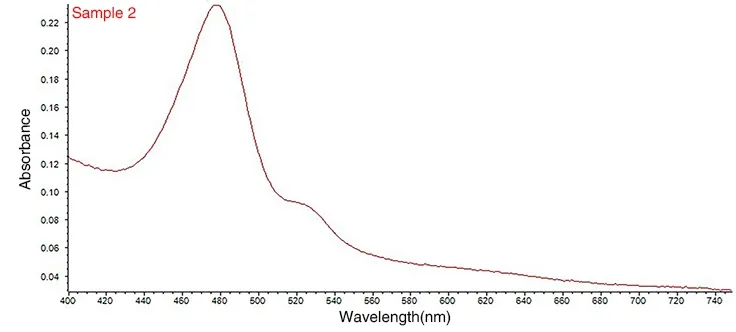
Figure 2 UV scanning curve of glucose
The phenol-sulfuric acid method was adopted [13]. As shown in Fig. 1 and Fig. 2, both glucose and safflower polysaccharide have maximum absorption at 481nm, so glucose can be used as the standard reference substance of safflower polysaccharide to determine its content.
Referring to the method under "1.2.2.1", with absorbance (A) as the vertical coordinate and glucose standard solution concentration(C, g mL-1) as the horizontal coordinate, a standard curve was drawn according to the data results analyzed by target detection technology and the linear relationship model regression was conducted. Results are presented in figure 3. The standard curve equation of absorbance(OD value) for glucose concentration was obtained as Y=0.0092x-0.0049(R2=0.9999). From the curve, it could be seen that the OD value had a good linear relationship with glucose concentration in the range of 5-50 g mL-1.

Figure 3 Standard curve
3.1.2 Precision experimentSix determinations at 481nm gave an average absorbance of 0.151.The results are shown in Table 2, and RSD is 1.859%, indicating that the precision of the method is good.
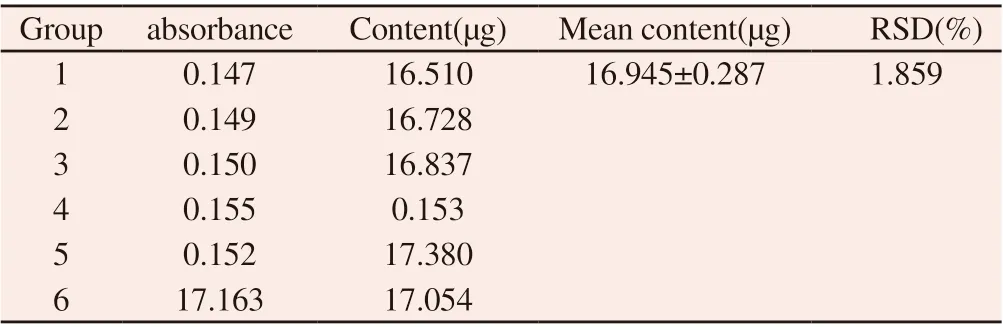
Table 2 Experimental results of determination precision of safflower polysaccharide content
3.1.3 Repetitive experimentsFollowing the method "1.2.2.3", the RSD was 2.257%, indicating good repeatability, as shown in Table 3.

Table 3 Repetitive experimental results of determination of safflower polysaccharide content
3.1.4 Stability experiment
According to the operation under the "1.2.2.4" method, the absorbance showed a downward trend after 200min, and the polysaccharide solutions were stable within 200min. RSD was 2.393%. The result are shown in table 4.
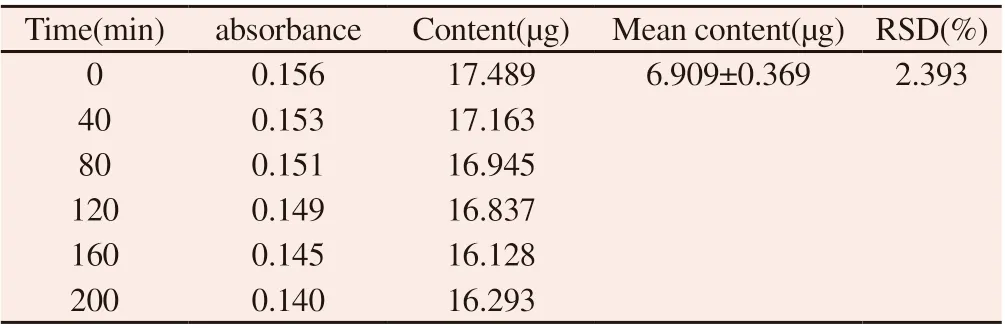
Table 4 Stability test results of safflower polysaccharide content determination
3.1.5 Sample recovery experimentOperating according to the 1.2.2.5 method, the average recovery was 97.320 0.0262% and RSD was 2.949%, as shown in Table 5.
3.1.6 Determination of polysaccharide contentThe polysaccharides were determined according to the content under "1.2.2.6", and the results are shown in Table 6.

Table 5 Determination Results of Recovery Rate of Glucose Sampling Experimental Results

Table 6 Determination of polysaccharide content in safflower
3.2 Analysis of single factor test results

Figure 4 Effect of solid-liquid ratio on polysaccharide extraction rate
3.2.1 Effect of solid-liquid ratio on extraction rate investigatedAs shown in Fig. 4, different solid-liquid ratio had a greater effect on the polysaccharide content. When the solid-liquid ratio was greater than 1:1, the solid-liquid ratio had a significant effect on the polysaccharide content. When the solid-liquid ratio exceeded 1:15,the extraction rate decreased slightly, which might be due to the excessive amount of water and the excessive dilution of the drugs,resulting in the reduction of the extraction rate. The optimal solidliquid ratio was 1:15.

Figure 5 Effect of extraction time on extraction rate of polysaccharide
3.2.2 effect of extraction time on extraction rateAs shown in Fig. 5, when the extraction time was about 90min, the extraction rate increased with the passage of time. If the extraction time was more than 90min, the extraction rate decreased. Therefore,90 min was the optimal extraction working time.

Figure 6 Effect of extraction times on polysaccharide extraction rate
3.2.3 effect of extraction time on polysaccharide extraction rateAs shown in Fig. 6, when the number of extraction times was 2, the highest polysaccharide extraction rate was obtained. The more the number of extraction times was, the greater the polysaccharide loss would be. Therefore, the optimal number of extraction times was 2.

Figure 7 Effect of extraction temperature on extraction rate of polysaccharide
3.2.4 Investigation of the effect of extraction temperature on the extraction rateAs shown in Fig. 7, the extraction rate of polysaccharides increased with the temperature, and the highest extraction rate was 90℃,which was twice as high as 60℃. Therefore, 90℃ was selected as the optimal extraction temperature.
3.3 Design results and analysis of satellite experiments

Table 7 Experimental arrangement results of star point design
3.3.1 Model fitting
Quadratic polynomial equation model fitting was continuously performed for each level of each factor through Design Expert 8.0 software. According to the equation, the three-dimensional effect surface and the two-dimensional contour line were drawn by Design Expert 8.0 software, and the optimal combination was selected.Quadratic equation fitting:

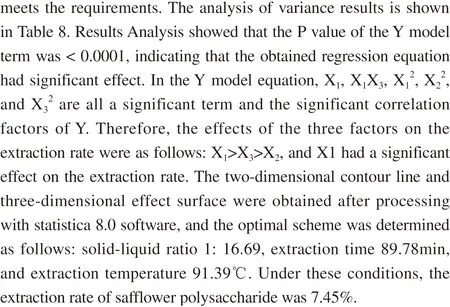

Figure 8 Effect surface and contour map of extraction time and solid-liquid ratio on extraction rate of safflower polysaccharide

Figure 9 Effect surface and contour map of extraction temperature and solidliquid ratio on extraction rate of safflower polysaccharide
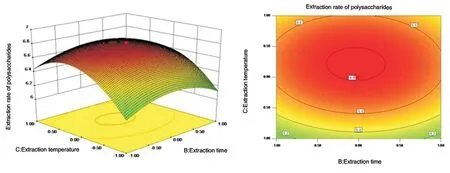
Figure 10 Effect surface and contour map of extraction temperature and extraction time on extraction rate of safflower polysaccharide
The three-dimensional effect surface diagram and two-dimensional contour line for the interaction between each factor are shown in Figs. 8-10.The response surface and contour plots in Figs. 8-10 reflected the interactive effects of solid-liquid ratio (X1), extraction time (X2)and extraction temperature (X3) on the extraction rate of safflower polysaccharide. The order of significance of the impact surface from large to small was X1>X3>X2, which was consistent with the conclusion of ANOVA.
3.4 Validation test of extraction process of safflower polysaccharide
Three portions of safflower polysaccharide were weighed in parallel and operated under the optimal process conditions according to the preparation method of the test product to determine the extraction rate of safflower polysaccharide. The verification test results are shown in Table 9.
Table 9 showed that under the optimal extraction conditions, the extraction rate of safflower polysaccharide was high and stable.
Table 8 Analysis of variance results

Table 9 Verification Test Results Table
4. Discussion
Common experimental research methods for determining the content of different polysaccharides include phenol-sulfuric acid method, anthrone-sulfuric acid method and orcinol-sulfuric acid method [14-15]. Compared with other methods usually used to determine the polysaccharide content, the phenol-sulfuric acid method is more sensitive, convenient and stable in color [16]. The sensitivity of the ultraviolet spectrophotometer method for the detection of polysaccharides was high, but its stability was not very good. In the experimental process, experimental data errors were caused by such erroneous factors as operation, absorption time, and color developing process, which affected the experimental results to some extent [17].
In this experiment, the polysaccharides extracted by water extraction and alcohol precipitation method had little damage and high yield [18]. The single factor experiment was used to investigate each factor in order to further narrow the range of each factor. The optimal extraction conditions of safflower crude polysaccharide were selected according to the central composite design-response surface methodology. Compared with other designed experiments,the star point design-response surface method has the advantages of high accuracy, good predictability, less experiments, and being able to investigate the interaction of various factors at the same time, proving that this method has certain research value [19-20]. The optimal conditions could lay a foundation for the development and utilization of safflower polysaccharide and make a breakthrough in clinical research.
Author's contribution: The design idea of this paper is provided by Professor Yang Jing; The specific experimental process was completed by Rui Wang and Li Yalan. Data analysis and result processing were completed by Bai Haotian.
杂志排行
Journal of Hainan Medical College的其它文章
- Research progress in molecular epidemiology of Cryptosporidium in non-human primates
- Study on the effect of Danbei Yifei formula on pulmonary fibrosis based on network pharmacology and molecular docking technology
- Analysis of the law of traditional Chinese medicine in prevention and treatment of gastrointestinal reaction caused by lung cancer chemotherapy
- Significance of preoperative fibrinogen levels, neutrophils-tolymphocyte ratio and its combined scores in evaluating the prognosis of postoperative patients with gastric cancer
- Comparison of the curative effect of intracoronary retrograde thrombolysis and thrombus aspiration combined with stent implantation on STEMI patients
- Mechanism of calcium hydroxide inhibiting methicillin resistant Staphylococcus aureus