Electrostatic interactions in twisted bilayer graphene
2022-04-13ommsoCePierrePntleoNielsWletFrnciscoGuine
ommso Ce, Pierre A. Pntleo′n, Niels R. Wlet, Frncisco Guine ,c,*
a Imdea Nanoscience, Faraday 9, 28015, Madrid, Spain
b Department of Physics and Astronomy, University of Manchester, Manchester, M13 9PY, UK
c Donostia International Physics Center, Paseo Manuel de Lardiz′abal 4, 20018, San Sebasti′an, Spain
Keywords:Graphene Twisted Interactions
ABSTRACT The effects of the long range electrostatic interaction in twisted bilayer graphene are described using the Hartree-Fock approximation.The results show a significant dependence of the band widths and shapes on electron filling,and the existence of broken symmetry phases at many densities, either valley/spin polarized, with broken sublattice symmetry, or both.
1. Introduction
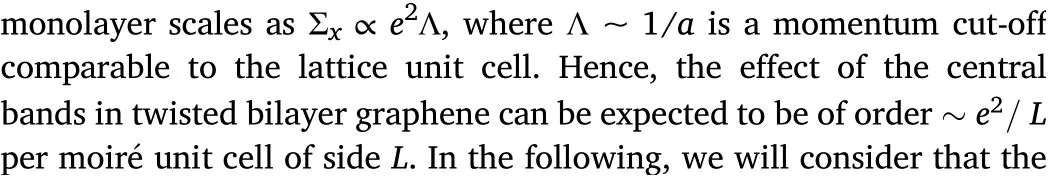
The discovery of a complex phase diagram in twisted bilayer graphene[1,2],which includes superconducting and insulating phases,has led to an extensive study of the role of interactions in the electronic structure of this system (see also [3–5]). The existence of narrow bands can be obtained from a continuum model for a twisted bilayer graphene bilayer [6] (see also [7,8]), as reported in Ref. [9]. Similar results have been obtained using lattice based tight binding models[10,11].The two techniques tend to give consistent results. Twisted bilayer graphene forms a moir′e pattern with the lattice period L=a/[2 sin(θ/2)],where a≈2.46Åis the lattice constant of graphene, and θ is the twist angle expressed in radians. The reported narrow bands occur for twist angles θ ≈1°, and thus for a moir′e lattice vector of L ≈a/θ ≈15 nm. Typical widths of the bands nearest to the Fermi energy range from W ~ 1 -5 meV. The central bands accommodate an electron density of order -4×L-2≲4×ρ ≲~L-2,where L-2~1012cm-2.The factor 4 arises from the spin and valley degeneracy of each band.The fact that L ≫a allows us to classify the strength of interactions in terms of their dependence on a/L~10-2,or,alternatively,in terms of the number of carbon atoms in the unit cell,N~(L/a)2~104.n inhomogeneous charge distribution on the scale of L leads to electrostatic energies of the order e2/(εL) ~10 - 50 meV, where ε ~ 4 - 10 is the dielectric constant of the environment[12].This energy scales as L-1~1/√——N.The existence of atomic orbitals modifies the electron-electron repulsion at length scales comparable to the lattice constant,a.This effect is best described by including an intra-atomic Hubbard term, UH≲e2/a ~ 2 - 6 eV, and other inter-atomic interactions. Two electrons in the central bands have a probability ~1/N2of being on the same atom.Hence,the contribution of a Hubbard term to the energy of the central bands per moir′e unit cell is~UH×N×1/N2~UH/N.
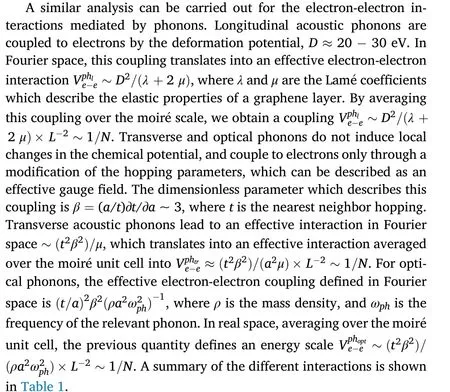
The qualitative analysis presented here shows that the leading electron-electron interaction in twisted bilayer graphene at small angles,θ~1°,where the number of atoms in the unit cell is large,N~104≫1,is the long range electrostatic interaction. In most crystalline solids, theleading effects of this interaction can be captured by the Hartree-Fock approximation. Moreover, twisted bilayer graphene at sufficiently high temperatures shows a metallic behavior, with features consistent with the existence of a Fermi surface.This metallic phase can be expected to be amenable to a mean field, Hartree-Fock, description.
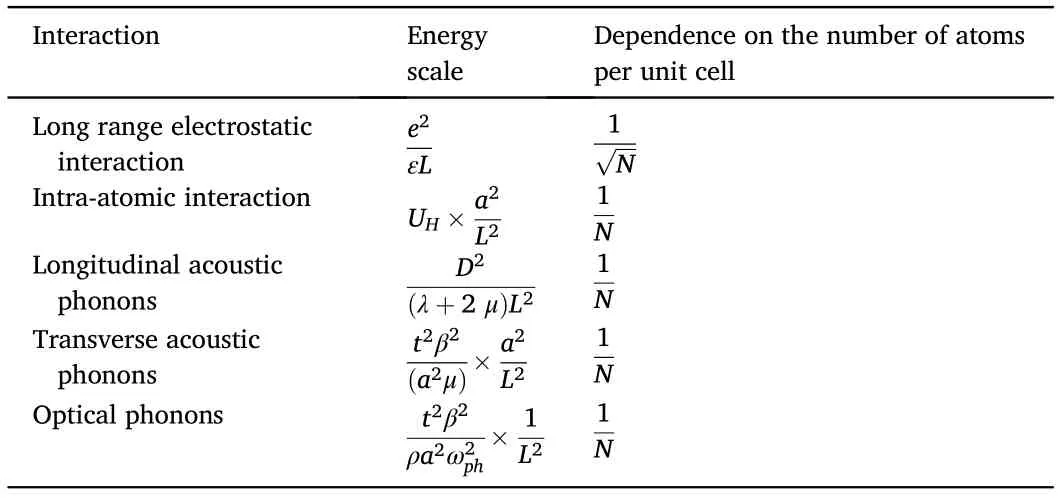
Table 1 Interactions(left),typical energies averaged over the moir′e unit cell(center),and dependence on the number of atoms in the unit cell(right).
In the following, we describe the main features obtained so far in Hartree-Fock analyses of twisted bilayer graphene.This approximation is standard in quantum mechanics,and it gives useful insights in theoretical condensed matter physics. We will focus mostly on studies carried out using the continuum model for the electronic structure of twisted bilayer graphene[9],although lattice-based tight-binding models have also been considered[10,11].Using the continuum approximation,the problem is defined in terms of three quantities with dimensions of energy, which describe the non interacting band,vF/L,g1and g2.The parameter vFis the Fermi velocity,and g1and g2are averages of the interlayer hopping,see below. Finally the interactions are described by the parameter e2/ε,where e is the electric charge, and ε is the dielectric constant of the environment.
This brief review is focused on recent results on the electronic structure of twisted bilayer graphene,obtained within the Hartree-Fock theory. It is worth mentioning that the Hartree-Fock approximation has been extensively used for the analysis of interactions in two dimensional materials[13],including the energy splittings of flat Landau levels[14].This paper does not attempt to cover in full the already extensive literature devoted to this topic. We leave out analyses beyond mean field,such as RPA calculations of the low energy excitations[15–23].The main conclusions,which description a number of novel features almost unique to twisted bilayer graphene,are consistent with most studies carried out to date.
The next section discusses the main features of the model.Then, we describe the implementation of the Hartree-Fock approximation to the study of long range interactions in the model. The following section presents the dependence of the electronic bands on band filling and twist angle. We discuss next possible broken symmetry phases. Finally, we highlight a number of novel features induced by long range electrostatic interactions,treated within the Hartree-Fock approximation.
2. The Hartree-Fock approximation within the continuum model of TBG
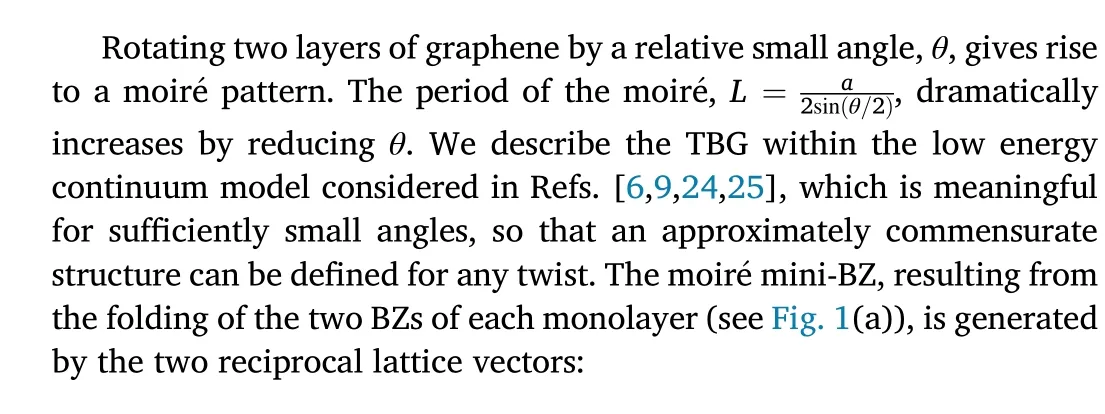
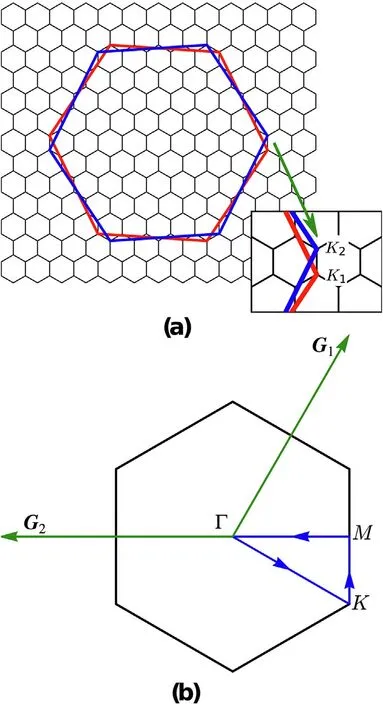
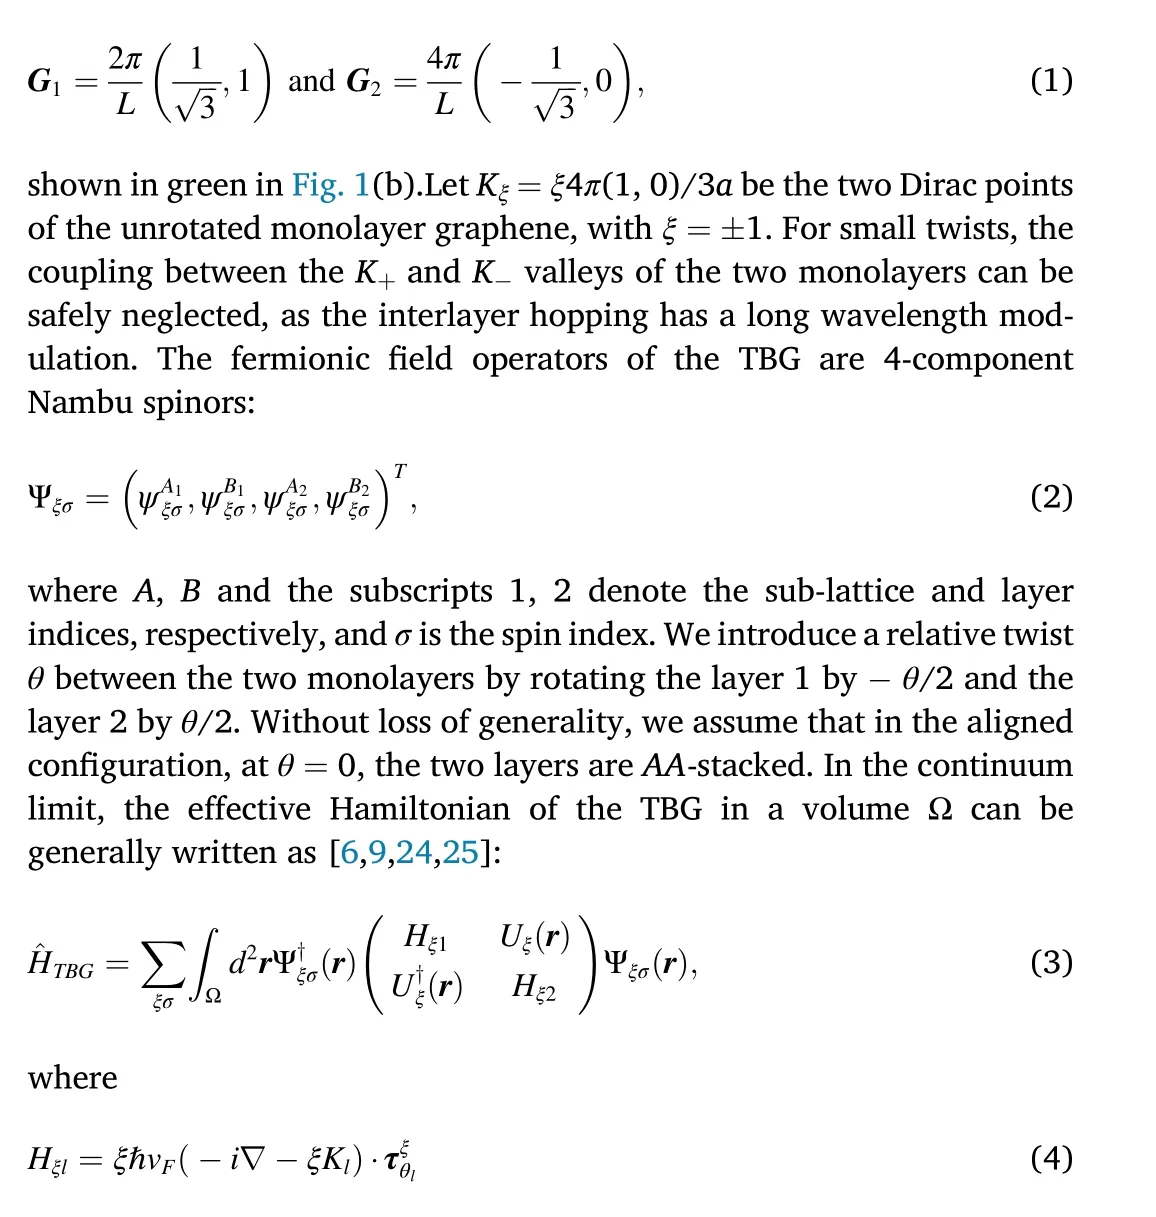
Fig.1. (a)Folding of the BZs of each of the monolayers in bilayer graphene.The BZ of layer 1 (indicated by the red hexagon) is rotated by - θ/2, while that of the layer 2 (the blue hexagon) is rotated by θ/2. The small black hexagons represent the unit cells forming the reciprocal moir′e lattice.In the inset we show K1,2 are the Dirac points of the twisted monolayers,which identify the corners of the mini-BZ [25]. (b) mini-BZ. G1,2 are the two reciprocal lattice vectors. The blue line shows the high symmetry circuit in the mini-BZ used to compute the bands shown in the following.
In the following we adopt the parametrization of the TBG given in the Ref.[25]: ℏvF/a = 2.1354eV, g1= 0.0797eV and g2= 0.0975eV. The difference between g1and g2,as described in Ref.[25],accounts for the inhomogeneous interlayer distance, which is minimum in the AB/BA regions and maximum in the AA ones, or it can be seen as a model of a more complete treatment of lattice relaxation [26]. In that latter reference it is also explained that one may want to use the full dispersion of the graphene bands, and it is shown that in general the Fermi surface shifts as a function of twist angle. If we focus, e.g., on the ξ = + valley,then the Hamiltonian of Eq. (3) hybridizes states of layer 1 with momentum k close to the Dirac point with the states of layer 2 with momenta k,k +G1,k+ G1+ G2.
In the absence of interactions, the band structure and the DOS per moir′e unit cell of the mini-bands at charge neutrality(CN)are shown in Fig.2,for θ =1.05°.The green dashed line identifies the Fermi energy.The bands are computed along the high symmetry circuit of the BZ denoted by the blue arrows in Fig. 1(b). Here we are showing only one valley, the opposite one being related by the time-reversal symmetry,upon inverting k to - k. AC=L2√---3/2 is the area of the moir′e unit cell and the DOS is normalized to 8,accounting for two bands and four spin/valley flavors.As deeply studied in the past literature[6,9],these bands are characterized by a very narrow bandwidth, ≲5 meV, and by an almost vanishing Fermi velocity as compared to that of monolayer graphene, thus pinning the DOS at the two van Hove singularities in Fig.2(b).

Fig. 2. (a) mini-bands of the non-interacting TBG at CN, obtained for the twist angle θ = 1.05° and computed along the high symmetry circuit of the BZ denoted by the blue arrows in Fig. 1(b). The green dashed line identifies the Fermi energy. (b): DOS per moir′e unit cell, normalized to 8.

where r is the position operator in the continuum model,and Iiis a unit 2×2 matrix in the spin,valley,sublattice,and layer degrees of freedom.The mean field analysis described below can be expressed in terms of expectation values of the operator in Eq.(8).Of particular relevance are the expectation values (or form factors) of the type 〈k,m|^ρq|k+ q,n〉,where the indices m and n stand for the central bands. Results in the following sections have been calculated using the parameters ε=10 and d=40 nm,which are realistic values for most experiments.At mean-field level,the Hamiltonian ^HCis replaced by

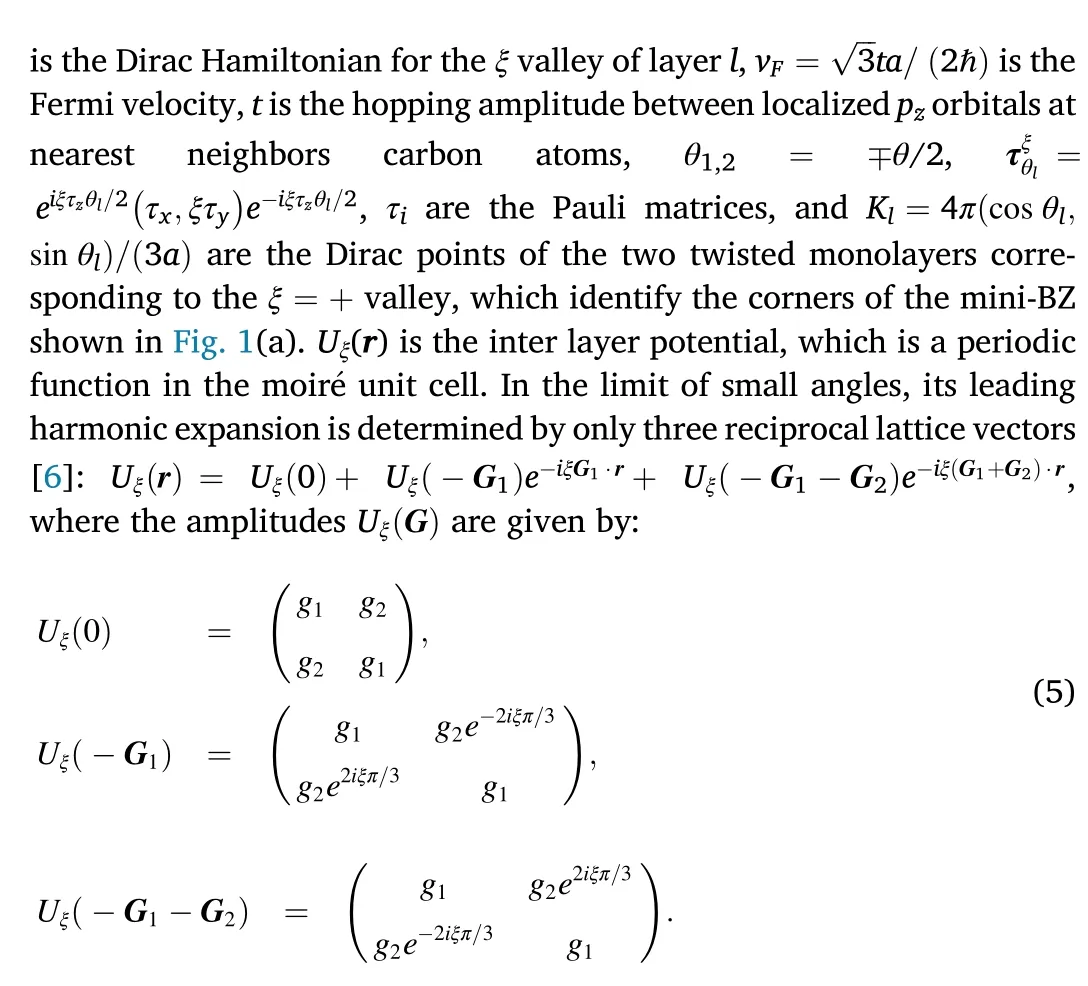
Fig. 3. Charge density at the high symmetry points within the mBZ for the lower band in Fig. 2. White hexagon is the real space unit cell.

contribution of the central bands to the exchange energy in monolayer graphene can be neglected,and that no subtraction is required.We have,

as the zero point energy, which is required to avoid double counting of the total energy at mean-field level.
The mean-field Hamiltonian for the interacting TBG is then:

which we diagonalize self-consistently, by computing the quantum averages of Eq.(10)by means of ^HMFand iterating until convergence.It is worth noting that this procedure is equivalent to minimize the GS energy of ^HMF. In order to diagonalize ^HMF, we exploit the Bloch's theorem,by expressing the eigenfunctions in the basis of Bloch's plane waves defined on the moir′e:

where α runs over all the occupied states above a given threshold.In the present context, we set this threshold to the lowest energy of the minibands in the middle of the spectrum, meaning that we are neglecting the contribution of the bulk bands. However, including other bands might affect quantitatively the results. Because Eq. (13) express the matrix elements in terms of the energy levels and of the corresponding eigenfunctions,φ, they completely define the self-consistent problem.
The main contributions of the long-range interaction are expected to come from small momenta. Therefore, we only consider the matrix elements of the Hartree potential, Eq. (13a), with G - G′belonging to the first star of reciprocal lattice vectors:±G1,±G2,±(G1+G2).Concerning the matrix elements of the Fock potential, Eq. (13b), for each external momentum k we truncate the sum over k′and G′′so that: k - k′- G′′belongs to the BZ. We checked that including larger momenta affects negligibly the results.
Finally,the energy of the GS,as following from Eqs.(9)–(11),is given by:

where ϵkαμare the single-particle energies and the sum over α runs over all the occupied states.
3. Evolution of the band structure as function of filling


Fig. 4. Band structure and DOS corresponding to the non-polarized GS, obtained within the Hartree-Fock approximation at the twist angle θ = 1.05° and filling:ν = 0(a), 1(b), 2(c). The green dashed line identifies the Fermi energy.
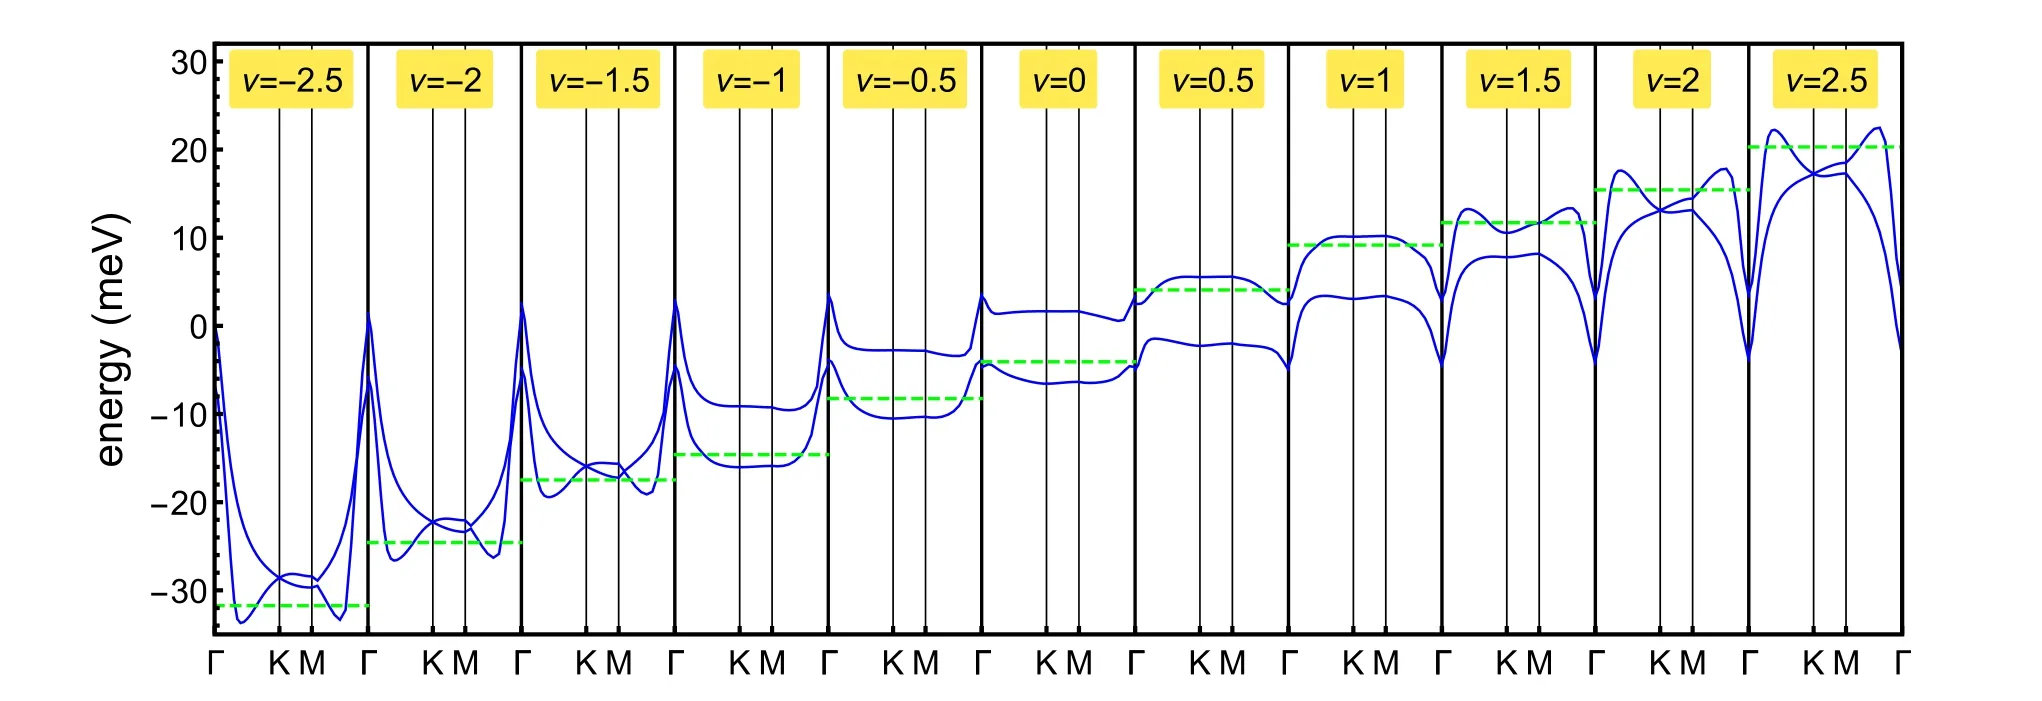
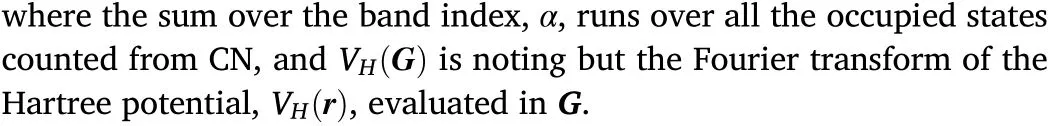
Fig. 5. Evolution of the band structure in the Hartree-Fock approximation upon varying the filling, for - 2.5 ≤ν ≤2.5. The green dashed line identifies the Fermi energy.
Fig. 4 shows the band structure and DOS of the mini-bands of the interacting TBG at θ =1.05°,for the non-polarized GS at positive filling of the conduction bands:ν =0,1, 2,corresponding to CN, one and two electrons per moir′e unit cell, respectively. The green dashed line identifies the Fermi energy. Each band is four-fold degenerate, so that the spin/valley flavors are equally occupied.At ν=0,only the lower band is filled, the C2symmetry is broken and the Fermi surface (FS) is fully gapped. For this choice of parameters, the width of the gap is ~5meV,comparable to the overall bandwidth.At ν=1,one quarter of the upper band is filled,the C2symmetry is still broken,but the FS exists.At ν=2,the C2symmetry is completely restored.
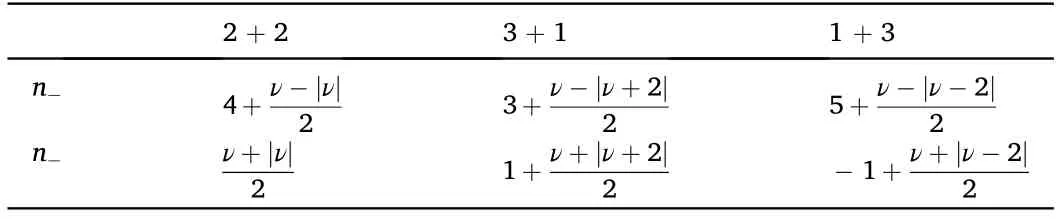
Table 2 Filling of the low occupancy bands, n-, and the high occupancy bands, n+, as function of the total filling, -4 ≤n-≤4, see Fig.6.
The evolution of the band structure corresponding to the nonpolarized solution is shown in Fig. 5, for - 2.5 ≤ν ≤2.5. As it can be seen, solutions breaking the C2symmetry are not stable for ν > 1.5 and ν ≤- 1.5. Two features of the band structure are worth to be further noticed: i) the lack of particle-hole symmetry, so that the bands are not symmetric upon inverting ν to-ν;ii)the bands are rigid at the Γ point of the BZ. This is a consequence of the fact that the charge density of the TBG evaluated at the Γ point of the Brillouin Zone is almost homogeneous as compared to the other high symmetry points of the BZ[30],as shown in Fig.3.The resulting dependence of the band shape on filling factor has been extensively discussed [12,28,31–37]. This significant dependence of the band shape on electron filling implies the existence of a special effective electron-electron interaction, electron assisted hopping[38–42].
The dependence of the Hartree-Fock potential on electron occupancy arises from the variations in charge distribution in different regions of the Brillouin Zone [30]. These variations are determined by form factors of the type:
where G is a reciprocal lattice vector, k and k + q are in the moir′e Brillouin Zone,m and n are band indices,uk,m(r)is the periodic part of the wavefunction associated to|k,n〉,and Ω is the moir′e unit cell.These from factors encode the complexity of the band wavefunctions of twisted bilayer graphene. There are some simplifying approximations made in the literature. These are very convenient because they allow for simple analytical calculations,like the“flat metric condition”used in Refs.[43,44],however,the neglect the dependence of the form factors in Eq.(15)on the position k in the Brillouin Zone. Since the variations of the form factors over the BZ are substantial, it is not immediately clear how realistic this approximation is.
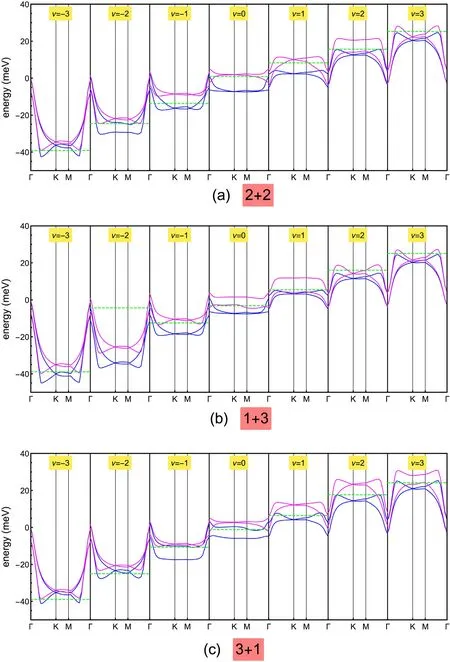
Fig. 6. Band structure obtained at integer filling,-3 ≤ν ≤3,for three different polarized solutions: 2+2(a),1+3(b)and 3+1(c).The blue and magenta lines show the bands of higher and lower occupancy, respectively. The green dashed line in each panel identifies the Fermi energy.
4. Broken symmetry solutions
4.1. Polarized solutions
We consider first valley and/or spin polarized phases, motivated by the “cascade” of phases found experimentally [45]. We define these phases using two integers,n+and n-,so that there are n+bands with high occupancy, and n-bands with low occupancy. For a total occupancy ν,such that-4 ≤ν ≤4,the occupancies of the two types of bands are listed in Table 2.
Fig. 6 shows the evolution of the band structure of the polarized solutions: 2 + 2 (a), 1 + 3 (b) and 3 + 1 (c), for integer fillings and -3 ≤ν ≤3.The high and low occupancy sets of bands are represented by the blue and magenta lines, respectively. Solutions breaking the C2symmetry occur at ν = ±2 for the 2 + 2 solution, ν = 1 for the 1 + 3 solution and ν=-1,3 for the 3+1 solution.Interestingly,the solution 1 +3 does not break C2at ν =-3, in contrast to what is expected.We argue that here the C2symmetry breaking is prevented by the small value of the interaction. Furthermore, it is worth noting that, in the 1 + 3 solution at ν=-2,the empty low occupancy bands mostly stay below the Fermi level. At this filling the Fermi energy, which we define as the highest energy of the occupied states, decreases upon increasing the filling, implying a negative compressibility. This behavior can be better seen in Fig. 7, showing EFas a function of ν and displaying a jump-like discontinuity at ν = - 2. The cyan dashed line in Fig. 7 represents the value of EFas obtained from the derivative of the GS energy with respect to ν, which indeed matches quite well the curve of EFcomputed as described above.However,this anomalous behavior is actually not very meaningful in the present context,as the solution 1+3 turns out to not be stable close to ν =- 2,as emphasized by Figs. 5 and 6.
4.2. Solutions at half filling
The competition between phases at half fliling has extensively been discussed[28,29,37,46].Hartree-Fock calculations at the bands near half filling have already been presented in Figs. 4 and 5. At half filling it is reasonable to expect that the Hartree potential vanishes (note that the continuum model allows us only to compute differences in the charge distribution at different fillings). This assumption is consistent with lattice based tight binding calculations which include the entire pzband[35].It is worth noting that modifciations of the moir′e structure,such as the one induced by heterostrains,can alter significantly the effect of interactions[47].
We assume first that the leading mean field decoupling of the interaction is of the type
where^ρqis the density operator,eq.(8).Within this approximation,the only coupling between electrons of different flavors, valley and spin, is through the Hartree potential,as the density operator,Eq.(8)is diagonal in valley space.
The lack of a Hartree potential implies that the resulting Fock hamiltonian, within the decoupling scheme in Eq. (16) is split into four independent hamiltonians, one for each spin and valley. Each of these hamiltonians admits solutions with the full symmetries of the non interacting Hamiltonian,and,at least one solution where the equivalence between the two sublattices,described by a C2T symmetry is broken.The latter solution shows a gap between the valence and the conduction bands,and it has a lower energy when the valence band is fully occupied and the conduction band is empty. As in this phase the charge has a higher weight in one sublattice,we can describe the corresponding Slater determinant in terms of the spin, valley, and majority sublattice,|Sp,V,S〉, where Sp = ↑, ↓; V = K, K′; S = A, B. In each of the possible 23=8 wavefunctions the occupied valence band is associated to a valley,so that it carries a Chern number C =±1,depending on the combination of valley and sublattice,τzσz.
A possible ground state at half filling is:

where the sublattice labels SSp,Vcan take the values A, B. As this sublattice index can take two values in each component, there are 16 possible wavefunctions of the type shown in Eq. (17). There are two wavefunctions with Chern number C =±4,four wavefunctions with C =±2,and six wavefunctions with C =0.
Other Slater determinants which maximize the overlap between one electron wavefunctions are superpositions of states with the same valley and spin indices. These determinants are globally spin and valley polarized.

where Sp1,Sp2are spin indices,V1,V2are valley indices,and v,c stand for valence and conduction bands.In the limit when the bands are infinitely flat [48,49] this valley/spin polarized wavefunction is degenerate,within the Hartree-Fock approximation, with the sublattice polarized wavefunction in Eq.(17).
The wavefunction in Eq. (17) shows four occupied valence bands,separated by a gap from four unoccupied conduction bands,(the problem reduces to four copies of the bands shown in Fig.8).The valley and spin polarized wavefunction in Eq. (18) shows two occupied valence bands and two occupied conduction bands.In this case,there is no energy gain in opening a gap between the valence and conduction bands.We can expect, in both cases, that the overlap between one electron wavefunctions is higher between states in the same band (valence and conduction) than between states in different bands. If that is the case, the wavefunction in Eq.(17)will have a lower energy,as no conduction band is occupied.
At this stage, the Hartree-Fock approximation leaves undetermined the relative phase between wavefunctions in different valleys and different sublattices. Solutions with well defined phases between Slater determinants in different valleys arise if the mean field hamiltonian allows for inter-valley matrix elements, not included in the decoupling scheme described in Eq.(16).
Such terms can favor an inter-valley coherent (IVC) combination of the type[29]:

Fig. 7. Fermi energy as a function of the filling for the 1 + 3 solution. The continuous black line shows the value of EF as obtained from the highest energy occupied states, while the dashed cyan line represents an alternative definition of EF, the derivative of the GS energy with respect to ν.
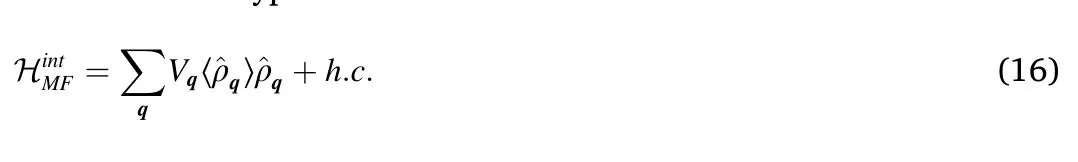
Fig.8. Hartree-Fock bands at a magic angle and at half filling,for a state of the form Eq.(17).We show the self-consistent solutions for initially a)dispersive bands,as in Fig. 2, and in b) for initially non-dispersive bands (chiral model at a magic angle) [48,49].

The existence of a gap in the one particle spectrum of the independent valley solutions shown in Fig.8 implies that inter-valley terms will only appear above a threshold determined by the ratio between the intervalley interactions and the gap. In order to check for the emergence of inter-valley terms in the Hartree-Fock hamiltonian,we have carried out calculations allowing for off-diagonal valley terms in the Hartree-Fock hamiltonian, projecting the hamiltonian onto the two central bands.The effect of intervalley biases in the initial wavefunctions tends to vanish in the interaction towards self consistency, and the bands with and without initial intervalley bias agree within numerical accuracy.These results suggest that the valleys remain decoupled.
Interactions at the atomic scale, will favor a phase in which the two sublattices have equal occupation, over the phase where all the charge resides in the same sublattice[50–53].Finally,the zeroth point energy of excitations above the Hartree-Fock solutions discussed here can also favor specific combinations of wavefunctions of the type shown in Eq.(17)with different Chern numbers[22],see Eq. (19).
It is worth noting that, even in the absence of the Hartree potential,the exchange term induces significant deformations in the band dispersion.The electronic bands associated to the state in Eq.(17)for initially dispersive and for the non dispersive bands resulting from the chiral model[48,49] are shown in Fig.8.
5. Conclusions
We have discussed the electronic properties of interacting electrons in twisted bilayer graphene obtained using the mean field Hartree-Fock approximation. This is usually the initial method to study interactions in theoretical condensed matter physics, and it is also a reasonable starting point to analyze effects beyond mean field theory.The Hartree-Fock method has been applied to the study of the long range electrostatic interactions. Simple scaling arguments suggest that this is the leading interaction between electrons in twisted bilayer graphene.
Despite the simplicity of the method, the Hartree-Fock analysis of interactions in twisted bilayer graphene shows a number of features not commonly found in most materials studied in condensed matter physics.Among them,we can emphasize:
●A significant distortion of the band shapes as function of the electron filling.This effect is mostly driven by the Hartree term,although it is also significant at half filling, solely due to the exchange potential.This filling dependence makes twisted bilayer graphene a system where a good case can be made for the existence of electron assisted hopping.
●The existence of a gapped phase at half filling,driven by the exchange term. This phase is sublattice polarized in each flavor (spin and valley)sector.The Hartree-Fock allows for many combinations of these separate sectors.
●Away from half filling,the Hartree-Fock approximation leads to spin and/or valley polarized phases. As at half filling, the Hartree-Fock approximation respects the spin and valley degeneracy, so that the details of the polarization cannot be resolved.
●The energy differences between the polarized phases away from half filling are small, of the order of a few meV per unit cell. At these scales, other interactions, like the intra-atomic Hubbard repulsion,are likely to play a role, and select the most stable ground state.
Declaration of competing interest
There are no conflicts to declare.
Acknowledgements
This work was supported by funding from the European Commission,under the Graphene Flagship,Core 3,grant number 881603,and by the grants NMAT2D (Comunidad de Madrid, Spain), SprQuMat and SEV-2016-0686, (Ministerio de Ciencia e Innovaci′on, Spain). NRW is supported by STFC grant ST/P004423/1.We are thankful to H.Ochoa ant to M. A. Cazalilla for helpful discussions, and to M. I. Katsnelson for pointing out to the references[38–40].
杂志排行

Namo Materials Science的其它文章
- Recent advances in graphene and other 2D materials
- Editorial for a special issue on graphene and 2D alternative materials: From preparation to potential applications
- First principles study of field effect device through van der Waals and lateral heterostructures of graphene, phosphorene and graphane
- Biaxial versus uniaxial strain tuning of single-layer MoS2
- Room temperature synthesis of two-dimensional multilayer magnets based on α-CoII layered hydroxides
- The effect of rippling on the mechanical properties of graphene