Radiological evaluation of patellofemoral instability and possible causes of assessment errors
2022-04-01TugrulOrmeciIsmailTurktenBayramUfukSakul
Tugrul Ormeci, Ismail Turkten, Bayram Ufuk Sakul
Tugrul Ormeci, Department of Radiology, School of Medicine, İstanbul Medipol University,Istanbul 34200, Turkey
Ismail Turkten, Bayram Ufuk Sakul, Department of Anatomy, School of Medicine, İstanbul Medipol University, Istanbul 34820, Beykoz, Turkey
Abstract Patellofemoral instability (PI) is the disruption of the patella’s relationship with the trochlear groove as a result of abnormal movement of the patella. To identify the presence of PI, conventional radiographs (anteroposterior, lateral, and axial or skyline views), magnetic resonance imaging, and computed tomography are used.In this study, we examined four main instability factors: Trochlear dysplasia,patella alta, tibial tuberosity–trochlear groove distance, and patellar tilt. We also briefly review some of the other assessment methods used in the quantitative and qualitative assessment of the patellofemoral joint, such as patellar size and shape,lateral trochlear inclination, trochlear depth, trochlear angle, and sulcus angle, in cases of PI. In addition, we reviewed the evaluation of coronal alignment, femoral anteversion, and tibial torsion. Possible causes of error that can be made when evaluating these factors are examined. PI is a multi-factorial problem. Many problems affecting bone structure and muscles morphologically and functionally can cause this condition. It is necessary to understand normal anatomy and biomechanics to make more accurate radiological measurements and to identify causes. Knowing the possible causes of measurement errors that may occur during radiological measurements and avoiding these pitfalls can provide a more reliable road map for treatment. This determines whether the disease will be treated medically and with rehabilitation or surgery without causing further complications.
Key Words: Patellofemoral instability; Radiological evaluation errors; Trochlear dysplasia;Patella alta; Tibial tuberosity-trochlear groove distance; Patellar tilt
INTRODUCTION
Patellofemoral instability (PI) is the disruption of the patella’s relationship with the trochlear groove(TG) as a result of abnormal movement of the patella, which is part of the extensor mechanism. Many factors can cause patellofemoral joint instability. Problems with the bony structure of the patella and trochlea [e.g.,the patella alta, increased length of the tibial tubercle–TG (TT-TG), rotational limb malalignment, and trochlear dysplasia (TD)], deficiency in static soft-tissue constraints [e.g.,medial capsular restrictions, medial patellofemoral ligament (MPFL)], or insufficiency of dynamic constraints [e.g.,vastus medialis obliquus (VMO)] can lead to PI[1,2].
The solution to this problem lies in understanding correctly the anatomical problem and the defective biomechanics. Generally, clinical examination is used in diagnosis, but radiological evaluation is also used in diagnosis and differential diagnosis. Therefore, accurate and reliable radiological measurements are important. In radiological evaluation, conventional radiographs (anteroposterior, lateral, and axial or skyline views), magnetic resonance imaging (MRI), and computed tomography (CT) are used[3-5].
Anatomy
The complex function of the knee joint is enabled by the bone structure, which consists of the femur,patella, and tibia as well as ligaments, tendons, and other soft tissue formations.
The patella is the largest sesamoid bone in the body. It fits in the TG of the femur and is part of the extensor mechanism. According to the length of its facets and the localization of the median prominence, Wibeeg[6] defined three types of normal patellar morphology.
In the distal femur, there are TGs in the center, medial and lateral facets on the sides.
The rectus femoris, vastus medialis, vastus lateralis and vastus intermedius muscles form the quadriceps muscle. The quadriceps tendon is included in the extensor mechanism, and this mechanism contributes to patellofemoral joint stability.
The VMO is the primary muscle structure that creates resistance to the patella’s lateral tracking[1].The lateral retinaculum acts as a secondary stabilizer against the medial translation of the patella.
Biomechanics
Normal patellofemoral movement is enabled by the harmony between the related bones and soft tissues. In the resting position, the patella is positioned slightly laterally. Between 0° and 30° of flexion,resistance to lateral patellofemoral translation is mainly provided by the MPFL[7-10]. At the beginning of the flexion, due to the harmony of the TG and patella, a slight shift of the patella to the medial side is observed. Stabilization increases with the placement of the patella in the trochlea at 20°-30° of flexion.When the flexion increases toward 60°, the proximal part of the patella also begins to associate with the trochlea[11].
When flexion exceeds 90°, there is some decrease in the joint reactive force as a result of the contact of the quadriceps tendon with the trochlea[12,13]. Between 90° and 135°, the patella rotates and the median ridge approaches the femoral condyle[14].
Radiological evaluation of the patellofemoral joint
In the evaluation of patellofemoral articulation, the patellar position, which is measured by the lateral patellofemoral angle (LPFA), patellar tilt, and patellar lateralization, is checked. TT-TG distance measurement is used for patellar translation[15]. Along with these, it must be determined whether there is TD, which is one of the main morphological disorders in patients with PI. Sulcus depth, sulcus angle,and lateral trochlear inclination (LTI) are the measurements used in the evaluation of TD[15]. The TTTG distance, patellar height, and patellar tilt measurements are defined as principal factors in patients with PI and require surgical correction[16].
Imaging algorithm of PI
Fithianet al[16] summarized the evaluation algorithm of patients presenting with PI, referring to Dejouret al[19]. According to this account, the examination starts with true lateral radiography and evaluation of anatomical factors. If they are found normal, axial patellofemoral views at 30° of knee flexion are taken. Here, other causes, such as anterior cruciate ligament (ACL) disorders that may cause complaints,are investigated. If no morphological correction is considered, CT is not required, and a nonoperative treatment method is chosen. Knowing the true lateral radiography is essential in the evaluation of patients presenting with PI. Anteriorly, parallel dense lines belonging to both condyles and the linear density of the base of the trochlear sulcus are posteriorly observed. These lines do not intersect with each other (Figure 1). This normal appearance is disturbed by the intersection of the dense lines of the condyles anteriorly or anterosuperiorly (crossing sign). These may be accompanied by a bump or prominence in the form of overflow in the anterosuperior contour. These findings vary depending on the severity of the dysplasia. On the lateral graph, the depth and continuity of the TG and the patellar height are evaluated. After that, the path to be followed can be determined according to the data collected.
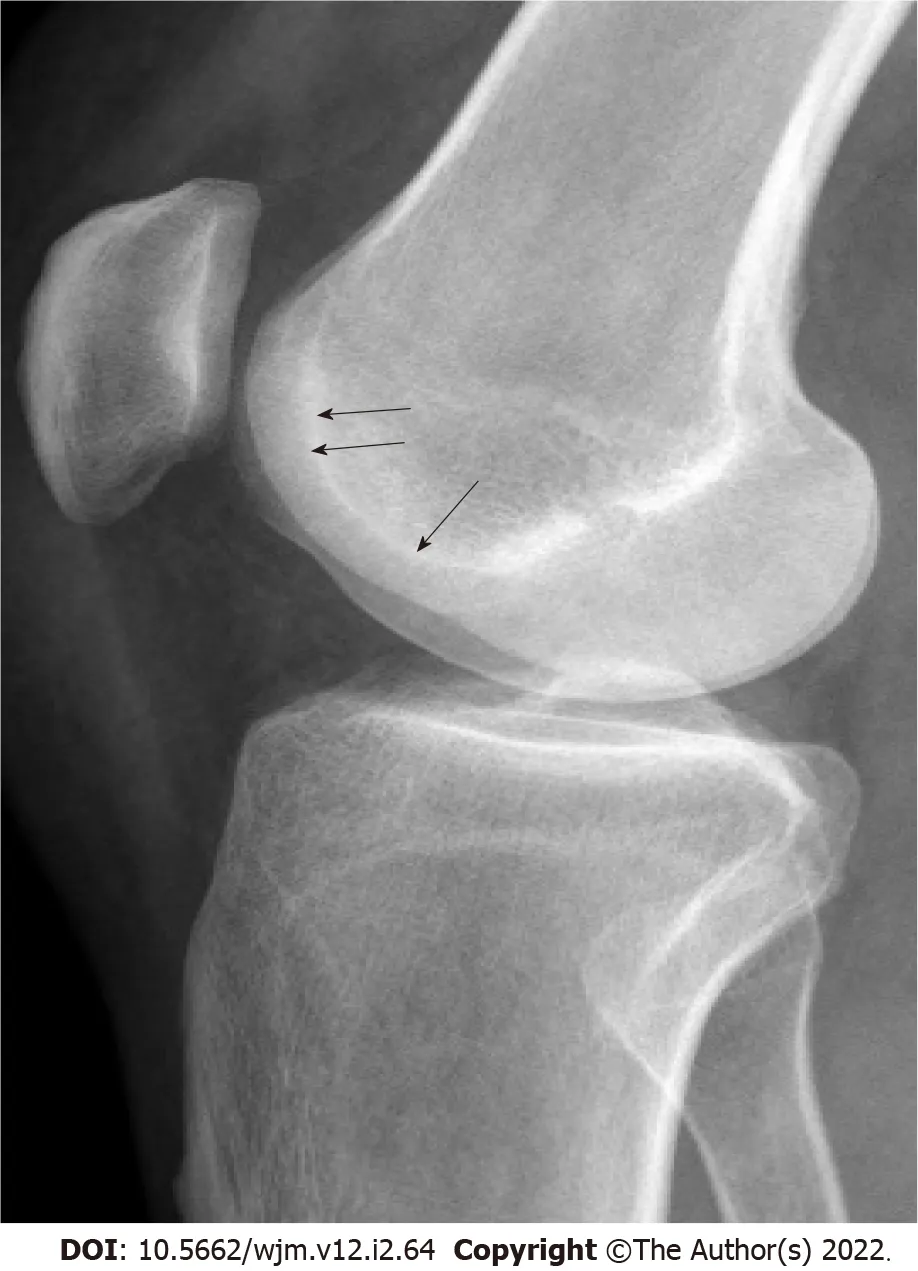
Figure 1 Lines and contours seen in normal people on true lateral radiography. Anteriorly, parallel dense lines belonging to both condyles and linear density of the base of trochlear sulcus (arrows) just posteriorly are observed. These lines do not intersect with each other. There is no bump or prominence on the anterior aspect.
High congruence angles are seen in the dysplastic trochlea on axial radiographs. Dysplasia can be identified visually even if the angle cannot be measured. However, the point to be considered here is that if the knee flexion angle is more than 45°, it may cause interpretation errors, since the relatively normal lower parts of the trochlea are displayed. Laurinet al[17] recommend taking axial radiographs at 20° (at this angle, the patella fits in the center of the trochlea) and evaluating the patellar tilt with the LPFA.
After Dejouret al[19] defined a significant statistical relationship between dysplasia and instability,CT entered routine use in patients with PI. If there is evidence of dysplasia on lateral radiography,anatomical correction may be required, and CT becomes necessary. In CT, along with other findings,TT-TG distance is checked, and patellar height is measured. The TT-TG measurement is the distance between the deepest points of the TG and the most prominent part of the TT in the horizontal plane.MRI has become one of the methods that can be used for diagnosis in the evaluation of patients with PI,as it can recognize potential flake fractures and measure TT-TG[18]. In addition to these, MRI can be used to evaluate the ligaments and muscle structures related to PI as well as the patellar and trochlear cartilage due to increased soft tissue resolution.
In this study, we mainly examine the four major instability factors (trochlear dysplasia, patella alta,TT-TG, and patellar tilt) identified by Dejouret al[19] for the classification of patellofemoral diseases and potential errors that can be made when evaluating them.
ASSESSMENTS AND MEASUREMENTS
Patellar height evaluation
For patellar stability, when the knee is flexed, the patella should fit quickly and fully into the TG.Patellar height is one of the main factors affecting this relationship. The patellar height ratio is important not only in the assessment of PI, but also in patella infera syndrome and after total knee replacement[20].
In common usage, the lower patella is called patella baja, and the higher one is called patella alta.When the quadriceps muscle contracts, the patella rises proximally over the trochlea; at this level, the support it receives from the groove decreases. In the presence of patella alta, even in advanced stages of knee flexion, the patella cannot fully settle into the groove. This increases the risk of lateral dislocation[21,22]. Another effect of patella alta is that it causes an increase in intra-articular pressure, which is more pronounced in the advanced stages of flexion[23]. There is an increased tendency to chondromalacia and dislocation due to this defect in the patella-trochlear location[5,24]. However, in patella baja, joint reactive forces increase on the patella, which causes limitation of movement and an increase in the risk of patellofemoral arthritis[25].
Various indexes have been defined for measuring patellar height (Table 1). These indexes refer to the tibia [e.g.,Insall-Salvati (IS), Caton-Deschamps (CD), and Blackburne-Peel (BP)] or the femur (e.g.,Blumensaat)[20]. Chareancholvanichet al[26] have defined the criteria that should be included in an optimal patellar height measurement index. According to this definition, a good index should have a femoral reference point that can accurately reflect the patellofemoral joint, should not be affected by the flexion angles of the knee, should be easy to measure, should have good intra- and interobserver variation, should be easily applied in lateral radio-graphy, and should be compatible with clinical data.
At the IS ratio[27], the patellar tendon (PT) length from the distal pole of the patella to the tuberositas tibia is measured (a in Figure 2A) and divided by the greatest diagonal length of the patella (b in Figure 2A). This ratio is 1 in normal knees[27]. It is important to make measurements on a true lateral radiograph. The length of the PT is measured from the posterior aspect of the tendon facing Hoffa’s fat pad. This may be particularly important in cases where the PT is attached across a wide area to theinferior pole of the patella. The measurement is independent of knee flexion and is one of the most commonly used ratios. If the tendon cannot be seen sufficiently for any reason, the tibial tubercule can be taken as a reference point, but attention should be paid to bone problems that may occur at this level.In addition, this ratio is defined in direct radiography. While taking measurements in MRI and CT,evaluation should be made from the sagittal plane sections showing the tendon completely, and the longest diagonal measurement of the PT and patella should be taken. In order to obtain maximum patella and PT size, it is important to measure at the midtrochlear level[28]. Tibial tuberosity can be difficult to assess if it is not obvious (e.g.,in Osgood–Schlatter disease[22]) and after distalization procedures[29]. Measurement errors may be secondary to patella deformities (patella with nonarticular long distal parts or Cyrano type patella[12], Larsen–Johansson disease[22], or osteoarthritis). IS ratio measurement changes with TT osteotomy. Therefore, it can be used to adjust patellar height after surgery.
Grelsamer and Meadows[30] defined a modified IS ratio to address the problems caused by patellar deformities. This index is obtained by measuring the distance between the lower end of the articular face of the patella and TT (a in Figure 2B) and dividing this distance by the length of the articular face of the patella (b in Figure 2B). However, this method also has some disadvantages, as can be seen in IS measurement[20].
The BP ratio[22] has been reported to be independent of the tibial insertion of the PT and the patella shape. In this index, the ratio of the length of the articular surface of the patella (b in Figure 2C) to the distance between the tibial plateau line and the lower pole of the patella joint surface (a in Figure 2C) is measured. However, in this method, it may be difficult to detect the route through which the tibial plateau line passes[29,31].
The CD ratio[32] identifies the distance between the inferior point of the patellar articular face and the anterior superior border of the tibia (a in Figure 2D). This distance is then divided by the length of the articular surface of the patella (b in Figure 2D). With this measurement, it may be difficult to assess the end point of the distal patellar joint surface and the anterior superior tibial corner as well[29]. This difficulty becomes more pronounced in patients with osteoarthritis due to hyper-trophic changes[31].The CD ratio is widely used and is not affected by knee flexion.

Figure 2 Radiography. A: Insall-Salvati (IS) ratio (a: Patellar tendon length; b: Length of the patella); B: Modified IS ratio (a: The distance between the lower end of the articular face of the patella and TT; b: Length of the articular face of the patella); C: Blackburne-Peel ratio (a: The distance between the tibial plateau line and the lower pole of the patella joint surface; b: Length of the articular surface of the patella); D: Caton-Deschamps ratio (a: The distance between the inferior point of the patellar articular face and the anterior superior border of the tibia; b: Length of the articular surface of the patella); E: Magnetic resonance imaging, Patellotrochlear index (a: Length of the trochlear cartilage; b: Length of the patellar cartilage). These images are showing different measurement methods for evaluating the patellar height.
The Labelle-Laurin method[33] was described in reference to a lateral radiograph taken with the knee flexed at 90°. If the proximal end of the patella is above the line drawn tangent to the anterior cortical line of the femur, it is defined as patella alta. Although it is easy to evaluate, it has many disadvantages.Radiography is difficult to obtain without fluoroscopy. Due to femoral bending, drawing the tangential line to the femoral diaphysis is not easy[20]. In addition, only the patella alta can be evaluated with this method. However, there are publications suggesting that it can be used in the evaluation of patellar height[34].
All these indexes are generally related to bone structure. However, the bone structure and the cartilage covering it may not always be compatible[35,36]. Therefore, it may be more logical to refer to cartilage, which is the main element directly exposed to stress forces in the joint.
Biedert and Albrecht[37] defined a new method that can be used in MRI for measuring patellar height. This is the patellotrochlear index (PTI), in which the distance that the patellar (b in Figure 2E)and trochlear cartilage (a in Figure 2E) overlap in parallel is measured in the sagittal plane. This method is said to be a reliable and reproducible method to show the patellofemoral relationship[37]. In this measurement, the patellotrochlear articular congruence seems to be evaluated without being affected by differences in the shape and length of the trochlea, variations in bone structure, diseases, or operations.However, Ahmadet al[38] showed that PTI increases with the flexion angle of the knee and proposed a correction formula to solve this problem.
It is not easy to clearly say which measurement method should be used in patellar height assessment.The factors determining the patellofemoral joint relationship are the height of the patella and the length and depth of the TG groove. Therefore, when considered roughly, it may be more accurate to evaluate the articular surface of the patella according to the trochlea and tibiofemoral joint lines. The BP and CD ratios can fulfill this requirement. However, indexes referring to the femur (e.g.,Blumensaat and Bernageau) depend on the knee flexion angle and are poor in terms of measurement reliability[16].
The patellar shape or the position of the TT can affect the ratio of IS and minimally invasive surgery(MIS). IS and MIS may also be affected due to Osgood-Schlatter’s disease, bone-PT-bone grafts used in ACL replacement, and transfer of the TT.
Another possible misconception when evaluating patellar height is that interobserver variability is often due to evaluation errors in the bone structure reference points used. In addition, misinterpretation may be caused by factors related to the deficiency of exposure technique factors affecting the quality of the radiography or failures of either the positioning or the system (film, cassette, and bath factors in conventional systems that are mainly due to the detector system features in digital systems).
The same index may give different results with different modalities. For example, the radiographically measured patellar length may be different in MRI. This difference may be due to the patella not being in the same slice with its entire size due to its shape and position in the knee, which may result in a decrease in reliability. It is recommended to use midsagittal sections to solve this problem[39,40].Shabshinet al[41] proposed a method for measuring the patellar and PT length. They looked at the number of sections where the patella entered the image and then made the measurement from the middle slice.
However, this is a major problem in practice, especially in patients with PI, due to the lateralization of the patella. The patella, trochlea, tibia, and associated tendons cannot be shown in a single slice.Another problem may be experienced when measuring PT length. There may be osteophytes in the superior pole and enthesophytes in the inferior pole of the patella; these should not be taken into account during the measurement[42]. Measurements should be made at the posterior aspect of the PT[42]. X-ray measures the distance between the patella and TT, whereas MRI measures the tendon itself.
In their study on MRI, Milleret al[42] found that, although it was said to be unaffected by flexion, the upper limit for the SI index was 1.1 when the knee was flexed, whereas the upper limit was 1.3 when the knee was in extension.
These indexes were defined for radiography, and whether the normal limits used for them will also apply accurately to CT and MRI is another question. It can be seen that these indexes are studied in limited numbers for different modalities[39-43]. The IS, BP, CD and MIS indexes defined for radiography can also be applied to CT and MRI, but normal ranges may change in this case. In one study, patellar height indexes (IS, MIS, CD and BP) were found to be 0.1 factor higher in MRI than in radiography in patients with primary patellar instability[44]. However, another study suggests that for PT length measurement, it does not make any difference whether MRI or radio-graphy is used[45].
Although CT and MRI contribute significantly to the evaluation of patients with PI, they still recommend that radiographic evaluation should not be ignored[46].
In the Lyon school, patellar height is evaluated with the CD method through true lateral radiography[16]. But generally speaking, IS is the most commonly used index, as others are clinically inaccurate or time consuming[41].
Evaluation of trochlear dysplasia
The relationship between PI and TD has been known for a long time. When evaluating TD, some morphological features, such as trochlear depth, sulcus depth, sulcus angle, LTI, medial trochlea inclination, and trochlear angle can also be examined[15,47] (Table 1).
Dejouret al[19] defined specific radiographic features frequently seen in patients with PI. While the lateral trochlear ridge and the base of the groove did not coincide in normal individuals on lateral radiography, it was observed that these lines cross (at the crossing sign) in 95% of patients with PI[48].The crossing point indicates the point where the lateral femoral condyle overlaps the trochlear floor; at this level, the trochlea is flattened (Figure 3). In fact, what is looked at in a lateral radiograph is the level of this flattening held by the groove and whether symmetry or asymmetry in the femoral condyles accompanies it. This shows the severity of dysplasia (Figure 3). In the examination of TD starting with lateral radiography, the crossing sign is evaluated as visually, the trochlear bump, and the trochlear depth are also evaluated as quantitative[19]. After the visual evaluation, the first quantitative evaluation is of the cortical beak (bump/prominence) measurement in the anterior (threshold value: 3 mm)(Figure 3). This is an important indicator of TD, and it increases as the degree of dysplasia increases[19].

Figure 3 Illustration showing the Dejour classification used in trochlear dysplasia in true lateral radiography and axial slice images.
Another quantitative criterion for TD in lateral radiography is the trochlear depth measurement. In the study of Dejouret al[19], a significant difference was found between the group consisting of PI and normal persons when measuring trochlear depth. In fact, with this, the more distal section of the groove is evaluated according to the level indicated by the crossing sign. For the trochlear depth measurement,a line perpendicular to the line taken tangentially to the posterior femoral cortex is drawn on the true lateral radiograph taken at 30° of flexion. A second line that makes an angle of 15° with this line is then drawn. Where this second line intersects the cortex anteriorly, the groove depth is measured. In this radiographic examination, the trochlear depth was found to be approximately 2.3 ± 1.8 mm in patients with PI[19]. For trochlear depth, values of ≤ 4 mm are considered pathological[19]. These anatomical defects prevent the patella from staying in the groove while the knee is flexed.
In order to evaluate the “crossing sign” in lateral radiography, the radiograph should be taken fully laterally, while the condyles should overlap each other in the posterior and look like a single condyle.Obtaining the radiograph even in a 5° rotation may affect the accuracy of the lateral radiography[49].The difference between the lines formed by both condyles is < 2 mm, which indicates that the radiography is sufficient[50]. However, this is often not possible, and the radiography may need to be performed under fluoroscopy. This means extra time and additional radiation risk.
Knee axial radiographs have limitations, such as inadequate reproducibility, image distortion, and problems caused by low flexion angles[51]. Groove anatomy may not be shown correctly in axial X-ray images taken with the knee flexed at 30°[48]. Many researchers have worked on different angle values to provide better reproducibility[17,52].
In some cases, there may be mild dysplasia, and this may only affect the trochlea entrance. Thus, it may not be possible to evaluate these cases with radiography[53]. Proximal anomalies may also not be seen on lateral radiography due to superposition[54]. Achieving an optimal position on lateral radiography can be difficult. However, on CT imaging, it is easier to evaluate both the angle given to the knee and to establish a reference by aligning the posterior of the condyles. For this reason, the use of cross-sectional imaging methods has come to the fore (Figure 4). In addition, lateral radiography may not show the severity of TD as accurately as axial MRI[55,56].

Figure 4 Sample cases with trochlear dysplasia according to Dejour classification. A: Type A; B: Type B; C: Type C; D: Type D.
The classification commonly used in the evaluation of TD is based on data obtained from lateral radiography and CT images[57]. According to D. Dejour’s criteria for axial CT/MRI scans, TD is classified into types A (shallow trochlear sulcus), B (flat or convex trochlea), C (asymmetry of trochlear facets with hypoplastic medial condyle), and D (asymmetry of trochlear facets with cliff pattern)[58](Figure 3). Dejour classification is qualitative evaluation, and its interobserver–intraobserver reliability is less than ideal[55,59-61]. There are different opinions in the studies conducted to increase this reliability. Lippacheret al[55] confirm that the four-grade TD classification defined by Dejour has low interobserver and intraobserver agreement, and they say that the results are better if the classification is applied as two-grade (low/high-grade dysplasia). Some studies have classified Dejour’s Type A as low grade and Dejour’s Types B-D as high-grade dysplasia[55,62].
Although the Dejour classification is widely known in the diagnosis of TD, the search for more reliable and reproducible methods continues. For this purpose, many measurement methods, such as the LTI, the trochlear depth index (TDI), the lateral condyle index, and PTI have been defined as having high sensitivity and specificity to be used in the evaluation of PI[50,54,63].
The measurements of LTI, trochlear facet asymmetry, and depth of TG are said to show good sensitivity and specificity[62]. Biedert and Bachmann[64] state that hypoplasia of the medial femoral condyle is a hallmark of TD.
For the evaluation of trochlear dysplasia, femoral width as described by Biedert and Bachmann[64],LTI as described by Carrillonet al[54], TDI as described by Pfirrmannet al[50], the medial condyle trochlear offset as described by Stepanovichet al[65], and the TT-TG distance as described by Schoettleet al[66] can be measured. Measuring can be difficult in severe dysplasia, but Schoettleet al[66] offer clues for how to do this.
As the degree of dysplasia increases, the clues and landmark points used in measurement may become faint, and therefore, some cases may be difficult to measure. Using the quantitative radiographic measurements and the Dejour classification system described above together provides convenience in diagnosis[56].
Evaluation of TT-TG distance
By superposing sections passing through the hip, knee, upper tibia, and ankle with CT, the alignment and rotational parameters of the lower limbs and components of the knee extensor mechanism can be evaluated. Dejouret al[19] evaluated patellar dislocation with lateral radiography and CT. However,examining the patellofemoral joint in CT while the knee is in extension is superior to radiography[67].
Today, instead of measuring the Q angle, the superimposed images of the TG and the TT are used in the axial images on CT, and the lateral offset of TT is evaluated (TT-TG measurement) (Figure 5)according to these. This measurement is more reliable than the Q angle and is frequently used in patients with patellar instability[19]. Bradyet al[59] found a significant and positive relationship between TT-TG measurement and the degree of TD in the Dejour classification. However, TT-TG measurement is affected by many variables, such as torsion. For this reason, it should not be consi-dered as a definitive value, but as a part of a whole.

Figure 5 Tibial tuberosity-trochlear groove distance measurement. Superimposed image of the trochlear groove and tibial tuberosity used in the axial images on computed tomography, and here the lateral offset of tibial tuberosity is evaluated.
TT-TG measurement is widely used when making surgical decisions and determining the best procedure for patients with PI[60,66]. When measuring TT-TG distance, the deepest points of the TG and most prominent part of the TT are taken as bases. Different measurement methods have been described for the measurement of TT-TG distance[66,68]. There is uncertainty in defining the reference points to be used in measurement. To determine the level of TG measurement, in the axial images, the first image in which the notch is seen as a Roman arch should be selected[69], and the level should be confirmed by sagittal images if necessary.
The deepest point of the groove is taken as the reference point for TG in the horizontal plane. In severe TD, it can be difficult to detect the deepest point of TG. For these cases, Julliard and Ligeon[70]have defined the bidimensional reconstruction procedure. Bradyet al[59] measured the TG at two levels on MRI. They measured the most proximal section (proximal TT-TG) where the trochlear cartilage was seen on axial views and the most distal section of the femur before the Roman arch was disrupted (distal TT-TG). No significant difference was found between the two measurements, and it was observed that both had high inter-rater reliability[59].
The selection of different reference points is mostly seen on the tibial side. There are discussions about the most prominent point of TT in studies[66,71]. Goutallieet al[68] identified the reference point for TT as the most anterior point of the tibial tuberosity. However, it is debatable where the reference point should be placed when the TT surface is wide rather than sharp. Deveciet al[72] took the midpoint of the dome of the TT as a reference when measuring TT rather than the most anterior part of the bone structure. Another controversy is whether the bone structure (TT) or the PT should be taken as the tibial reference. Schoettleet al[66] took the center of the PT as the reference point on the tibial side. Here, it can be discussed whether the front or center of the tendon should be evaluated as a reference point.Especially in cases where TT is lateralized and the tendon is more globularly adhered, it may be more appropriate to refer to the center of the tendon, as it is more suitable for the force vector.
Whichever is used as a tibial reference point (TT or PT), it is also important to determine which level should be used to take in the craniocaudal axis. For the PT-TG measurement, there are those who refer to the most proximal point as the place where the tendon inserts in TT[72]. The same level is accepted for TT-TG measurement[73]. The TT-TG value was defined as 13 mm in the normal population[74].However, there are also publications that accept values of ≤ 10 mm as normal[75]. Parket al[76] reported the TT-TG distance as 13 mm for MRI in patients with PI. Values > 20 mm are considered determinants for the diagnosis of PI and the decision of surgery[19]. The PT-TG distance has been measured at a few millimeters larger than the TT-TG distance[72,77]. As can be seen, there are no definite limits for normal values, and there are differences according to modalities. Additionally, age and height also affect TT-TG distance[74]. Finally, in a study, TT-TG measurement was thought to be affected by knee flexion and rotation; as an alternative, TT-posterior cruciate ligament (PCL) measurement was made, but TT-TG measurement was found to be more reliable than TT-PCL measurement[59].
Evaluation of patellar tilt
The relationship between patellar tilt and TD is understood[78]: In PI evaluation, patella height and patellar tilt are examined in relation to the position of the patella[79-83]. Evaluations regarding patellar height were made above. In addition to this effect of the anatomical structure, patellar hypermobility may also occur due to problems in passive (ligamentous) and dynamic (musculous) soft tissue elements.
One of the hypotheses considered to explain patellar tilt refers to VMO dysplasia[19]. Laurinet al[17]also described in their study that a loss of cartilage in the lateral compartment of the patellofemoral joint causes lateral patellar tilt. Some authors associate the tight lateral structure with patellar tilt[19,78].Generally, patellar tilt may be an indicator of tightness in lateral support structures, but it generally appears as weakness in medial soft tissue support structures[51]. Among all the causes of PI, patellar tilt is the most difficult to correct. This is perhaps because it is associated with many factors affecting biomechanics[84]. Although patellar tilt (≥ 20) and patella alta (index: ≥ 1.2) detected in extension generally have values indicating quadriceps dysplasia[19], it is difficult to actually measure quadriceps dysplasia. A rough idea can be obtained by measuring the patellar tilt with CT and clinical evaluation[19].
Patellar tilt is the angle between the line joining the posterior femoral condyles (a in Figure 6A) and the transverse patellar axis (b in Figure 6A) in axial images[85]. This angle increases with quadriceps contraction. In one study, the sections passing through the mid-patella were taken when the knee was flexed at 15° in the relaxed state; when the quadriceps contracted, it was found that the patellar tilt increased by an average of 10° in the PI group[81]. Dejouret al[19] took 20 as an average value (mean patellar tilt), since it is not fully known whether the muscle is contracted when measuring in a patient with PI. However, minor forms of quadriceps dysplasia can be diagnosed by measuring the mean patellar tilt[81]. CT taken in extension shows the patellar dynamics in the first few degrees of knee flexion, where dislocation occurs.
Other parameters that can be used in the evaluation of PI patients
Evaluation of LTI, trochlear angle, and sulcus angle: The LTI angle is the angle between the line drawn tangent to the lateral facet and the line tangent to the posterior edge of the femoral condyles[86](Figure 6B). Carrillonet al[54] set the threshold value for LTI as 11°. LTI measurement for TD allows both qualifying and quantifying assessments[54]. The LTI angle is important among trochlear morphology measure-ments. A decrease in this angle means flattening of the trochlea, that is, dysplasia.
While some publications refer to subchondral bone at the trochlear facet for LTI measurement[87],other publications refer to the slice where the cartilage was seen first and completely[88]. In the classical measurement method, the angle is calculated over the same section, while in some subsequent publications, it is recommended to be calculated by measuring at proximal and distal levels[88]. Proton density fat saturation or fat saturation T2 A sequences can be used for measurement.
The trochlear angle is the angle between the line passing posteriorly to both femoral condyles and the line joining the foremost parts of the medial and lateral facets (Figure 6C). The trochlear depth is found by measuring the maximal anterior–posterior diameter of the medial femoral condyle, the maximal anterior–posterior diameter of the lateral condyle, and the minimum distance of the deepest point of the trochlea with respect to the tangent line passing through the posterior of the condyles. It can be calculated according to the formula [(a + b)/2] - c[50] (Figure 6D). Reference points used in trochlear depth measurement differ in publications. Osseous surfaces were used as a reference in two studies[28,89]. However, it seems more appropriate to use the cartilage directly as a reference point because of possible cartilage–bone incompatibility[36,66].
Although it is not included in the Dejour classification, some authors also consider sulcus angle (SA)measurement as a characteristic part of the evaluation of TD[19,52]. However, although there is a strong relationship between the LTI and the trochlear angle with structural damage in the patellofemoral joint,a lesser relationship was found for the SA[47].
Axial knee radiographs can be used to evaluate the SA and patella position. The SA is defined as the angle between the lateral and medial facets of the joint[47,86,90,91] (Figure 7). An SA > 145°-150° is significant for TD[2,92,93]. The SA is measured from the first axial MRI section, where the medial and lateral trochlear facets can be fully observed[94]. These sections naturally show the more distal levels of the trochlea. However, dysplasia is most prominently seen at the trochlea entrance, that is, at the more proximal level. In the study by Dejouret al[19], 35% of the patients with PI had TD, although the trochlear angle was within normal limits. For this reason, it is useful to specifically control the proximal trochlear morphology, especially in cases where the SA is close to the normal ranges. Measurement of the SA may not be reproducible[95,96]. SA measurement can be used to evaluate an individual’s risk status for PI in the future[97], but TD does not actually seem very reliable for assessing morphology.

Figure 7 Measurement of sulcus angle.
There is also a relationship between the parameters described above. Smaller LTI values were found to be associated with larger TT-TG and SA values[46]. There is a positive relationship between patellar tilt and TD, and a negative relationship between patellar tilt and LTI. As LTI decreases, that is, as the lateral facet is tilted, especially when the knee is in extension, the patellar tilt should increase in order for the patellar lateral facet to adapt to it[46].
In the thesis of Levigne referenced by Fithianet al[16], it is stated that the most common cause of patients who underwent revision surgery due to PI was persistent patellar tilt, suggesting VMO dysplasia, and secondly, patella alta. However, as it was not within the scope of this study, a detailed analysis was not conducted on treatment and outcomes of PI.
Evaluation of patellar size and shape:It has long been debated whether there is a relationship between patellar size and shape and PI. Wibeeg[6] studied the effects of patellar shape in patients with PI and defined a grading system. However, Servienet al[98] found that there was no correlation between patellar shape and size and TD in their study comparing patients who were operated upon for PI with a control group. While the shape of the patella is examined during the evaluation of patients with PI, no significant difference has been defined that can be used to direct treatment. This is also the case for other secondary features associated with PI[16].
In addition to all these factors described above, although it is thought to be associated with recurrent patellar instability, there are other factors that are used in the treatment decision that cannot be directly treated and whose exact values are not defined. Genu recurvatum and ligament laxity, genu valgum,and femoral anteversion measurements are thus defined as secondary features[16].
Evaluation of coronal alignment, femoral anteversion, and tibial torsion:In this study, we examine in detail the four main factors of PI identified by Dejouret al[19] (trochlear dysplasia, patella alta, TT-TG,and patellar tilt). However, apart from the anatomical reasons described above for PI, deterioration of the coronal alignment of the lower extremity and torsional malalignment are also important causes.
Some reports in the literature state that there is a positive correlation between higher femoral antetorsion, TT-TG distance, and the degree of trochlear dysplasia in patients with recurrent PI[99,100].It may be difficult to clinically detect torsion deformities and bone alignment disorders in patients with PI. Preoperative clinical and radiological evaluation of these factors is beneficial, as they may affect the outcome[101]. Francioziet al[102] provide evidence that increased femoral antetorsion and valgus alignment increase lateral patellar instability.
The frontal mechanical axis can be evaluated using standardized weight-bearing full-leg radiographs.It is measured as the angle between the mechanical femoral and mechanical tibial axis as defined by Streckeret al[103]. Positive values indicate varus alignment, and negative values indicate valgus alignment. The quadriceps angle (Q angle), which is related to the alignment of the structures that make up the extensor mechanism (the quadriceps, patella, and tibial tubercle). The quadriceps or Q angle can be used to evaluate the forces involved in patellofemoral tracking. The Q angle is a valgus angulation,which is the angle between the lines drawn from the anterior superior iliac spine to the middle of the patella and from there to the tibial tubercle (Figure 8). This angle is measured slightly lower than standing radiographs when evaluated on radiographs taken in the supine position[104].

Figure 8 Q angle measurement.
Although the exact value of the Q angle cannot be given in the literature, it is stated that a wide Q angle (≥ 15°-20°) predisposes patients to increased lateral patellar position[105,106]. The Q angle varies by gender[5]. On average, it measures 14° in men and 17° in women. This difference is due to the larger pelvis width of women, which causes an increase in the valgus angle in the knee[107]. Internal rotation and pronation also increase this angle[108]. There are some publications in the literature questioning the reliability of Q angle measurements[5,109]. For example, knee flexion angle can affect Q angle measurements. When comparing Q angles measured at 0° and 30° when the knee was flexed, it was found that the Q angle measured as little as 6° in flexion[110]. Although Hiemstraet al[111] defined the measurement method in axial views at 30° flexion, CT is currently used for Q angle measurement.
Torsional disorders, such as excessive internal femoral or external tibial torsion, exert force in the direction of lateralizing the patella, and these may show increased lateral patellar tilt and translation[112-114]. One study stated that increased femoral torsion is correlated with a dynamic Q-angle gait pattern, and this is seen more frequently in PI cases[99]. Femoral antetorsion and mechanical valgus axis showed a positive correlation[99].
Femoral torsion is a twist of the proximal femur relative to the distal femur and is performed using standardized axial slices through the hip, knee, and ankle. Femoral torsion was defined by Schneideret al[115], and it is the angle between the line connecting the femoral neck and femoral head center(femoral neck axis) and the line drawn parallel to it on the distal femur (tangential axis at the medial and lateral femoral condyles). Positive values indicated femoral antetorsion, whereas negative values indicated femoral retrotorsion. Kingsley and Olmsted[116] report the mean femoral anteversion angle as 8.0° (range, -20° to 38°). Several measurement methods have been defined depending on the different anatomical landmarks used while measuring femoral anteversion[117,118]. CT (a 3D reconstruction technique)[119,120] or MRI was used for the measurement of femoral anteversion[121,122]. Guentheret al[123], while measuring the femoral anteversion angle in MRI, used the advantage of MRI in planning by taking the line of the femoral neck axis parallel to the femoral neck. Studies have found different results in terms of the relationship between PI and femoral torsion. Imhoffet al[99] stated that there is an increased femoral torsion in high-grade TD. However, there are reports that neither femoral and tibial nor knee torsion are associated with trochlear dysplasia[124,125].
Likewise, there are different opinions about the relationship between PI and femoral rotation. While there are publications stating that there is an increased femoral antertorsion in patients with PI[112,126], some articles report that there is no correlation between lateral patellar translation and femoral or tibial torsion[126,127].
Another rotational anomaly of the lower extremity is tibial torsion. This is the torsional angle between the proximal tibia and the distal tibia defined by Diederichset al[126]. Pathology is mainly due to rotation in the proximal one quarter of the tibia[128]. Proximally, just before the head of the fibula, a line drawn parallel to the posterior tibial cortex is taken. Distally, the line connecting the middle of the medial and lateral malleolus is taken at the first slice passing through the talar dome[126]. Positive values indicate external tibial torsion, and negative values indicate internal tibial torsion. Methods using different landmarks have been described for the measurement of tibial torsion[129-131]. The normal values of external tibial torsion for individuals of European origin were found to be 24° to 30°[132].
Limb rotational deformities may be suspected on an anteroposterior X-ray, but measurements cannot be taken in this plane. In CT and MRI, rotational evaluations can be made using the hip, knee and ankle.Different measurement methods that can be used for tibial rotation measurement in cases with PI have been described in the literature[133-136]. Proximally, the posterior axis of the tibia or the transcondylar axis can be used[137]. Distally, the transtibial[137] or bimalleolar axis can be used[138]. The difference in interobserver and intraobserver reliability mainly depends on the landmarks used in the distal measurement[139]. CT is generally accepted as the gold standard for lower extremity rotational deformities[117,140].
In conclusion, in the evaluation of PI, it will be beneficial to pay particular attention to TD, patella alta, and increases in both the TT-TG and lateral patellar tilt, although other factors are also considered.The effects of these factors can vary, so treatment may differ from person to person. Studies on various measurement methods and indices to be used in the evaluating both diagnosis and degree of TD are ongoing.
CONCLUSION
PI is a multifactorial problem. Many problems affecting the bone structure and muscles morphologically and functionally can cause it. It is necessary to understand normal anatomy and biomechanics to make more accurate radiological measurements and to identify causes. Knowing the possible causes of measurement errors that may occur during radiological measurements and avoiding these pitfalls can provide a more reliable road map for treatment. This determines whether the disease will be treated medically and with rehabilitation or surgery without causing further complications.
FOOTNOTES
Author contributions:Ormeci T contributed to the study concepts and design, manuscript preparation and writing;Turkten I contributed to the literature research and manuscript preparation; Sakul BU contributed to the manuscript editing and supervised the paper; and all authors read and approved the final manuscript.
Conflict-of-interest statement:Authors declare no conflict of interest for this article.
Open-Access:This article is an open-access article that was selected by an in-house editor and fully peer-reviewed by external reviewers. It is distributed in accordance with the Creative Commons Attribution NonCommercial (CC BYNC 4.0) license, which permits others to distribute, remix, adapt, build upon this work non-commercially, and license their derivative works on different terms, provided the original work is properly cited and the use is noncommercial. See: https://creativecommons.org/Licenses/by-nc/4.0/
Country/Territory of origin:Turkey
ORCID number:Tugrul Ormeci 0000-0001-8532-4917; Ismail Turkten 0000-0003-0787-7000; Bayram Ufuk Sakul 0000-0002-5539-2342.
S-Editor:Wang JJ
L-Editor:Kerr C
P-Editor:Wang JJ