Numerical simulation of vibrational response characteristics of railway subgrades with insulation boards
2022-03-22ZiYuWangXianZhangLingYingYingZhaoFengZhangLiHuiTian
ZiYu Wang,XianZhang Ling,YingYing Zhao,Feng Zhang,LiHui Tian
1.School of Marine Science and Technology,Hainan Tropical Ocean University,Sanya,Hainan 572022,China
2.School of Civil Engineering,Harbin Institute of Technology,Harbin,Heilongjiang 150090,China
3.School of Civil Engineering,Southeast University,Nanjing,Jiangsu 211189,China
4.School of Mining Engineering,Heilongjiang University of Science and Technology,Harbin,Heilongjiang 150022,China
ABSTRACT This study presents a numerical method based on the surface temperature data and the ground temperature increase in Daqing for predicting temperature field distribution in the Binzhou Railway subgrade and analyzing the temporal and spatial distribution of freeze-thaw status of railway subgrade.The calibrated numerical method is applied to simulate the temperature field distribution and roadbed vibrational response of the railway subgrade with a thermal insulation layer at different seasons.The results show the following:(1)The thermal insulation layer can remarkably increase the soil temperature below it and maximum frost depth in the subgrade.(2) Thermal insulation can effectively reduce the subgrade vibration and protect it from frost damage.(3)Given that the strength requirements are met,the insulation layer should be buried as shallow as possible to effectively reduce the subgrade vibration response.The research findings provide theoretical support for the frost damage prevention of railway subgrades in seasonally frozen regions.
Keywords:seasonally frozen regions;railway subgrade;insulation layer;vibrational response;frost depth
1 Introduction
The operation of high-speed heavy-load trains is a new trend in the development of rail transit in China.Unfortunately, this development has also highlighted the problems of roadbed vibration, especially in railway roadbeds located in areas with seasonally frozen soil.Early numerical studies of temperature fields began with the finite difference scheme and methods considering nonlinear phase change proposed by Guoet al.(1981).The introduction of computer and numerical methods in the field of frozen soil has enabled the extensive study of frozen soil temperature fields under complex conditions(Laiet al.,2004;Sunet al.,2004; Geet al., 2008).Maoet al.(2011) analysed the hydrothermal coupling effect of subgrade temperature field.Wanget al.(2006) applied the finite element(FE) method to analyse the temperature field of frozen soil roadbeds considering various factors.Wanget al.(2006) and Liuet al.(2012) utilized thermal insulation to restrain subgrade frost heave in a seasonally frozen region and studied the effect of adding an anti-frost heave guard on thermal insulation.The results of the aforementioned studies showed that the thermal insulation method is effective in controlling frost heave effects on railway roadbeds in seasonally frozen regions, and installation of an anti-frost heave protective pavement mitigates the soil frost heave impact under a slope.Xuet al.(2010) and Niuet al.(2011) found that subgrade filling with anti-freezing layers has sound thermal insulation effects.Installing insulation materials in the middle of an embankment filling in permafrost regions is an important measure to increase the embankment's thermal resistance, but it also reduces the cooling capacity of the subgrade.
In this study,the temperature distribution of a railway roadbed during freezing and thawing is modeled using the surface temperature data and ground temperatures obtained in Daqing, Heilongjiang Province,China.Next,an insulation board is added to this model to evaluate its effects on the temperature field, frost penetration,and vibration due to heavy-train loads.
2 Mathematical model
The temperature field of a subgrade in frozen soil varies with seasons and is accompanied by phase transformation.The governing equation is able to describe unsteady temperature changes due to heat conduction, accounting phase changes (ice-water and water-vapor).Given the actual situation of the roadbed in the deeply frozen soil of Binzhou Railway, the following assumptions are made to formulate a temperature-field analysis model of the roadbed:
(1) The layered soils of the railway subgrade and foundation soil are isotropic.
(2) The water content of the stable section is low and constant, and no water recharge or drainage occurs at other boundaries.
(3)The heat conduction term in a freeze-thaw cycle is much larger than the heat convection term.Thus, convection, mass transfer and heat dissipation by water evaporation and other effects are neglected in the analyses.Considering only the heat conduction of soil skeleton and pore water and the ice-water phase transformation, the phase transformation of frozen soil is mainly concentrated in a certain temperature range.
(4) The subgrade is assumed to be surrounded by an insulating boundary, and no heat flow occurs around the soil boundaries.
The heat balance equation governing a transient temperature field can be expressed as follows:

whereρis the soil density,Tis the soil temperature,andCandλare the soil specific heat and thermal conductivity, respectively.Candλcan be expressed using Equations(2)and(3)according to varying freeze-thaw states.


In Equations(2)and(3), the volumetric heat capacity, thermal conductivity and volumetric ice content are functions of temperature, which are nonlinear processes.Because the position of the ice-water interface changes constantly, the energy conservation condition of the phase change interface is also nonlinear.Therefore, the equations reflect a strong nonlinear problem that cannot be solved analytically.Numerical methods are used to obtain appropriate solutions.The Galerkin method and FE formulation for this problem are as follows:
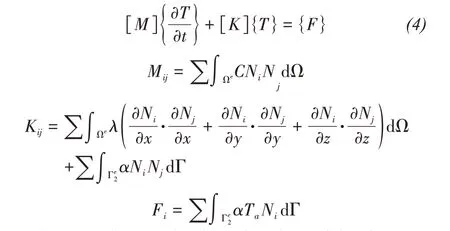
whereNiandNjare the shape functions of the element.
3 Numerical analysis model
3.1 Geometry and site survey
The study site, Daqing, is located in the northeastern region of China.Data from 16 national meteorological stations in Heilongjiang reveal that the annual average air temperature in this area from 1960 to 2000 is approximately 5.8 °C.In general, the average surface temperature shows an upward trend, with the increasing rate ranging between 0.006°C and 0.023°C per year.
Because the subgrade is assumed to be surrounded by an insulating boundary,i.e.,no heat flow at the soil boundaries, the three-dimensional temperature field analysis can be simplified as a two-dimensional problem.Because the subgrade model is symmetric,only half of the model was analyzed.A typical double-track subgrade section of the Binzhou Railway(K1229+135)was selected to establish a FE model,as shown in Figure 1.The site stratum was determined by in situ shear wave velocity tests.The roadbed has a height of 4.0 m, a width of 12.55 m on the top of the ballast bed.The FE model extends outwards from the roadbed by 30 m at the toe of each side slope and downward to a depth of 30 m below the natural ground surface.Based on the research results of Xuet al.(2010), the insulation board within the roadbed was set to 0.1 m thick with a burial depth varied at 0.4 m,0.6 m,and 0.8 m for comparison.

Figure 1 Sectional schematic of the subgrade of Binzhou Railway(unit:m)
3.2 Thermal boundary and initial conditions
(1) Initial conditions
The temperature field distribution of the railway subgrade was calculated by applying the annual average air temperature with an annual temperature variation evaluated by using Equation(5)at the air-subgrade boundary.According to the relevant literature, the temperature change in the foundation within a non-permafrost area is smaller than that of the environment.Wanget al.showed that the ground temperature at 10 m below the road surface is essentially steady at approximately 15 °C.Therefore, this study adopted a constant temperature boundary condition (i.e., 15 °C) at the bottom of the model, and the left and right sides of the subgrade were regarded as adiabatic boundaries.A calculation time of 50 years,i.e., from 1960 to 2010, was applied to ensure the relative stability of the initial temperature conditions.The initial temperature distribution of the site was obtained from the ground temperature measurement.

(2) Boundary conditions
According to the Daqing geothermal monitoring data and boundary layer principle,the upper boundary temperature conditions of the study site can be expressed in the form of a triangular function as follows:

wheretis time.The initial time corresponding tot= 0 can be changed by adjustingα0.Whenα0= 0,the initial time corresponding tot= 0 was July 15.Tsis the average annual ground temperature at the bottom of the lower boundary layer,Tais the average annual ground temperature (i.e., 5.8 °C), and △tis the increment of the boundary layer temperature(i.e., 0.5 °C on natural surfaces and 1.0 °C on the embankment slope and top).The annual average surface temperature increase rate caused by atmospheric warming over the last 50 years was 0.023 °C/a(Yuanet al., 2011).A is the physical amplitude of the upper boundary temperature and has a value of 22 °C for natural surfaces and 23 °C for embankment surfaces.Figure 2a depicts the measured surface temperature in Daqing.Generally, the ground temperature begins to rise in January,peaks for approximately one month in June, and then decreased and reaches a trough at the end of the year.Figure 2b illustrates the fitted values of the annual surface temperature.

Figure 2 Surface temperature variation within one year in Daqing
3.3 Mechanical and thermodynamic parameters of the material
In this paper, the equivalent linearization model(Zhanget al.,2012)was used to describe the dynamic properties of nonlinear soil viscoelasticity and investigate the vibration response characteristics of railway subgrade.The equivalent linearization model adopts the viscoelastic Kelvin model to reflect soil's hysteretic behavior under periodic loading, as described by Equations(8)-(9):

whereGdis the dynamic shear modulus,ηGis the shear viscosity coefficient,τis shear stress,γis shear strain,λis the damping ratio, andωis the circular frequency.
Considering the phase change of pore water in the roadbed in seasonally frozen regions, it is necessary to determine the thermodynamic properties, such as thermal conductivity and specific heat capacity of each soil layer within the roadbed for both frozen and unfrozen states.This study refers to the values listed in Chinese Frozen Soil(Zhouet al.,2000)and Frozen Soil Physics (Xuet al., 2001), and Table 1 lists the specific physical and thermal parameters of each layer of the railroad subgrade.

Table 1 Moisture content and thermal parameters of soils in the subgrade
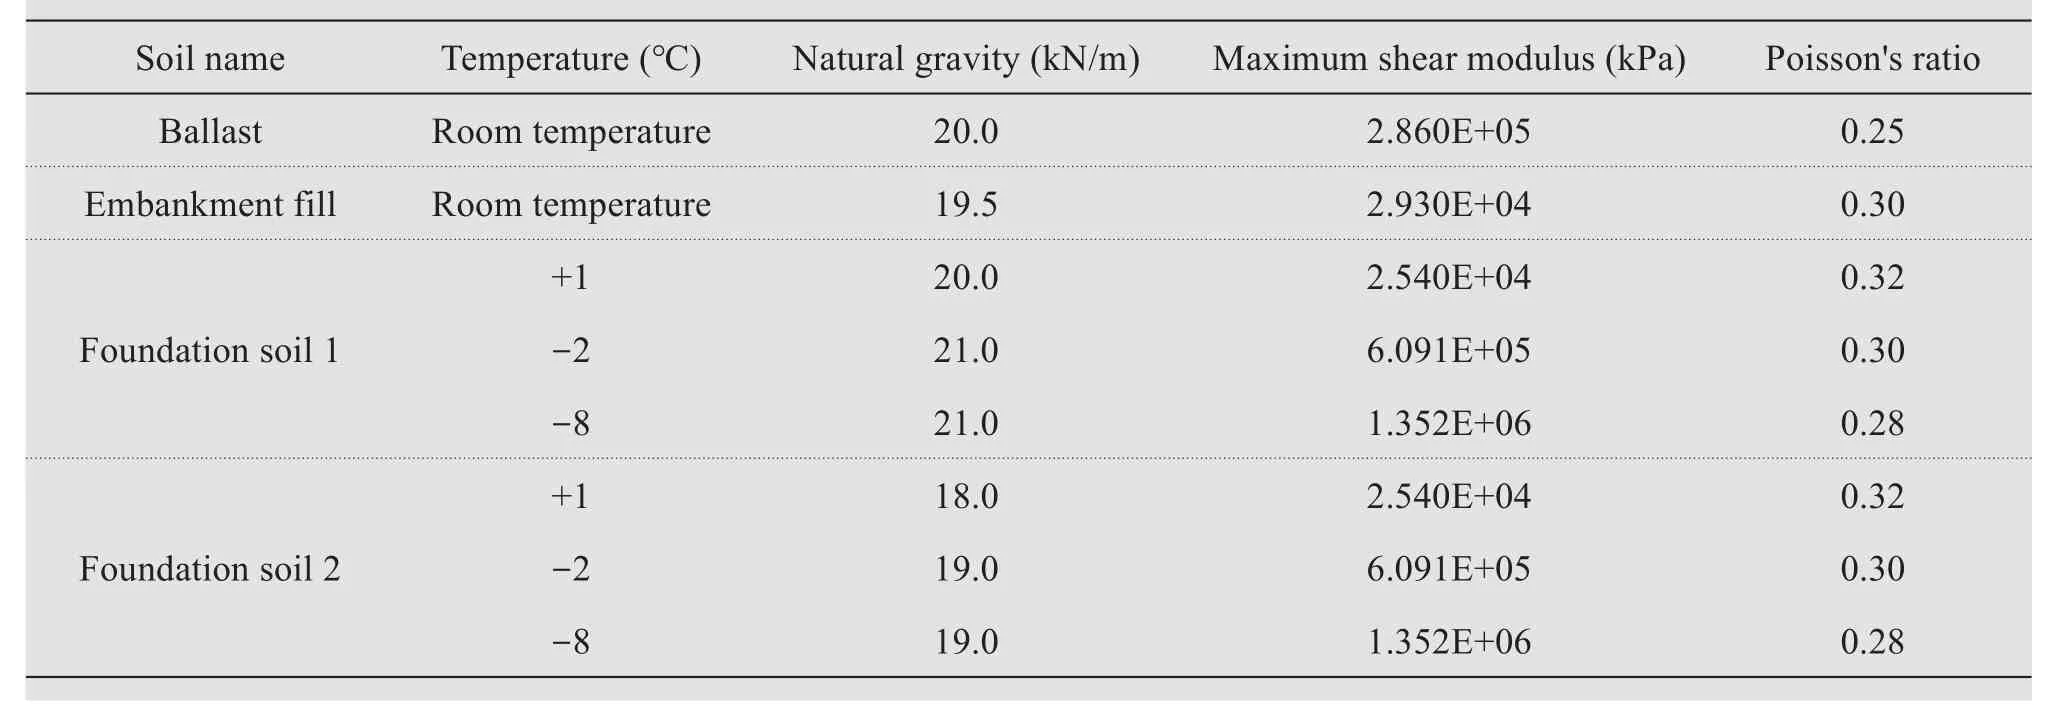
Table 2 Physical and mechanical parameters of railway subgrade soils
The physical and mechanical indices and dynamic parameters of the ballast bed,roadbed and native soils were selected by referring to relevant published literature and the results of low-temperature dynamic triaxial tests and in situ wave velocity tests from this study.Empirical formulae were used to establish the mechanical parameters of each soil layer and ballast bed,including the dynamic elastic modulus and damping ratio, considering the effects of temperature,freeze-thaw cycle, and loading frequency.The maximum dynamic shear modulus of the subgrade filling under different temperature conditions reported in a previous study (Wanget al., 2014) was adopted.The mechanical parameters of other soil layers of the railway subgrade in the region, such as the ballast and foundation soil, amongst others, at different temperatures, were obtained by referencing the relevant data reported in Zhanget al.(1989)and Linget al.(2009),which only considered the temperature influence and neglected the effects of other factors, such as loading frequency,water content,confining pressure.
3.4 Numerical model validation
Figure 3a compares the dynamic stress at the subgrade surface obtained by FE model simulation with those measured in the field.The simulated train loading corresponded to one locomotive (NJ2) + four cars(yz25)+one locomotive(NJ2)operating at 200 km/h.Figure 3a illustrates the subgrade vibration stress,while Figure 3b depicts the measured stress at the subgrade surface during the passing of a "China Star"train.A comparison of the two figures reveals that the FE-model simulated dynamic stress agrees well with the measured stress waveform, with the amplitude of both stress waveform on the subgrade surface peaking at about 50 kN.Therefore, the numerical model and its parameters were deemed reasonable and were used to simulate the subgrade dynamic stress characteristics.

Figure 3 Comparing of simulated dynamic stress histories with field monitored data
4 Results and analyses
4.1 Subgrade temperature field
The temperature field inside the roadbed with the insulation board installed at various depths from the roadbed surface is shown in Figure 4.A significant difference in the roadbed temperature field between the freezing and spring thawing periods can be observed.The temperature distributions on the upper and lower surfaces of the insulation layer are quite different, indicating that the insulation affords thermal resistance.Specifically, the thermal insulation board can prevent cold "energy" from penetrating through the upper surface of the roadbed to the foundation.
The frozen depth at the lower part of the embankment centre remains near the insulation board.The shallower the insulation board installation depth, the better is its thermal resistance.However, because of the influence of the mechanical properties of the thermal insulation board on the load-bearing behavior of the roadbed,the determination of the appropriate burial depth should consider both mechanical and thermal behavior insulation of the insulation layer.Additionally,the frost affects all boundaries exposed to the atmosphere, including the slope surfaces.Therefore, when laying an insulation layer, slope protection must be considered to prevent frost heave damage.
4.2 Maximum seasonally freezing depth
Figure 5 shows the changes in soil temperature with depth along the centerline of the subgrade without insulation layer in different seasons.The maximum frozen depth of the Binzhou Railway subgrade is approximately 2 m.The frost depth results are in good agreement with the published in the related literature, confirming the validity of the model.In the figure,the freezing period appears to commence on January 11.During this period, the temperature decreases gradually from the ground surface to deeper depths,changes steadily until 5 m below the ground surface and then stabilises at 10-15 °C.The temperature change also shows that the spring thawing period occurs between April 21 and May 15,during which a frozen soil layer lies below the roadbed surface, and the temperature below the freezing front gradually increases.The frost-free period occurs between July 15 and October 15, with the temperature steadily rising from June and peaking in July.During this period, heat is transferred from the roadbed surface downwards.Starting from October, the roadbed temperature decreases gradually from the surface to the interior.Because of the lag in heat transfer,the roadbed temperature is higher than that of the surface, so it increases first and then decreases from the surface to the underground.
The seasonal freeze-thaw curve along the roadbed centerline is shown in Figure 6.Beginning in late October every year, the roadbed freezes unidirectionally from the surface to the interior.When the surface temperature reaches its lowest value in late January through early February of the next year, freezing inside the embankment does not cease until the frozen depth peaks at approximately 2 m, which usually occurs at the end of March.After reaching the maximum frost depth, the frozen layer inside the embankment begins to thaw.The thawing process is driven by two-way warming,i.e., at the upper and lower surfaces of the frozen layer, and affected by the temperature difference, and the thaw speed at the upper surface is much faster than that at the lower surface.The frozen layer inside the embankment is completely thawed in mid-late May.

Figure 4 Subgrade temperature field contours with an insulation layer at various depth from the subgrade surface
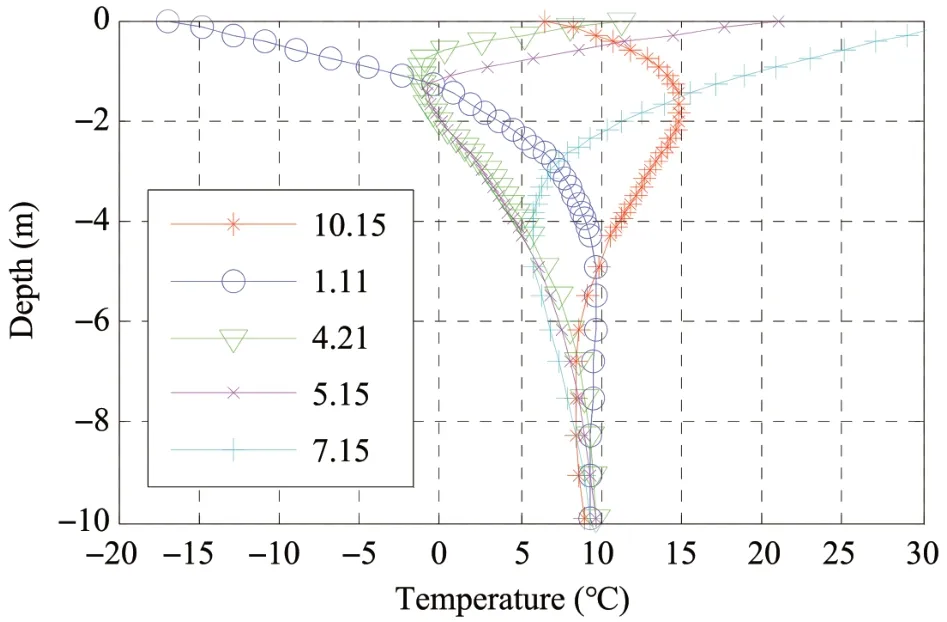
Figure 5 Temperature and depth of along the centerline of the railway subgrade without insulation layer for different seasons(month/day)
The temperature along the centerline of the roadbed shown in Figure 7 reveals that the subgrade temperature changes abruptly across the insulation layer.Taking February 10 as an example, the temperature is approximately -13 °C above the insulation layer but near 0 °C under it.The insulation also shows sound thermal effects on downward heat conduction in summer.The subgrade temperature under the thermal insulation layer is controlled between -5 °C and -20 °C.Therefore,the shallower the burial depth of the insulation boards,the better is the frost heave prevention effects.

Figure 6 Seasonal freeze-thaw process along the centerline of the railway roadbed
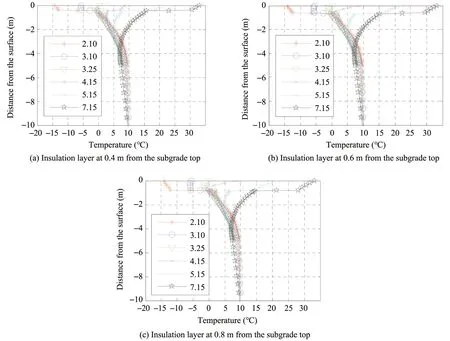
Figure 7 Temperature vs.depth along the centerline of subgrade cross-section with insulation layer for different seasons
4.3 Vibrational response of the subgrade with insulation layer
Figure 8 shows the attenuation of subgrade vibration stress amplitude with depth for cases with the insulation layer at various depths and without insulation.During the freezing period, the dynamic stress amplitudes of roadbeds with and without thermal insulation are remarkably different.The dynamic stress amplitude of the roadbed without thermal insulation is approximately 25 kPa, which is appreciably larger than those with thermal insulation at various depths.Among various burial depths, the dynamic stress amplitude measured in the case with the insulation layer at 0.4 m below the subgrade surface is slightly larger.The addition of the thermal insulation layer can protect the subgrade from freezing damage and prevent groundwater from migrating upwards, thus increasing the damping ratio of the subgrade surface and suppressing vibrations during the freezing period.
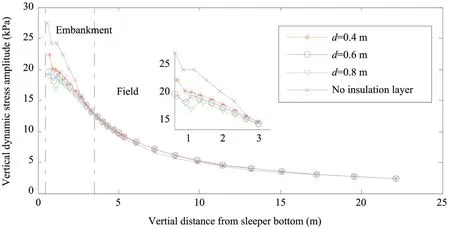
Figure 8 Attenuation of subgrade dynamic stress with depth for cases with and without insulating layer
Figure 9 depicts that the variation of the embankment surface acceleration amplitude with the horizontal distance from the roadbed center.Considerable fluctuations can be observed near the insulation layer.Above the insulation layer, the acceleration amplitude of the embankment without insulation is less than that of the embankment with insulation.In contrast, below the insulation layer, the opposite effects are observed.Above the insulation layer, the acceleration amplitude of the roadbed with the insulation buried at 0.4 m decreases rapidly; below the insulation layer, the roadbed acceleration amplitude is relatively constant.Figures 8 and 9 show that the insulation layer has obvious effects on the vibrational response of the roadbed.In the vicinity of the insulation boards, the vibrational response shows abrupt changes since the insulation boards embedded in the roadbed form a weak interlayer compared with the soils.The burial depth has a certain influence on the stress field and acceleration amplitude of the roadbed.The results show that the roadbed vibrational response is affected by anti-freezing measures such as an insulation layer.
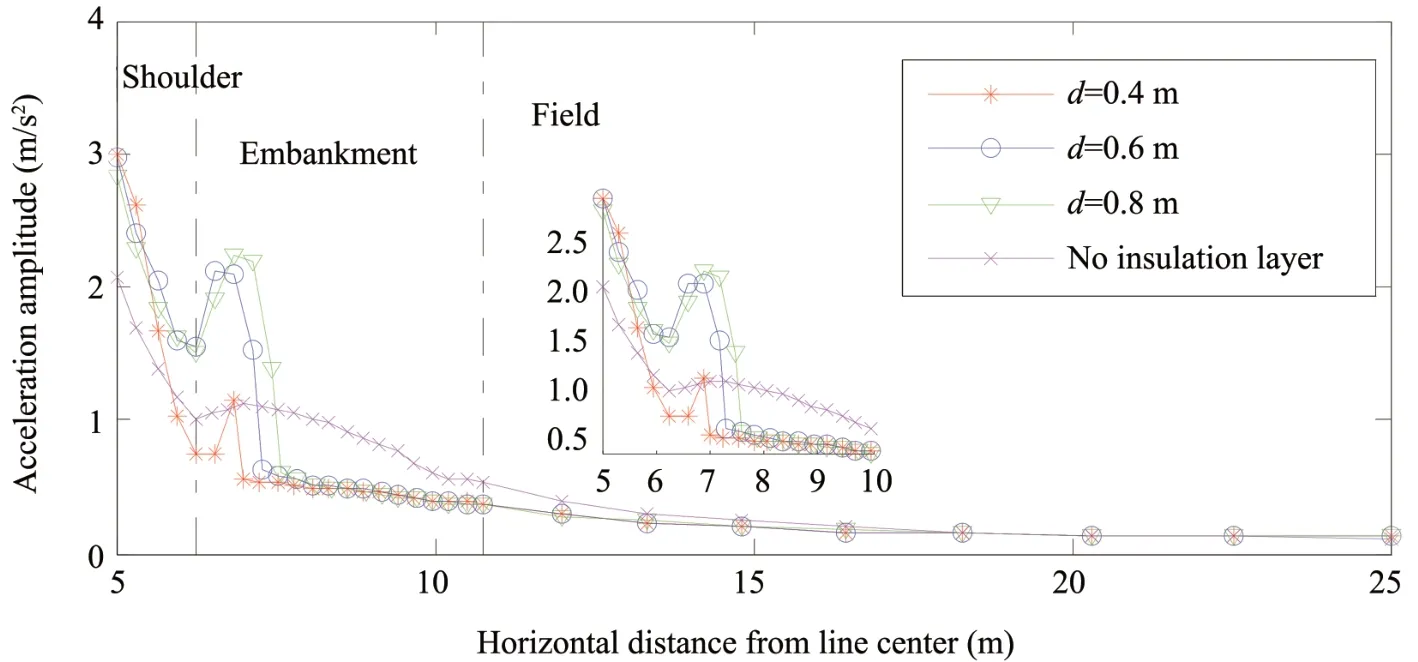
Figure 9 Attenuation of subgrade acceleration with depth for cases with and without insulating layer
5 Conclusions
The temperature field of railway subgrades in seasonally frozen regions varies with the season and is often accompanied by phase changes.Installing thermal insulation in the middle of an embankment is very effective in reducing the freeze-thaw effect on the subgrade.Comparison of the dynamic stress and acceleration under different freeze-thaw states with and without insulation layer is conducted, and the following conclusions are obtained:
(1) Prediction of the railway subgrade's temperature field in seasonally frozen regions may be conducted by the numerical method.Calculation of the temperature distribution of the Binzhou Railway subgrade since its establishment provides a basis for analysing the temporal and spatial distributions of the freeze-thaw state in railway subgrades in seasonally frozen soil regions.
(2) The maximum frost depth of the Binzhou railway subgrade is approximately 2 m.The model results are in good agreement with those reported previously,therefore validating the temperature model.
(3) The thermal insulation layer is effective in reducing the freeze-thaw effects on the roadbed below.The maximum frost depth is located near the burial depth of the insulation boards.Therefore, the shallower the insulation layer's burial depth, the better are the heat preservation and frost heave prevention effects.
(4)Establishment of a thermal insulation layer has apparent effects on reducing roadbed vibration whilst protecting the roadbed from freezing damage.The insulation board affords heat insulation, moisture isolation and shock absorption properties.Since the moisture content of the subgrade soil above the insulation layer decreases, the subgrade vibration is inhibited during the freezing period.
6 Discussions
Insulation boards present several advantages in heat insulation and moisture isolation and thus, have bright application prospects in subgrade insulation in seasonally frozen regions.Assessment of the optimal burial depth of the insulation layer is key to maximise the benefits of this technology.The most suitable burial depth should be determined in follow-up studies in combination with field tests.
Acknowledgments:
This research was supported by the Jiangsu Planned Projects for Postdoctoral Research Funds (2021K534 C), and the Heilongjiang Natural Science Foundation(No.QC2017035).
杂志排行
Sciences in Cold and Arid Regions的其它文章
- Research progress on behaviors and environmental effects of mercury in the cryosphere of the Tibetan Plateau:a critical review
- Desertification status mapping in Muttuma Watershed by using Random Forest Model
- Simulating the effect of wind erosion on aeolian desertification process of Horqin sandy land and its significance on material cycle:a wind tunnel study
- Geographic range size patterns across plants and animals of Xinjiang,China
- Spatial and temporal patterns of solar radiation in China from 1957 to 2016
- Guidelines to Authors
