Classification of Leukemia and Leukemoid Using VGG-16 Convolutional Neural Network Architecture
2022-03-17SriramGaneshBabuPraveenaandAnand
G.Sriram,T.R.Ganesh Babu,R.Praveena,★and J.V.Anand
1Research Scholar, Muthayammal Engineering College, Rasipuram, Namakkal, Tamil Nadu, 637408, India
2Muthayammal Engineering College, Rasipuram, Namakkal, Tamil Nadu, 637408,India
3Siddartha Institute of Science and Technology, Puttur, Andhra Pradesh, 517583, India
ABSTRACT Leukemoid reaction like leukemia indicates noticeable increased count of WBCs (White Blood Cells) but the cause of it is due to severe inflammation or infections in other body regions.In automatic diagnosis in classifying leukemia and leukemoid reactions, ALL IDB2 (Acute Lymphoblastic Leukemia-Image Data Base) dataset has been used which comprises 110 training images of blast cells and healthy cells.This paper aimed at an automatic process to distinguish leukemia and leukemoid reactions from blood smear images using Machine Learning.Initially,automatic detection and counting of WBC is done to identify leukocytosis and then an automatic detection of WBC blasts is performed to support classification of leukemia and leukemoid reactions. Leukocytosis is commonly observed both in leukemia and leukemoid hence physicians may have chance of wrong diagnosis of malignant leukemia for the patients with leukemoid reactions. BCCD (blood cell count detection) Dataset has been used which has 364 blood smear images of which 349 are of single WBC type.The Image segmentation algorithm of Hue Saturation Value color based on watershed has been applied. VGG16 (Visual Geometric Group) CNN(Convolution Neural Network)architecture based deep learning technique is being incorporated for classification and counting WBC type from segmented images.The VGG16 architecture based CNN used for classification and segmented images obtained from first part were tested to identify WBC blasts.
KEYWORDS Leukemia; leukemoid; neutrophil; eosinophil; lymphocyte; convolution neural network; monocyte
1 Introduction
Normally, the accepted range of White Blood Cell (WBC) count in healthy adult is about 4500 to 11,000 cells per cubic millimeter. Then, Leukocytosis can be defined as a condition in WBC count exceeding 11,000 cells/mm3[1]. This first part opens up more avenues to identify and investigate leukocytosis conditions, foremost nonmalignant leukocytosis. Sometime WBC count above(>50,000 cells/ml) that mimic leukemia is referred leukemoid reaction. Any enormously elevated leukocyte count is generally associated with broad spectrum of benign and malignant afflictions.Leukocytosis is customarily categorized based on WBC components that impart in elevating total WBCs count. Hence, leukocytosis can be resulted by an elevation of count in neutrophil, lymphocyte, monocyte,eosinophil, basophil,blasts cells or combination of these.Leukocytosis can also be observed in leukemia.
Leukemia is a cancerous type that generally originates in the bone marrows and causes a high count of anomalous WBCs. Such WBCs may not completely mature and are termed as blasts or leukemia cells. In contrast to other approaches that identify the nuclei first, which are more prominent than other components, the proposed approach isolates the whole leucocyte and then separates the nucleus and cytoplasm [1], this approach is necessary to analyze each cell component in detail. Automatic Otsu’s thresholds blood cell segmentation method along with image enhancement and arithmetic for WBC segmentation.KNN classifier has been utilized to classify blast cells from normal lymphocyte cells [2].
A technique that automatically detects and segments Acute Myeloid Leukemia(AML)in blood smears is presented [3]. It uses classification of complete blood smear images as opposed to sub images and uses algorithms to segment and detect nucleated cells. The technique first separate leukocytes from the other blood cells and then lymphocytes are extracted. In this context, a novel Computer Aided Diagnostic system (CAD) is designed for detection of hematological disorders like leukemia (blood cancer) based on Gray Level Co-Occurrence Matrices (GLCM) and shape based features [4]. A leukemoid reaction is a responsive elevation of WBC count, which can mimic leukemia. Elevated blast cells are not observed in leukemoid reaction in comparison with leukemia. The reaction is indeed because of an infection or inflammatory disease and cannot be a sign of cancer. WBC numbers generally recommence normal if the fundamental condition is medicated. Molecular interaction of irregular shape has been discussed using Geomco Positioning system. It combines an object based method to intensity based method. Object based method provides resilience against noise and content of fluorescence signal is estimated using intensity based method [5]. Biological processing with “Digital Lensless holographic microscopy” states that ImageJ plug-in has been used for interoperability for calculating numerical simulation [6]. Hence this work used Image with JaCoP plug-ins for analysis. Semantic segmentation has been used initially after pre-processing the blood cell images the pixel level features are extracted using deep convolutional encoder and decoder. The accuracy in classifying the RBC, WBC and platelets are better using Intersection of Union and Boundary Score[7].
The Fig.1 shows the evaluation procedure to classify leukemia and leukemoid reaction from peripheral blood smear images.
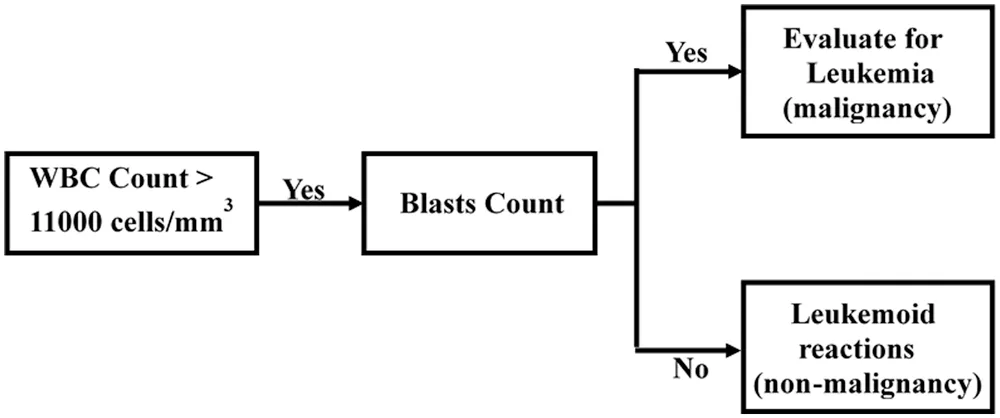
Figure 1: Evaluation methods to distinguish leukemia and leukemoid reaction
2 Background of Study
2.1 WBC Classification and Counts
This section will show variety of techniques which includes various image processing methods being presently realized for WBCs segmentation, classification and counting. Further, it demonstrates certain most new CNN architectures, particularly which utilized for proposed method presented in this paper.Rosyadi et al. [8] classified WBC from blood smear images. They adopted Otsu threshold technique for image segmentation and K-means clustering for WBC classification. They finally deduced that by using K-means clustering in classification and counting of WBC, several geometrical characteristics of its roundness resulted accuracy with 67% [8]. On the other hand, he suggested a technique that uses morphological features of area, eccentricity, boundary and roundness with classifier of Naïve Bayes to classify WBC. This technique was able to produce accuracy of 80.88% [9]. In an effort to enhance further the accuracy obtained in earlier methods, Yu et al. propounded a technique which utilizes CNN to classify WBCs automatically. The used CNN architectures namely: ResNet50, Inception V3, VGG16,VGG19, and Xception in their approach. This technique resulted 88.5% accuracy [10]. Currently, the CNN with different architectures exhibited growing significance in the development of image classification. Several CNN architectures were adopted previously by many investigators. However,contemporary models demonstrated to be quite effective on the enhancement of accuracy in image classification particularly on tasks namely detection and segmentation of objects.
Among the leukemia diagnosis systems developed over the years,some works present solutions using blood images for the classification of the two most common types of leukemia: Acute lymphoblastic leukemia (ALL)and acute myeloid leukemia(AML)[11].
In the work proposed by Korjakowska et al.[12],a system was developed to detect ALL using images from a single database,these images have multiple nuclei per image.The pre-processing step consists in the conversion of the image from RGB to the L*a*b color space.In the segmentation step,the unsupervised algorithm K-means is applied to components*a and*b from the converted image,with the number of groups equals to three. In the feature extraction step, they used shape features (e.g., area, perimeter, compactness,solidity, eccentricity, elongation and form-factor), Gray Level Co-Occurrence Matrix (GLCM) [13] and Fractal dimension [14] as descriptors. In order to evaluate the system, they used 98 blood images from the ALL-IDB1 database [15]. The classification was performed using Support Vector Machine and three techniques for cross-validation: k-fold, Hold-Out and Leave-One-Out. After analyzing the results, the authors concluded that the technique that obtained the best accuracy was Leave-One-Out with 93.50%.
2.2 Leukemia Classification
Leukemia classification systems evolved so far,certain works offer solutions in classification of Acute Lymphoblastic Leukemia (ALL) and acute myeloid leukemia (AML), the two most common types from blood smear images.
In [11], Madhukar et al. proposed a method to detect ALL from multiple nuclei images. In preprocessing, they converted the images of ALL-IDB1 database from RGB into L * a * b color space. In segmentation, the unsupervised K-means algorithm has been applied to the components to group them to three. A transfer learning of the pre-trained neural network using VGG-19 convolutional neural network(CNN) with an adapted connected classifier was used [12] and Gray Level Co-occurrence Matrix(GLCM) [13] as descriptors. The classification has been carried out with Support Vector Machine (SVM)and three methods for cross-validation such as k-fold, Hold-Out and Leave-One-Out. Finally, they concluded that the best accuracy of 93.5%has been obtained from Leave-One-Out method.
In[14]started converting images from RGB to the L*a*b color space and applied k-means clustering algorithm to separate the image based on their color information into 3 separate classes. For segmenting nuclei, contrast enhancement, auto-threshold and morphological operations were used. For feature extraction and classification, they performed in two steps. As first step, they applied Principle Component Analyzes (PCA) algorithm over feature vector set comprising 5 textural features, 4 GLCM features namely: entropy,energy, correlation and contrast and 1 fractal feature from Hausdoff Dimension and gave this as input to neural network classifier which intended to classify the cells into normal and abnormal.As second step, they applied the same PCA on different feature vector set comprising 5 geometrical features namely:cytoplasm area,nucleus area,cell area,nucleus-to-cell area ratio and nucleus-to-cytoplasm area ratio and gave as input to second form of neural network classifier to distinguish AML and Acute Lymphoblastic Leukemia (ALL). Levenberg-Marquardt (LM) algorithm was utilized for both neural networks and obtained an accuracy of 97.70%.
Reference [15] presented an automated method in finding leukemia from microscopic blood smears.They removed possible noises and applied K-means cluster and Zack algorithms on gray scale images and achieved an accuracy of 93.57% with Support Vector Machine (SVM). In [16], Agaian et al.proposed a method that converts color space of RGB into L*a*b color space and applies K-means to extract features namely color, shape, GLCM, Fractal dimension and Haar wavelets. SVM was utilized as a classifier and obtained 94%accuracy.
The survey presented in this section discussed several recent techniques that used similar to classify and count blood images for leukocytosis and classify malignant leukemia.Further,it was observed that there are no works yet involving classification of malignant leukemia and non-malignant leukemoid reaction. Many researchers have been using deep leaning techniques for classification with complex feature descriptors[17],which assumed as a development work for powerful computational systems. Hence in this paper, for finding leukocytosis,refer Fig.2a,a simple image segmentation process of HSV color based watershed was applied on BBCD dataset images and resulted segmented images were given as input to VGG16 CNN in classification of WBC components. Experiments are carried out on the ALL-IDB1 dataset, and comparative analysis has been made with other existing schemes with sensitivity, specificity, and classification accuracy[18]. Further, to distinguish malignant leukemia and non-malignant leukemoid reaction, refer Fig. 2b The morphological contour segmentation detects the edges of nuclei and eliminate the normal white blood cells from the microscopic blood image [19] VGG16 CNN network with ALL IDB2 dataset images was used to classify blast and normal cells. BCCD dataset of 349 images was used in first part and ALL IDB 1 dataset of 108 images and ALL IDB2 dataset of 110 images(blast cells and normal cells each).
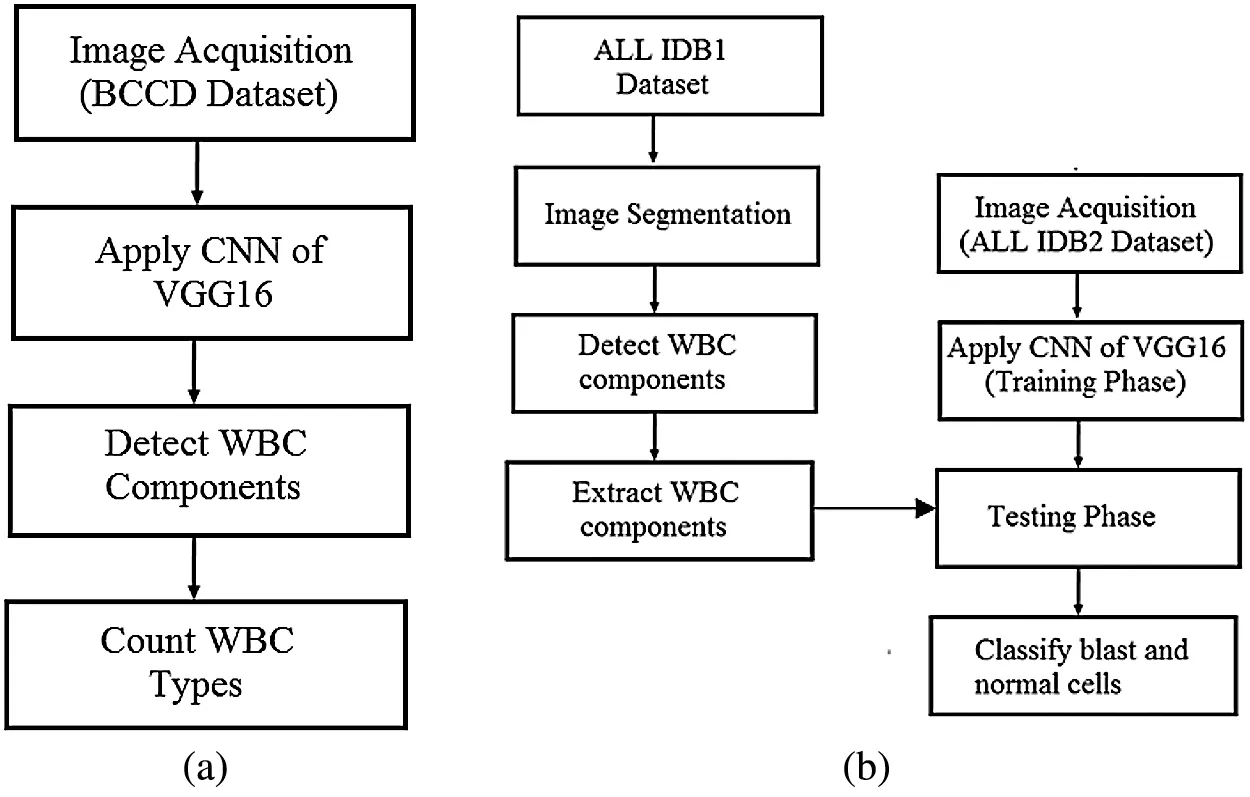
Figure 2: (a) Proposed method to classify and count WBC components from BCCD image dataset to determine leukocytosis (b) Segmentation and classification of blasts and normal cells from ALL IDB1 dataset by training network with ALL IDB2 dataset
3 Proposed Method
3.1 Research Aims and Objectives
In the medical field, physical measurements, manual processing and classification of medical images have increased time and stress of clinicians. Hence this research aims to develop an automatic system for the detection of Leukemia and Leukemoid So, the main objectives of this research are as follows:
• To distinguish leukemia and leukemoid reactions from blood smear images using VGG16 Architecture.
• To determine accuracy of WBC Types,namely Neutrophil,Eosinophil,Lymphocyte and Monocyte.
• To determine accuracy of Blasts and Normal.
3.2 Design and Setting of the Study
The method suggested here directs to diagnose leukemia or leukemoid reaction from blood smear images.From flowchart depicted in Figs. 2a and 2b, the method used is without any initial preprocessing or segmentation over images before giving as input to classifier. This is important findings between proposed system and any other previous methods presented as state-of-the-art. For the classification and counting of WBCs, VGG16 CNN has been used to identify and detect of WBC components as shown in Fig. 2a. For classification of leukemia or leukemoid reaction, separate VGG16 CNN has been used to train it with ALL IDB2 dataset and to classify blast or normal cells from segmented image of ALL IDB1 dataset.
Convolution Neural Network and VGG16
Convolutional Neural Network(ConvNet or CNN)that performs chiefly the“convolution”operator is a class of Neural Networks that showed highly successful in domains namely image classification and recognition. It comprises 4 main operations (refer Fig. 3 [20]) Convolution, Non Linearity rectified linear unit (ReLU),Pooling or Sub Sampling and Fully Connected Layer. ConvNet primarily extract features from images and holds the spatial association between pixels by learning features of input image in smaller squares.A kernel or filter of convolution layer slides over the input image that performs convolution operation will generate a convolved map and several different filters that can perform tasks namely: edge detection, blur and sharpen,over the same image produce different convolved maps. Convolved maps describe the local dependencies of an image. After each convolutional layer, an activation function is applied. These functions namely Rectified Linear units (ReLu), tanh or sigmoid introduce non-linearity in ConvNet. Next succeeding max pooling layer will decrease the number of features by taking largest element from rectified feature maps. The final fully connected layer gathers all features descriptors and flattens every matrix map into a vector.
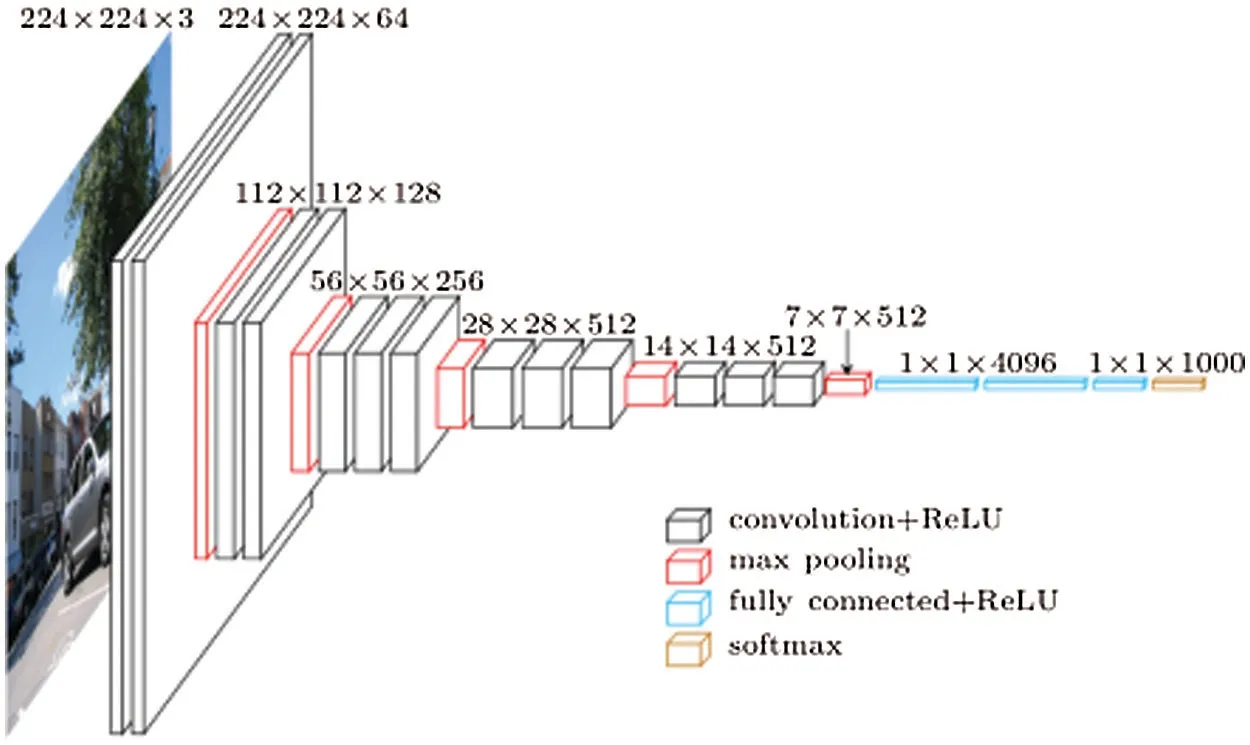
Figure 3: VGG16 architecture
VGG uses only 3×3 convolutional layers superposed one over another in growing depth. Decreasing volume size is performed by max pooling. Fully-connected layers with 4,096 nodes of 2 in number are trailed by a Softmax classifier.
The VGG [21] group has utilized six deep convolutional neural networks out of which VGG16 and VGG19 models were found successful. VGG used depth as most prominent parameter to evaluate the network suitable for best recognition and accuracy in its classification of convolutional neural networks. It used 3×3 filters, having two consecutive two filters to give an better accessible field of 5×5 size, and three 3×3 filters of 7×7 filter size was used. After performing, every max-pooling operation the filter numbers present in the architecture can get doubled. The VGG16 network comprised of convolutional layers 13 in number and fully connected layers three in number. Also, VGG19 has convolutional layers 16 in number and fully connected layers 3 in number. Both VGG networks utilizes small convolutional filters stack of 3×3 size with Stride 1 across the filter operation, where non-linear layers in multiple numbers follow them. More complex features can be analyzed by using deeper architecture in them which can improve the accuracy of prediction. VGG-19 indicates significantly that 19 layers deep convolutional layers are required to perform best classification in its accuracy.This network comprised of 47 layers where learnable weights are associated with 19 layers, 16 layers perform convolutional operation and finally associated with fully connected layers that are three in number. Depth has always become a significant parameter to determine the accuracy in classification.Fig.4 shows the layers of VGG-16 architecture.
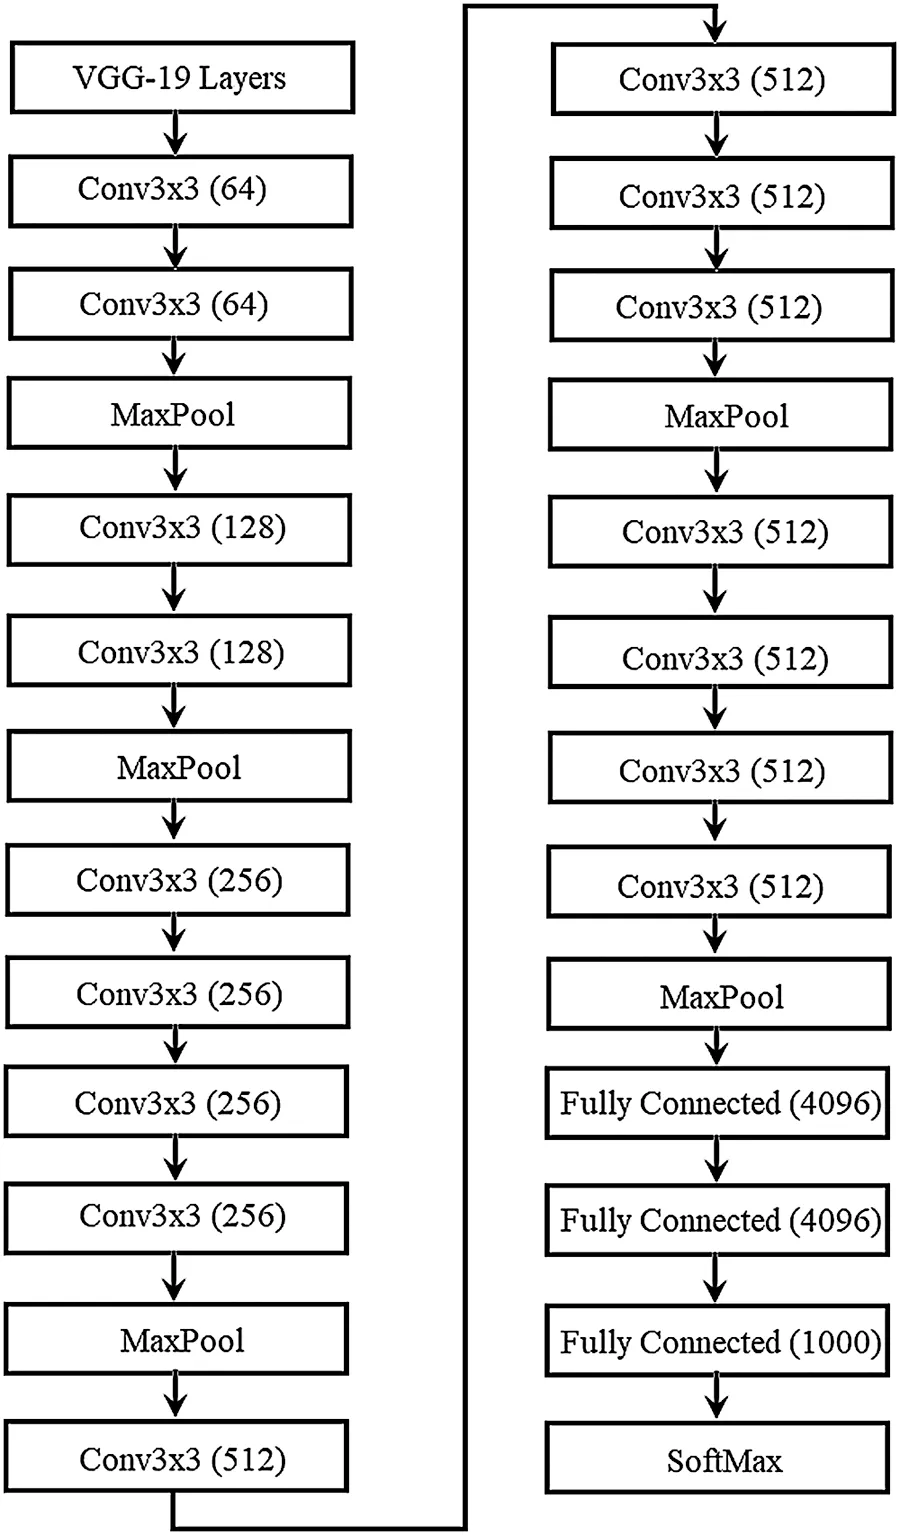
Figure 4: Layers of VGG-16
The layers of VGG-19 are arranged such that convolution operation is performed using 3×3 filter size.After subsequent convolution operation maxpooling is performed to increase the image size from 128 to 256 and 512. This operation is continued until fully connected layer comprised of upto 1000 neurons.The best output across every layers is selected optimally using softmax layer to arrive at most accurate classification that is involved.
BCCD Dataset is a small scale image set for blood cells detection.Each image is with 640×480,width and height respectively and contains RBC, platelets and one or more WBC type, Neutrophil, Eosinophil,Lymphocyte, Monocyte or Basophil. Fig. 5 shows some sample images of WBC components and Fig. 6 shows their segmented WBC cells.

Figure 5: BCCD Dataset (a) Neutrophil (b)Eosinophil(c) Lymphocyte(d)Monocyte(e) Basophil

Figure 6: Segmented image (a) Neutrophil(b)Eosinophil (c) Lymphocyte(d)Monocyte (e) Basophil
The major issue that researchers encounter when exploring solutions for detection and classification of leukemia diseases is limited availability of dataset. Presently freely available public dataset related to leukemia is ALL IDB alone and the same were usually utilized.
4 Result
BCCD Dataset comprises 364 images from healthy individual in which 15 images contain two or more WBC components and 3 were Basophil.Basophil images were discarded because its effect for leukemia is not quite significant.In first part of experiment,meant for leukocytosis evaluation,346 blood smear images that contain single WBC type from BCCD Datasets were used.The VGG16 CNN has been trained with 70%(i.e., 242 images) of 349 images and remaining 30% (104 images) was used to classify. Fig. 7 displays sample images of WBC component and Fig. 8 shows their segmented for WBC cell and nucleus.VGG16 CNN was implemented to classify WBC components and count them from 104 images.
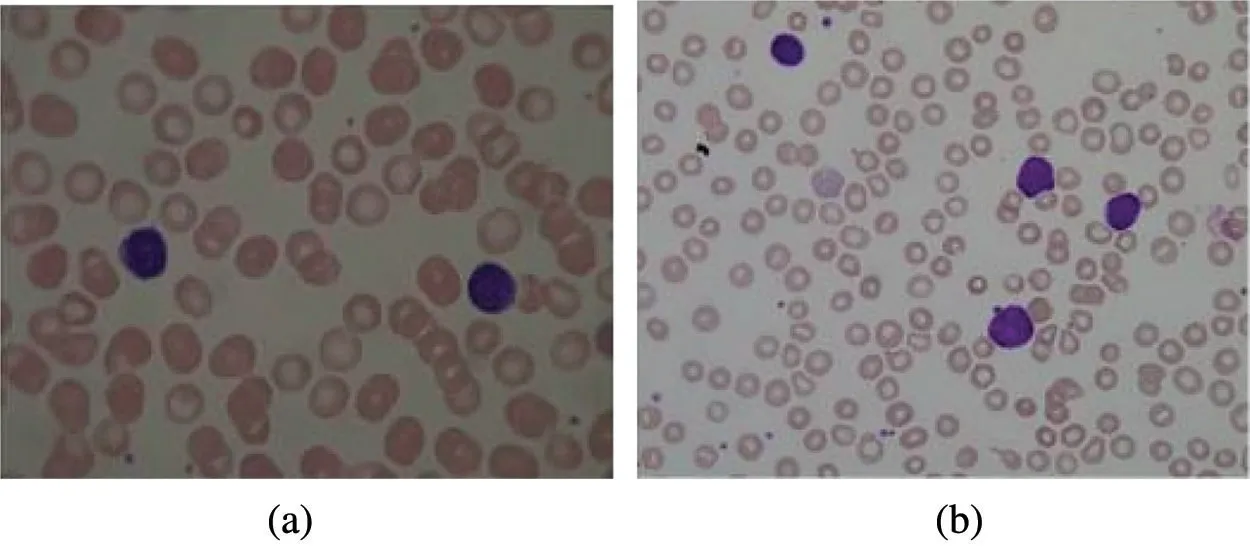
Figure 7: ALL IDB 1 images (a) Healthy cells of non-ALL patient (b)Blasts cells of ALL patients
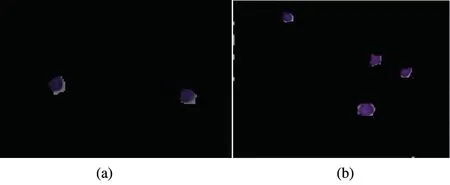
Figure 8: Segmented images of (a) Healthy cell of non-ALL patient (b)Blasts cell of ALL patients
5 Discussion
Table 1 shows the differential count of WBC components of healthy individual performed by classifier.Neutrophil-lymphocyte count ratio (NLR) is potential marker for several cancer types from this Table 1.Leukocytosis (elevated count) and NLR can be deduced. Fig. 9 shows Confusion matrix to assess the performance of classifier in classifying and counting WBC. Fig. 10 shows the accuracy and loss of the model over 20 epochs. 30%of the dataset used for validation.
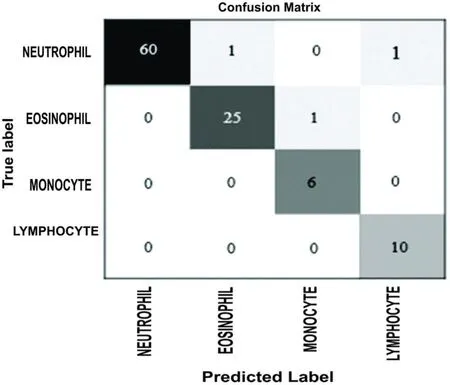
Figure 9: Confusion matrix to assess the performance of classifier in classifying and counting WBC
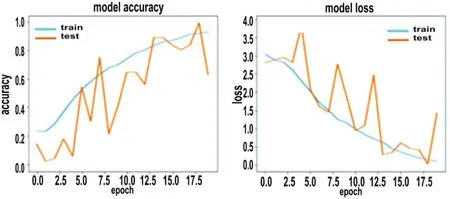
Figure 10: The accuracy and loss of the model over 20 epochs.30%of the dataset used for validation

Table 1: Comparison of WBC classification and count between actual and predicted by classifier
ALL IDB comprises 2 versions,ALL IDB 1 and ALL IDB 2.ALL IDB 2 comprises 260 cropped images of normal and blasts cells and 50%of them constitute blasts.Fig.11 depicts sample images of healthy and blasts cells from this dataset.
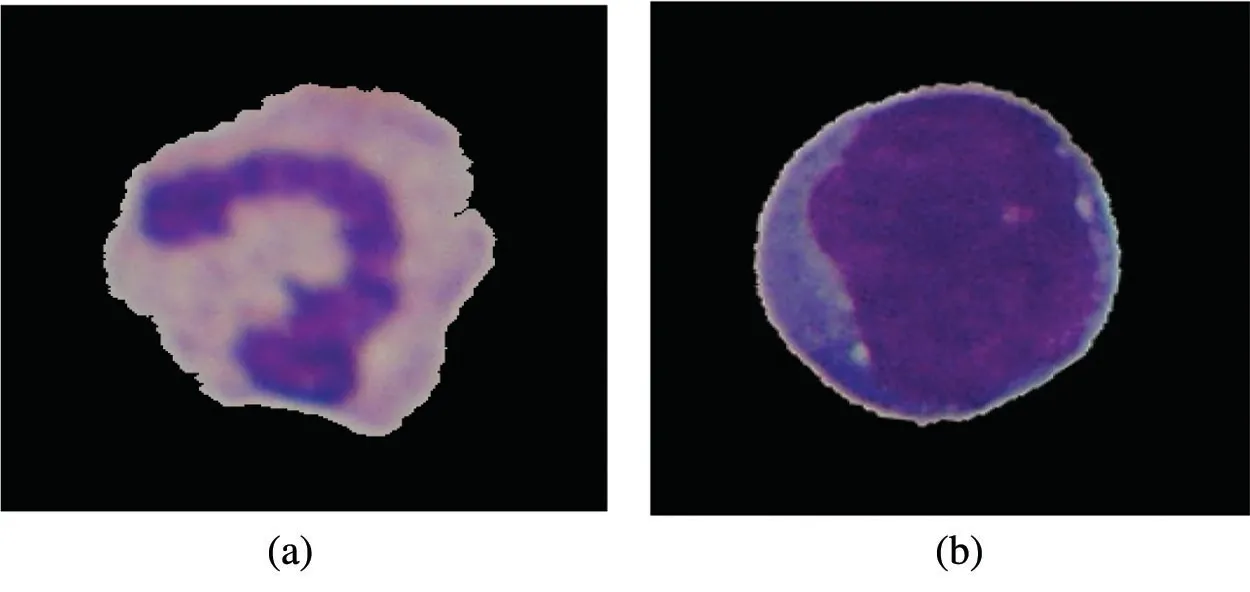
Figure 11: ALL IDB 2 images (a) Healthy cell of non-ALL patient (b)Blasts cell of ALL patients
ALL IDB 1 dataset contains 108 images of blasts (particularly Lymphoblast) and normal. It contains 39000 blood elements out of which 510 lymphoblast cells are present. In second part of experiment,meant for blasts detection, entire ALL IDB2 images were used to train the VGG16 CNN and ALL IDB1 of randomly chosen 10 images were used to validate and classify the normal and blasts.These images constitute 199 normal and 104 lymphoblast cells Initially,ALL IDB1 images were segmented by the method of HSV color based watershed.Table 2 shows the manual count and detection of normal and blasts performed by classifier.The presence of the blasts indicates the patients afflicted by acute or chronic leukemia whereas absence indicates the patients affected by leukemoid reaction.This decision enables to avoid cancer therapy in leukemoid reaction patients.Fig.12 shows the confusion matrix to assess the performance of classifier in classifying normal and blasts.The Fig.13 shows the accuracy and loss of the model over 20 epochs.30%of the dataset used for validation.

Table 2: Comparison of blasts vs.normal classification between actual and predicted by classifier
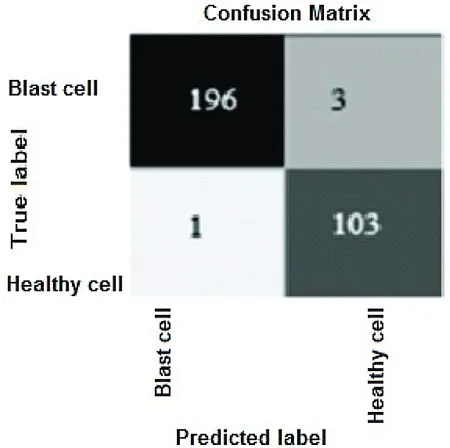
Figure 12: Confusion matrix to assess the performance of classifier in classifying normal and blasts
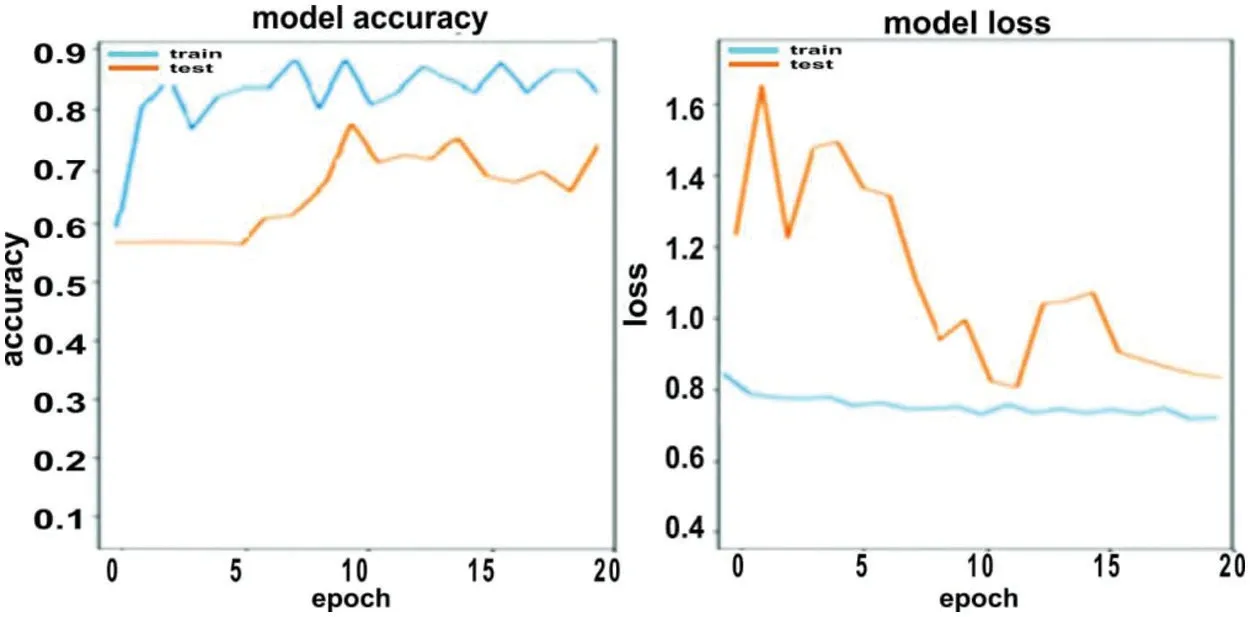
Figure 13: The accuracy and loss of the model over 20 epochs.30%of the dataset used for validation
6 Conclusion
The proposed methods in leucocyte classification and counting, and blast cells classification can be potentially utilized for accurate diagnosis of leukemia and leukemoid reaction and supports physicians to come up with appropriate therapy for patients. Performance of the proposed methods predominantly augmented dataset so as to validate the precision and reliability of the proposed deep learning architecture. Being the dataset was augmented from only particular kind of Leukemia the acute lymphoblastic leukemia (ALL), we intend to use chronic lymphocytic leukemia (CLL) dataset and carry out future work to differentiate CLL with leukemoid reaction.
Funding Statement:The authors received no specific funding for this study.
Conflicts of Interest:The authors declare that they have no conflicts of interest to report regarding the present study.
杂志排行
Molecular&Cellular Biomechanics的其它文章
- Effect of Resistance Training and Spirulina platensis on Expression of IL-6,Gp130 Cytokines,JAK-STAT Signaling in Male Rats Skeletal Muscle
- Comparative Study on Biomechanics of Two Legs in the Action of Single-Leg Landing in Men’s Badminton
- Lung Nodule Detection Based on YOLOv3 Deep Learning with Limited Datasets
- Nuclear Stress-Strain State over Micropillars: A Mechanical In silico Study
