Wi-Fi Positioning Dataset with Multiusers and Multidevices Considering Spatio-Temporal Variations
2022-03-14ImranAshrafSadiaDinSoojungHurandYongwanPark
Imran Ashraf,Sadia Din,Soojung Hur and Yongwan Park
Department of Information and Communication Engineering,Yeungnam University,Gyeongsan-si,38541,Korea
Abstract:Precise information on indoor positioning provides a foundation for position-related customer services.Despite the emergence of several indoor positioning technologies such as ultrawideband, infrared, radio frequency identification, Bluetooth beacons, pedestrian dead reckoning, and magnetic field,Wi-Fi is one of the most widely used technologies.Predominantly,Wi-Fi fingerprinting is the most popular method and has been researched over the past two decades.Wi-Fi positioning faces three core problems: device heterogeneity, robustness to signal changes caused by human mobility, and device attitude,i.e., varying orientations.The existing methods do not cover these aspects owing to the unavailability of publicly available datasets.This study introduces a dataset that includes the Wi-Fi received signal strength(RSS)gathered using four different devices,namely Samsung Galaxy S8,S9,A8,LG G6,and LG G7,operated by three surveyors,including a female and two males.In addition,three orientations of the smartphones are used for the data collection and include multiple buildings with a multifloor environment.Various levels of human mobility have been considered in dynamic environments.To analyze the time-related impact on Wi-Fi RSS, data over 3 years have been considered.
Keywords: Wi-fi positioning dataset; smartphone sensors; benchmark analysis; indoor positioning and localization; spatio-temporal data
1 Introduction
The wide prevalence of mobile devices, which mostly comprise of smartphones, paved the way for several new services.In 2020, ~3.5 billion smartphones were in use, indicating an increase of 9.3% from 2019 [1].Nowadays, many services are offered on smartphones where users can perform online operations ranging from shopping to financial transactions.Various operations,such as shopping, traveling, on-the-go services, online marketing, food, and rescue operation,are associated with the location of end-users.Therefore, the precise location information is an important factor, which improves customer satisfaction and the quality of service (QoS).In a smartphone, precise location information is determined using sensors such as accelerometer,gyroscope, magnetometer, barometer, Wi-Fi, lux meter, and Bluetooth.Moreover, to provide the information of user-oriented operations, i.e., optimal display, phone orientation, and battery optimization, the data of the aforementioned sensors are used to detect the location of users and track the walking trajectory of the users.
Location-specific services are offered for indoor and outdoor environments; however, the positioning technology for both environments is different.For example, the global positioning system (GPS) can detect the user location within few meters and is considered as the de facto technology for outdoor positioning [2].However, outdoor positioning experiences challenges in specific regions, which include surroundings like high-rise buildings, canyons, and other such environments where the coverage of visible satellites is low.The indoor environment has additional challenges that complicate the positioning process and GPS positioning, resulting in errors.GPS faces several physical barriers, such as roofs, walls, and other similar interference sources, that increase positioning errors.Similarly, signal absorption, scattering, and reflection lead to the low coverage of visible satellites, and thus, the error region in positioning becomes larger than the indoor area.
Indoor positioning is more important than outdoor positioning, as humans spend most of their time indoors [3].Indoor activities in offices, train stations, shopping malls, and university constitutes ~80% of the overall activities [4].Consequently, the indoor position is more important than the outdoor position, and a precise indoor positioning technology holds great market potential.Over the years, several indoor positioning technologies, including ultrawideband (UWB) [5],radio frequency identification (RFID) [6], infrared (IR) [7], Bluetooth low energy (BLE) [8],magnetic field-based positioning [9], and Wi-Fi [10,11] have been proposed.Indoor positioning approaches are categorized as infrastructure-based and infrastructure-less approaches where UWB,RFID, and Bluetooth belong to the former category and magnetic field and Wi-Fi positioning belong to the latter category.Wi-Fi uses the already deployed access points (APs) and does not require additional sensors or hardware as UWB and RFID do.
The aforementioned indoor positioning technologies have limitations.For example, UWB offers high positioning accuracy and incurs high cost for the installation of sensors and receivers in the indoor environment.Additional cost depends on the indoor area and desired positioning accuracy.For higher accuracy, more sensors are required.Similarly, the RFID positioning technology provides an accurate position; its short operating range requires a large number of RFID tags and receivers to perform indoor positioning, which increases the deployment cost [12].The implementation of IR positioning is inexpensive for small areas, such as rooms and offices;however, large areas require several receivers for a higher positioning accuracy, which increases the implementation cost [13].In addition, the line of sight (LOS) problem and interference from fluorescent light and sunlight degrade the positioning performance.BLE offers good positioning accuracy; however, discovering available devices is time-consuming [14].Moreover, many BLE beacons are required to perform indoor positioning.The magnetic field is a relatively new positioning technology that has several advantages over other technologies, e.g., slow-time-related mutation,low impact of dynamic environments, and spatial uniqueness [15].However, several factors, such as device dependency, influence of various ferromagnetic materials, and impact of spatial diversity,are yet to be studied [16].
Using Wi-Fi technology for indoor positioning has several advantages over other approaches.First, it uses the available infrastructure and commercial-off-the-shelf (COTS) applications to estimate the current position of the user.Working places, shopping malls, and universities have already deployed Wi-Fi APs for communication and the Internet.Although such deployment is considered for internet communication, it can be used for indoor positioning as well, which implies that Wi-Fi positioning is cheap and does not require additional infrastructure.Second, the implementation is easy, and the positioning process is simple to adapt.For instance, fingerprinting is one of the most widely used positioning methods for Wi-Fi technology.Third, it has been researched for two decades, and related modifications and improvements over time provide an acceptable position accuracy.It has several issues that are under research, and further investigation can help enhance positioning accuracy.
In Wi-Fi positioning, three problems that require attention are human mobility in dynamic environments, device heterogeneity, and the complex attitude of users during the positioning process, which involves different orientations of the smartphone.Signal absorption, multipath,and shading in dynamic environments cause signal fluctuation and affect positioning accuracy.Human mobility, human body loss, and diversity in antenna and hardware affect the received signal strength (RSS) value [17,18].To investigate these issues, a diverse publicly available dataset is required.This study introduces a Wi-Fi dataset to analyze the aforementioned factors and makes the following contributions:
• Important characteristics are introduced regarding the Wi-Fi benchmark dataset and include dynamicity, orientation, user diversity, time-based mutation, and smartphone heterogeneity(DOUTS).These characteristics are discussed regarding their importance to perform the positioning in the indoor environment.
• The importance of each element of DOUTS is investigated, and its impact is analyzed with the collected Wi-Fi data.Moreover, the significance of each item is discussed by visualizing the Wi-Fi data during extensive experiments.
• A critical appraisal of previous publicly available benchmark datasets is provided, where various aspects of the benchmark are elaborated.In addition, the available datasets are discussed regarding the DOUTS elements.
• The introduced dataset considers multiple smartphones for data collection in five different buildings: four buildings in a university campus and one large exhibition hall.The data are collected over a long period spanning ~5 years.The data collection involves three different orientations of a smartphone.Five smartphones have been used for data collection:Samsung S8, LG G6, Samsung A8, LG G7, and Samsung S9+.
• To study the dynamic behavior of Wi-Fi positioning, different human mobility conditions are considered.Moreover, data from corridors and rooms are collected in a multifloor environment.To investigate “stairs up” and “stairs down” events, data of stairs have also been collected.
The remainder of the paper is organized as follows.Section 2 introduces important elements necessary for the Wi-Fi benchmark dataset.Section 3 briefs the publicly available datasets and their importance pertaining to the DOUTS elements.Section 4 describes the data collection process and scenarios, smartphones, and users/data collectors.Section 5 defines the structure of the dataset and its use for positioning.Section 6 discusses the proposed Wi-Fi dataset and concludes the paper.
2 Important Elements of Wi-Fi Datasets for Indoor Positioning
Although Wi-Fi positioning has been regarded as an extensively researched domain, several aspects remain unresolved.Wi-Fi characteristics that can influence the performance of indoor positioning approaches are discussed here.
2.1 Dynamic Environment
Wi-Fi signals provide an efficient solution for indoor positioning.The wide deployment of Wi-Fi APs in indoor buildings, e.g., public offices, university campuses, shopping malls, and train stations, make them potential candidates for indoor positioning and localization.Consequently,they have been extensively researched over the past two decades.However, there are several challenges for Wi-Fi-based positioning approaches.For example, a big challenge for wireless signals is the dynamic environment involving transient and permanent changes.Permanent changes include infrastructural changes that involve the placement of furniture and similar objects.These changes cause fluctuations in RSS and affect the positioning performance.Transient changes are short-time dynamic changes, such as door opening and closing, that affect the RSS value [19,20].Human mobility falls under transient changes and significantly affects the RSS value [21].Wireless signals are absorbed and attenuated by the human body and change the RSS value, which affects the positioning performance [22].The influence on the RSS value has a strong relationship with the distance of the blocking human body from the Wi-Fi AP and the number of people present at the time of data collection [23].Owing to the influence of the dynamic environment, Wi-Fi in different dynamic conditions is essential to investigate the positioning performance of the Wi-Fi-based approaches where the existing publicly available datasets lack.In addition to that, the dimension of the space used for positioning is important as larger areas report more positioning errors.
2.2 Orientation of the Smartphone
Smartphone orientation significantly impacts the measured RSS value.Changing the orientation involves changing the direction, which yields different RSS values.For illustration, the RSS data are collected using three orientations of the smartphone: “navigation,” “call listening,” and“phone swinging.”“Navigation”means that the phone is handheld at a height parallel to the navel of the body of the user; “call listening”involves holding the phone with the hand beside the right ear; and “swinging” refers to the phone held in the right hand beside the leg at a knee height.Fig.1 shows the measured RSS values for the orientations, and the measured values are not the same.
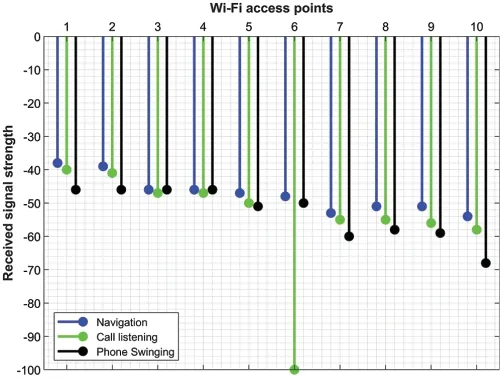
Figure 1: Visible Wi-Fi APs and their RSS values suing three different orientations of Galaxy S8
2.3 User Diversity
The height of the user carrying the smartphone for data collection affects Wi-Fi data.Based on the height of the user and the phone-holding style, the measured RSS value can vary [24].Depending on the phone-holding style of the user, the direction of the smartphone may change,thus affecting the received signal quality.Similarly, changing the smartphone direction modifies the measured RSS value.LOS APs may become non-line of sight when changing the device direction,which substantially influences the measured RSS value.To corroborate this hypothesis, the data are collected using a smartphone in a static environment with no human mobility.In addition,there is no other change in the environment, e.g., door or window opening or closing during data collection.Moreover, the data are collected over a short period of 5 min.Fig.2 shows the measured RSS of Samsung Galaxy S8 on a table, facing different directions.It shows that in a static environment with no human movement, different scans return different values for Wi-Fi RSS.
2.4 Time Related Mutation of Radio Signals
Over a period, Wi-Fi signals deplete and exhibit high variations [25].Temporal (time-related)changes in Wi-Fi signals are significant and can cause a large amount of positioning errors in Wi-Fi-based indoor positioning [26].The depletion and mutation of Wi-Fi signals over time have been regarded as major problems for Wi-Fi positioning, which affects the positioning performance.Previous reports confirmed that if the gap between the training and testing data is more, the positioning error count will be more [27,28].Similarly, the data collected in different seasons, such as summer and winter, are different owing to changes in temperature [29].Several approaches have been proposed to overcome the time-related mutation of the received signal strength indicator(RSSI).For example, Zheng et al.presented an approach to reduce the positioning error by adopting two-stage positioning [30].Wi-Fi APs are grouped based on their RSSI to improve the positioning accuracy.Similarly, Kullback-Leibler divergence is used in [31] to calculate the RSS similarity, which improves the positioning performance.An approach known as weighted RSS (WRSS) is proposed in [32], which mitigates the influence of varying RSS and improves the accuracy.Instead of using the RSSI, a pair is stored and comprises RSSI and its associated weight.Another approach to overcome the limitation of varying RSSI is in the study [33],where the positioning is performed using the coverage area of Wi-Fi APs.Results demonstrate that the impact of RSSI mutation can be reduced significantly.Despite the improved results of the aforementioned studies, the data of these studies are not available.Moreover, the existing datasets do not provide data of a long period, and this property of Wi-Fi positioning cannot be investigated.
2.5 Smartphone Heterogeneity
In addition to the influence of different directions and orientations, a large number of smartphone models create problems to achieve uniform accuracy as the collected RSS values of different smartphone companies and models are significantly different.The fluctuation in the measured RSS is caused by different hardware and software capabilities of various smartphones [34].Similarly,various antenna designs and chipsets embedded in the smartphone affect the values of RSS [35].Fig.3 shows the measured RSS values of four different smartphones to analyze the impact of smartphone heterogeneity.Samsung Galaxy A8, Galaxy S8, Galaxy S9+, and LG G7 are used to generate the graph shown below.
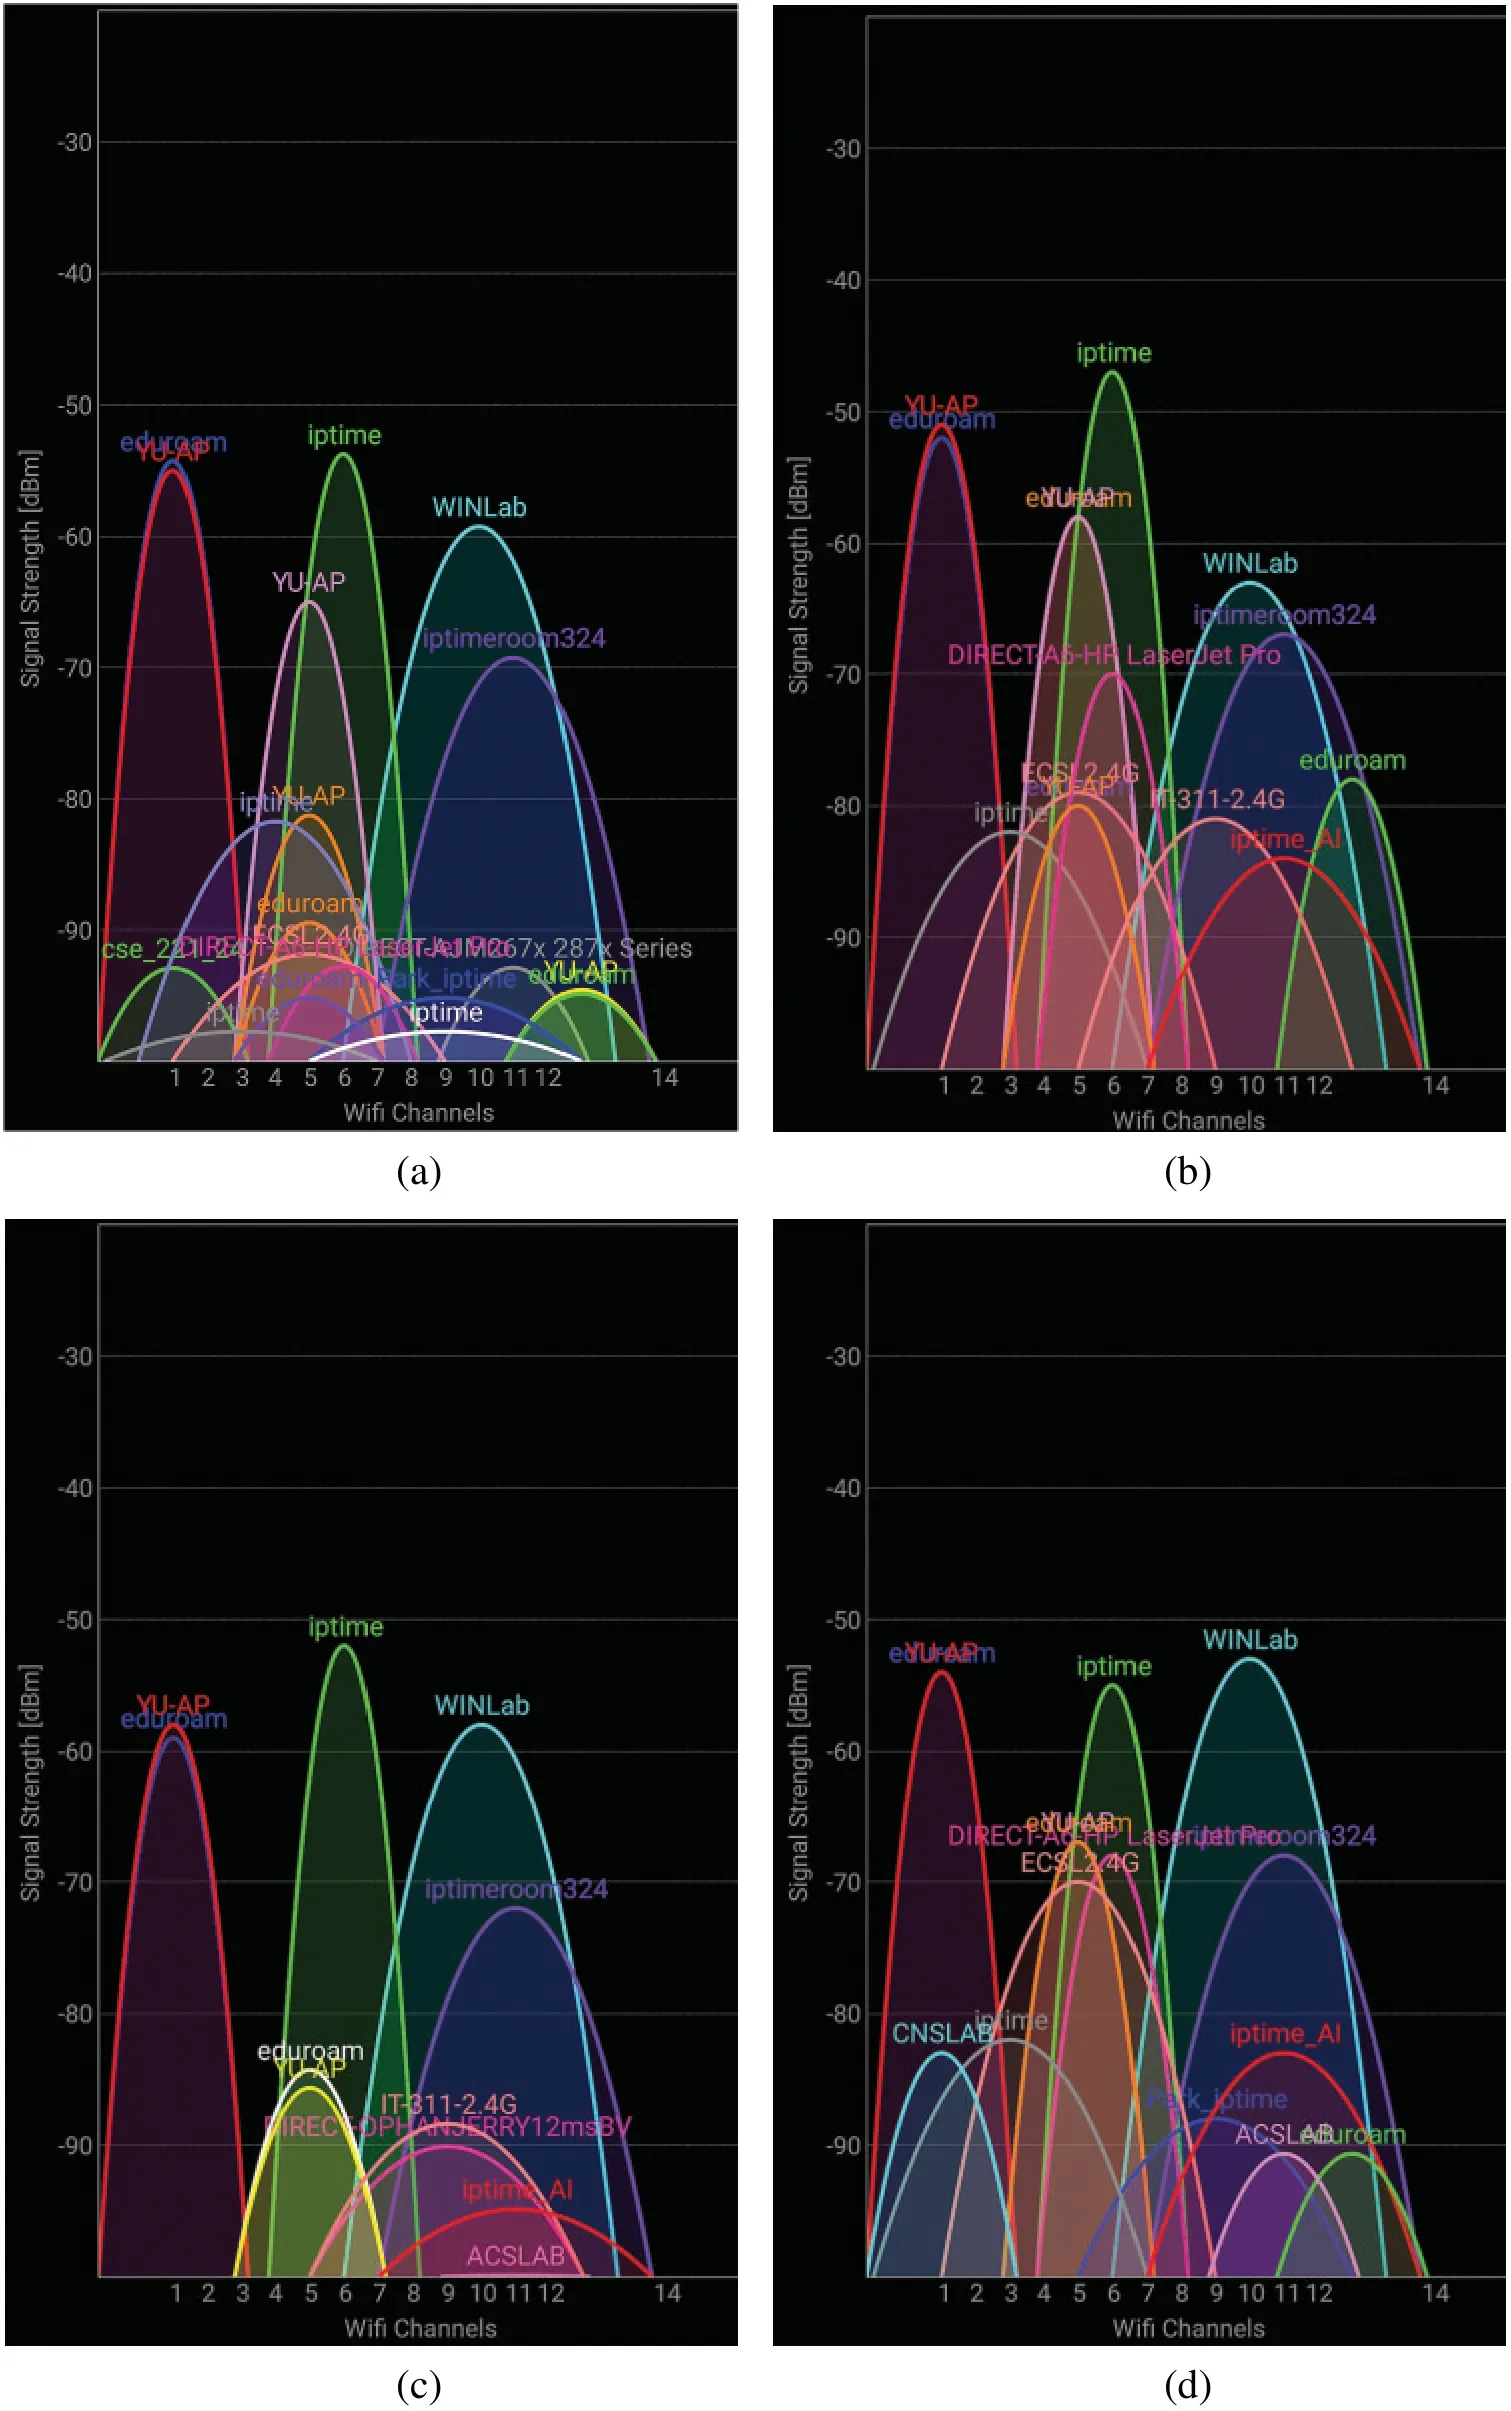
Figure 2: RSS from visible Wi-Fi APs using Galaxy S8 smartphone, (a) Smartphone direction to East, (b) Smartphone facing North direction, (c) Direction of smartphone towards South, and (d)Smartphone facing West direction
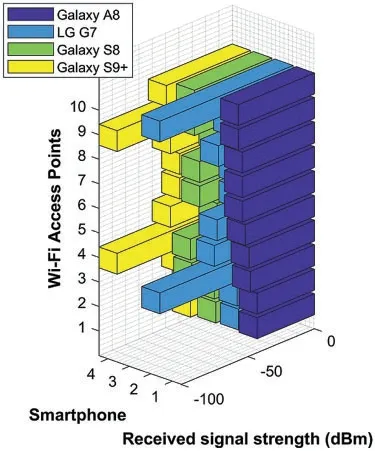
Figure 3: Measured RSS values for visible APs using four different smartphones
The values for the top 10 visible APs with the highest RSS values are shown in Fig.3.A value of -100 indicates that the specific AP is not visible in the scanning zone.The measured RSS values of different smartphones are not the same.Moreover, previous studies showed that the RSS values of different smartphones are not the same and vary significantly [36,37].Predominantly, existing publicly available datasets do not provide data of multiple smartphones, and the performance of the state-of-the-art positioning approaches cannot be appropriately tested.
3 Related Work
Because of a wide interest in the research field and a large range of studies on Wi-Fi positioning, several datasets have been presented and can be divided into two groups: publicly available and restricted access.The former datasets are shared via open online platforms and are free to download, and the former can be available on request or not available at all.Public datasets are important based on two perspectives: first, they are helpful to reproduce the results of approaches presented in the literature, and second, they provide a benchmark to compare the performance of the state-of-the-art approaches.Public datasets are important because they provide the data to carry out analysis of indoor positioning approaches.Moreover, the details of the data collection process, scenarios considered for the data collection, path geometry, indoor environment, and description of users and devices are described which are helpful for other researchers.Therefore, all the publicly available Wi-Fi datasets are examined in this section to discuss their advantages and disadvantages.
The authors present two Wi-Fi datasets for open areas where GPS signals are blocked and positioning cannot be performed using GPS [38].The first dataset contains the RSSI of the available APs for a busy open area called Bush court in Murdoch University.The second dataset,on the other hand, contains auto-generated records of Wi-Fi APs received from the devices of the users in the area.The impact of device heterogeneity can be investigated using the dataset as it collects data from four different android-operated smartphones.Similarly, a Wi-Fi RSSI dataset is presented in [39] containing the data collected over a long period.Data have been collected for 15 months to analyze the impact of the time-related signal mutation.Training and testing data are collected each month to analyze the influence of time over the Wi-Fi RSSI.A single smartphone is used to collect data from a multistory building.
A Wi-Fi dataset, called UTSIndoorLoc, is shared in [40] to test state-of-the-art indoor positioning approaches using Wi-Fi.The data are collected from a 16-story building of the University of Technology, Sydney.The area used for data collection has an area of 44,000 m2, and 1,840 sample points are provided in the dataset.The area contains 589 unique Wi-Fi APs, and the dataset contains 9,107 training samples and 387 test samples.Fingerprinting Wi-Fi positioning approaches collect training samples from the intended area of positioning before the positioning is performed.This phase, known as the training or offline phase, involves wardriving, which refers to the collection of data at designated points separated by 2-5 m.The data are cleaned and processed to develop the fingerprint database.Experienced data surveyors and a substantial amount of time are required to perform the offline phase.Crowdsourcing is an alternative approach to reduce the effort made by the surveyors and involves data collection from the general public.Multiple users can collect data, which are later processed to formulate a single database.A crowdsourcing dataset is provided in [41], and it contains Wi-Fi fingerprints.A multifloor indoor place is used for data collection with an area of 208×108 m2.Eight users collected data using 21 different smartphones running on Android.
In addition to the dataset containing Wi-Fi data, several datasets that contain Wi-Fi, magnetic field, Bluetooth, and inertial measurement unit (IMU) data have been considered.For example,the authors of [42] provided hybrid data called IPIN2016, which contains data of Wi-Fi APs,as well as IMU sensors, including accelerometer, magnetometer, and gyroscope.The data are collected at the University of Alcala, Spain, from an indoor corridor.Training and testing samples are provided separately containing AP names, RSSI, and basic service set identifier (BSSI).The dataset contains RSSI values from 168 unique APs collected in manually marked location points.Similarly, a hybrid dataset containing Wi-Fi and magnetic field data is provided in [43].In addition, IMU data are incorporated to track the walking direction of users and smartphone behavior.The dataset contains the data collected over 6 months using Google Nexus 4 smartphone operating on Android 5.0.1.
The use of smartphones is important to determine user activity for various applications, such as positioning, smart home appliances, and sports.In this regard, a dataset is introduced in [44];it provides the magnetic field and Wi-Fi data from Sony Xperia M2 and LG W110G Watch R.A large indoor area is selected for data collection and includes a complex path geometry.The data of IMU sensors help determine smartphone orientation and track the walking direction of users.The authors propose a hybrid dataset containing data of several positioning technologies,such as Wi-Fi, magnetic field, and Bluetooth, based on the Samsung Galaxy Young GT-S5360 smartphone [45].For data collection, 30 Wi-Fi APs and 9 Bluetooth devices are installed at designated places to cover the positioning area.Data collection is performed in a multifloor building at manually marked location points.
Despite the availability of publicly available Wi-Fi datasets, several important aspects of Wi-Fi data are not covered, e.g., data in a dynamic environment and data using different orientations.A comparative summary of the existing publicly available datasets is listed in Tab.1.The “Dynamicity”column mentions whether the data collection involves various dynamic conditions, e.g., human mobility.“Orientation” and “user” refer to the data collection with multiple orientations of the smartphone and users, respectively.“Time” indicates the coverage of time-related mutation and depletion of RSSI.“Long” in the “Time” column indicates that the data are collected over a sufficiently long period to study the impact of time on the RSSI value.The “Smartphone”column shows smartphones used for data collection; “single” and “multiple” columns indicate that the name of the smartphone company and its model information are not available.
To overcome the limitation of the aforementioned datasets, the current study aims at providing Wi-Fi data involving multiple users and multiple smartphones.Similarly, the data over ~5 years are collected in different multistory buildings with different orientations of the smartphone.
4 Data Collection Process and Scenarios
The dataset is provided to accelerate research for Wi-Fi-based indoor positioning and localization approaches.To this end, the dataset is publicly provided at: https://www.kaggle.com/ashimran/wimest?select=WiFi+dataset and https://github.com/ImAshRayan/Wi-MEST/tree/main.
For data collection, five elements, as described in Section 2, are considered.The detail of how each element is covered for Wi-Fi data collection is described here separately.
4.1 Dynamic Environment with Different Levels of Human Mobility
Owing to the large influence of human mobility on Wi-Fi data, a public place is selected for data collection.Starfield COnvention EXhibition (COEX) has been selected for data collection on a day when a large number of people would be visiting it for an exhibition.COEX is located in Seoul Korea and has an area of 108×106 m2.The following human mobility conditions are considered for data collection:
• Medium human mobility: 50-350 people are present in the COEX center when the data are collected.
• For high human mobility, more than 350 people are present in the hall at the time of data collection.
The data collection is important for the dynamic environment, as the presence of people affects the RSS values mentioned in [46].Similarly, the obstruction of Wi-Fi signals affects the RSS variation and increases the number of positioning errors [18,47].Fig.4 shows the path details used for data collection at points separated by 2 m.The COEX center hall used for data collection is a large hall, which is divided into counters and stalls placed for exhibition.There are no walls in the hall; only a few concrete pillars are placed to support the roof.
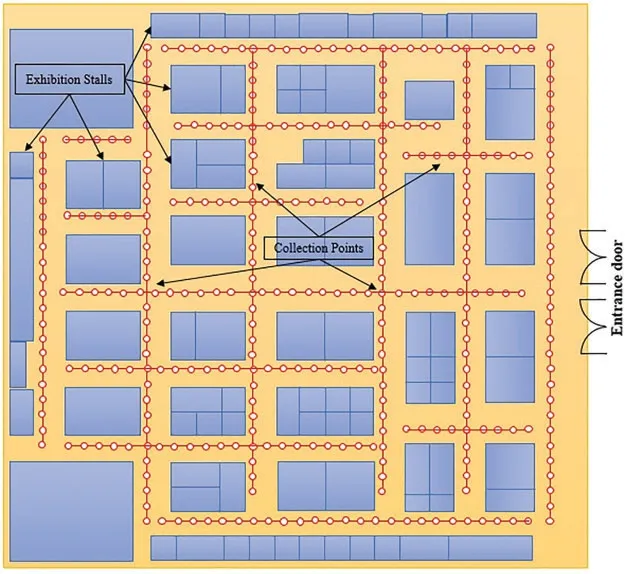
Figure 4: Path geometry used for the data collection in COEX hall
4.2 Orientation of Smartphones for Data Collection
The current study considers three different orientations of the smartphone for data collection.The considered orientations are “navigation,”“call listening,”and “phone swinging.”“Navigation”refers to a walking style where the smartphone is held in front of the user body.For “call listening” mode, the smartphone is placed beside user’s right ear, while the “phone swinging”indicates that the phone is swung on the right side of user-facing downwards.These orientations are selected owing to their common use in daily life.An illustration of how smartphone axes are changed in each orientation is shown in Fig.5.
4.3 User Diversity for Wi-Fi Data
As the height of the user is important to study its influence on the Wi-Fi positioning approaches, four users (males and females) perform data collection.The users have different heights and walking patterns, which consequently change the measured RSS values, even when the data are collected within a short duration.The heights of the data collectors, i.e., three males and one female, are 187, 176, 174, and 168 cm, respectively.
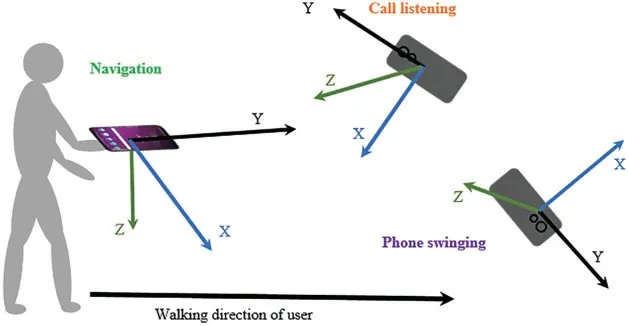
Figure 5: Smartphone orientations used for collecting Wi-Fi data
4.4 Wi-Fi Data Collection Over Long Period
The time-related impact is one of the major problems for Wi-Fi signals; therefore, the data collection has been performed for a longer period of ~5 years, starting from 2018 to 2021.The data are periodically collected over the manually marked location points, known as “ground truth”points.Data are collected over irregular intervals, and training and testing samples are collected.For data collection, the selected places are divided into grids, where the grid points are separated by a 1-m distance to provide high resolution.
4.5 Smartphones Used for Data Collection
Owing to the wide use of smartphones and their influence on Wi-Fi signals, five smartphones have been used for data collection.The selected smartphones have different software and hardware specifications, as well as operating systems.All smartphones are Android-operated, and a detailed description of each smartphone is listed in Tab.2.
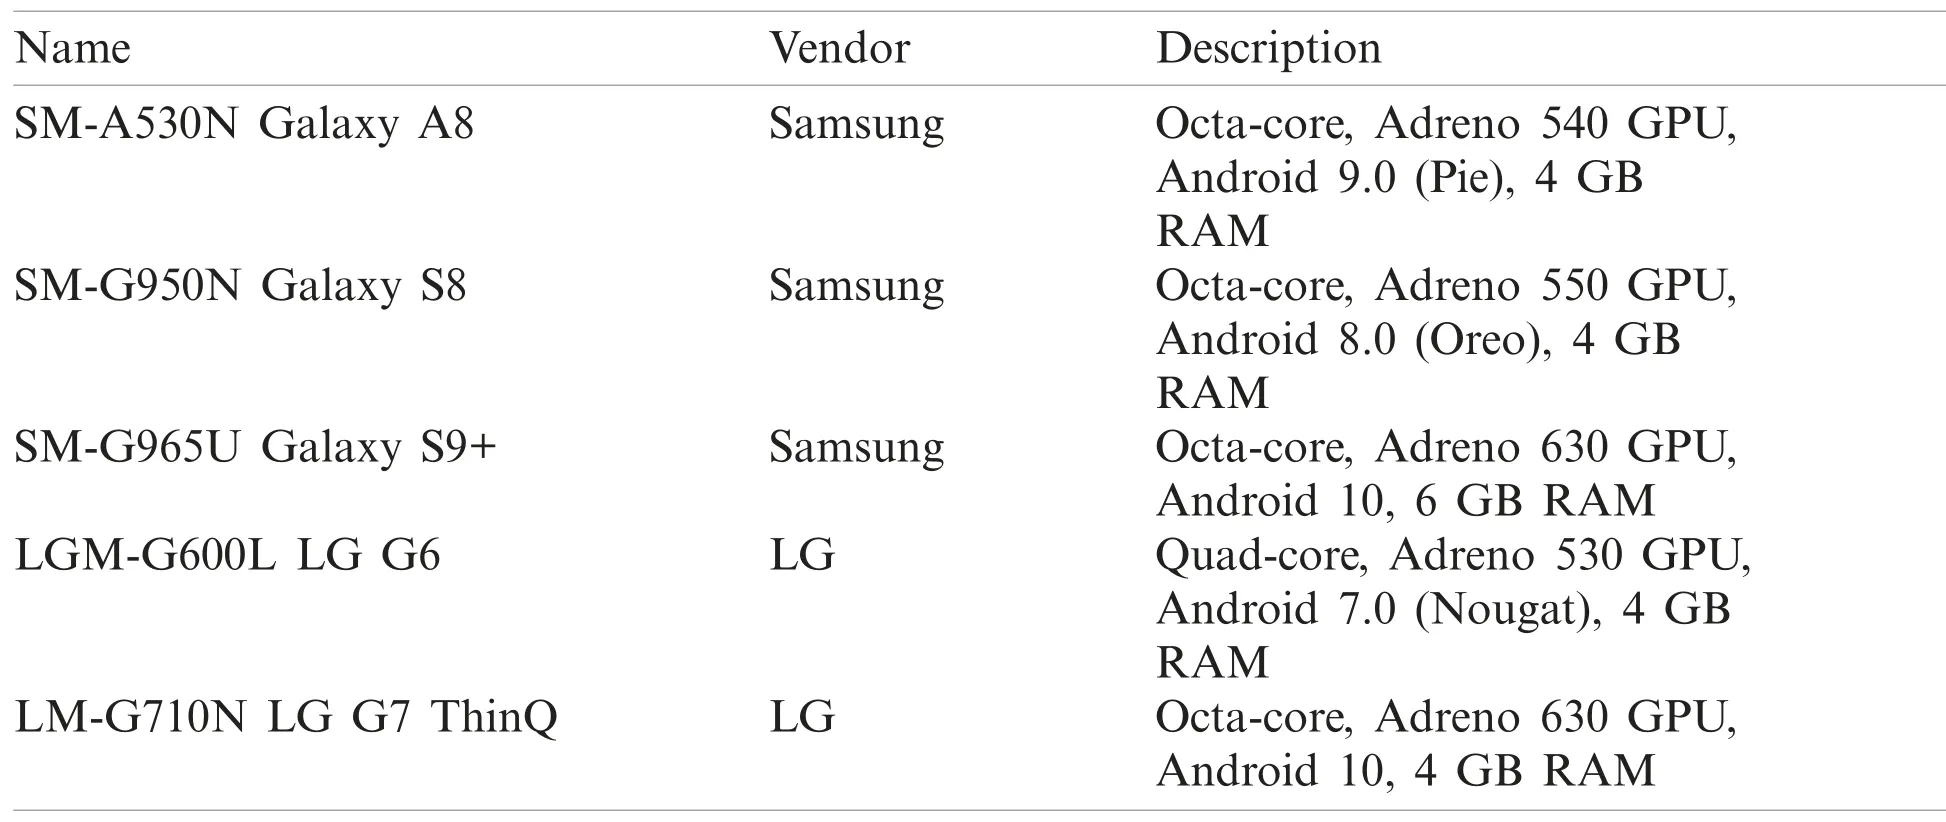
Table 2: Description of the smartphones used for Wi-Fi data collection
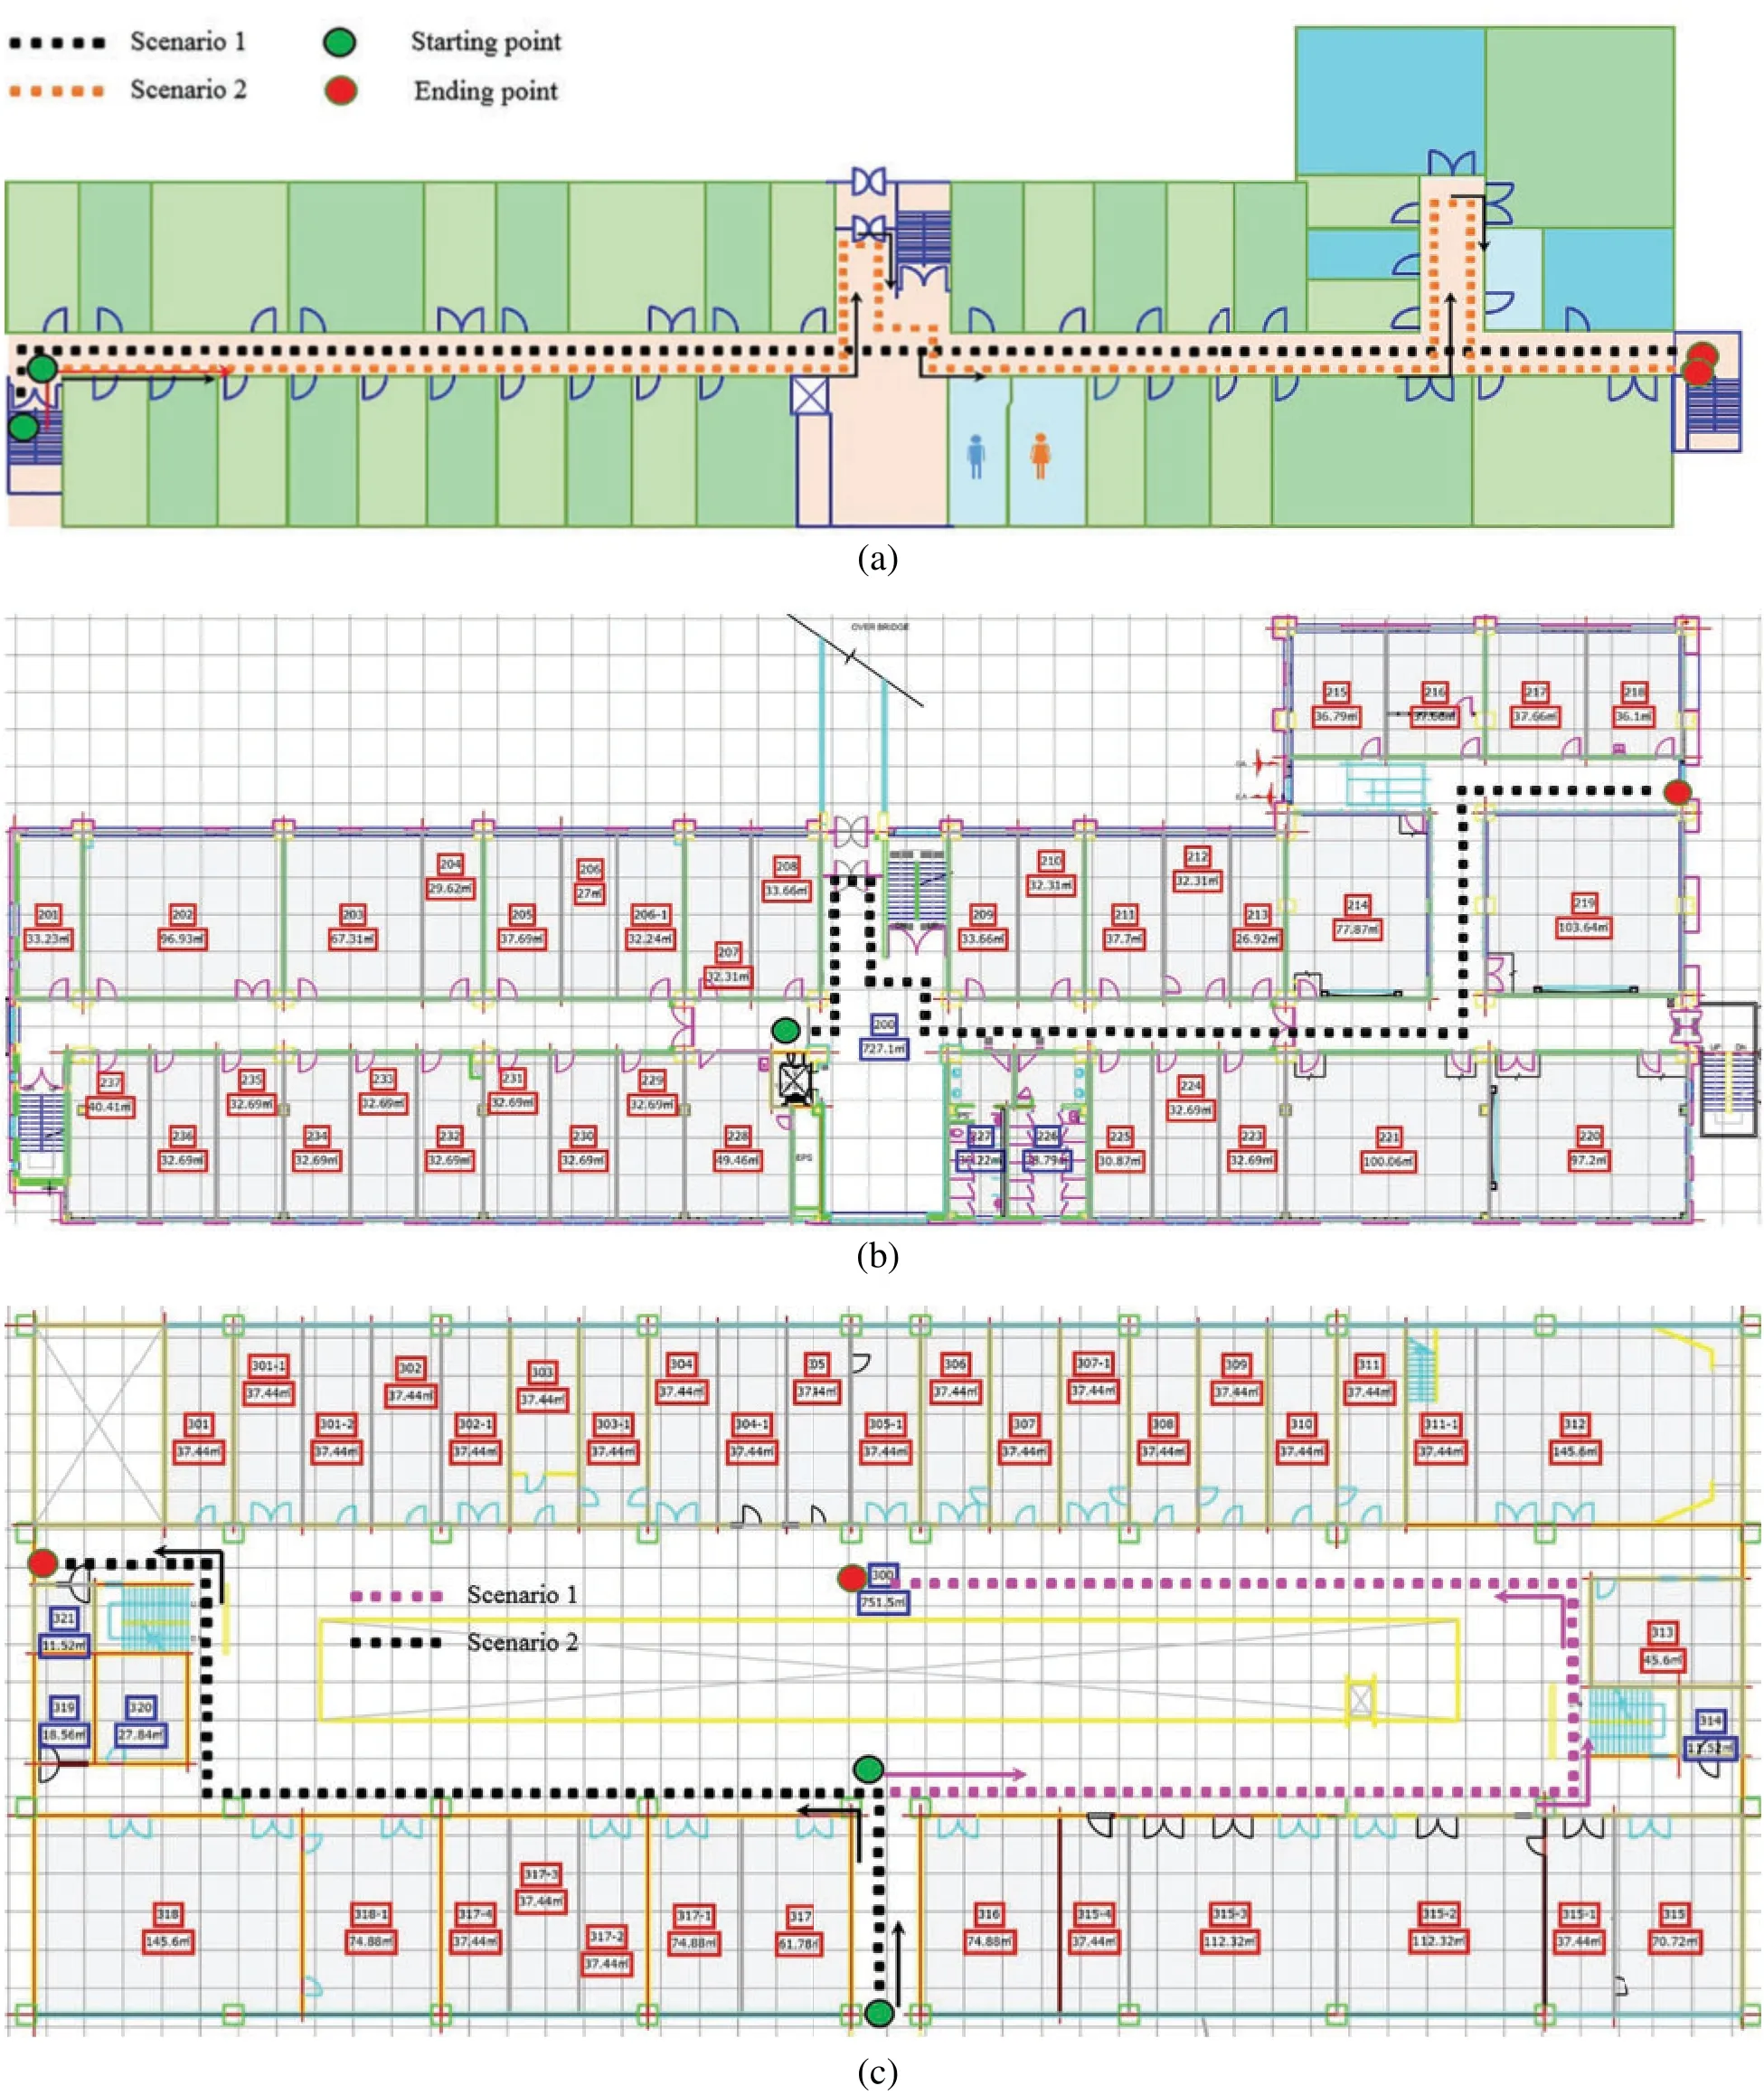
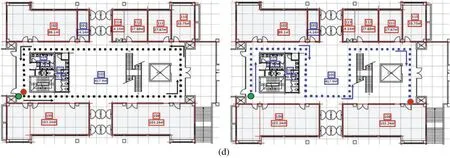
Figure 6: Path geometries followed for data collection in different buildings, (a) IT building, (b)CS buildings, (c) EE building, and (d) BE building.Arrow indicates the walking direction of the user
4.6 Spatial Diversity and Paths Followed for Data Collection
Dimensions of the place used for data collection are important as large spaces tend to show a high number of positioning errors for Wi-Fi-based positioning approaches.Moreover, Wi-Fi signal distribution is different in different buildings, which can affect the positioning performance.As a result, we have considered five different buildings on a university campus, apart from a large exhibition hall.The buildings of information technology (IT), computer science (CS), electrical engineering (EE), regional innovation center (RIC), and business and economics (BE) are selected that have different Wi-Fi Aps, and the distribution of these APs is different.The dimensions of the IT, CS, EE, RIC, and BE buildings are 92×32, 92×34, 90×42, 35×15, and 80×92 m2.The path length depends on various scenarios used for data collection.However, the distances of the longest paths followed in the IT, CS, EE, RIC, and BE buildings are 125, 75, 89, 64, and 109 m, respectively.
Fig.6 shows the paths followed in different buildings for Wi-Fi data collection.Different paths are followed, so that simple and complex paths can be used for positioning performance.Manually labeled points are separated by a 1-m distance.Arrows on the map indicate the walking direction of the user, and green and red circles indicate the starting and ending points, respectively,for data collection.Each smartphone is used to collect data on the designed paths during different days and months of years.
4.7 Data Collection from Uneven Floor Structure
The uneven floor structures of indoor buildings complicate multifloor positioning approaches.The lack of Wi-Fi data for such structures obstructs the testing of such approaches.To overcome this limitation, the current study considers data of a building whose floor structure has irregular floor levels.Five stairs are present on a floor, both ascending and descending, and affect the positioning performance.
Fig.7 shows the path followed in the BE building that has an irregular floor level.The followed path can be divided into two parts.In path one, from the starting point, the path has two descending stairs containing eight steps each, where the height of each step is 13.30 cm.Path two, on the other hand, has three ascending stairs with eight, five, and eight steps, respectively.
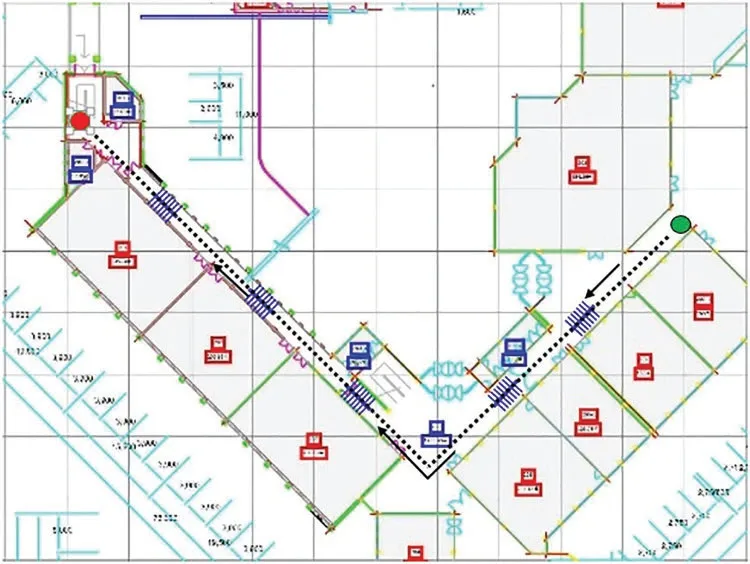
Figure 7: Path followed in BE building with the uneven floor level
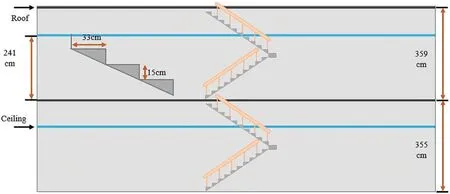
Figure 8: Structure of the stairs used for data collection in a three-story building
4.8 Wi-Fi Data for Stairs
Predominantly, existing publicly available datasets do not provide data for stairs.Consequently, multifloor positioning approaches lack the proper investigation of positioning performance.Similarly, several approaches that focus on user events going up and down cannot be tested using the existing datasets.Therefore, this study considers data of stairs of a three-floor building.Data are collected for both users walking from 1st to 3rd floor and 3rd to 1st floor with the navigation mode.The number of steps in the stairs and the height of the steps are exhibited in Fig.8.
5 Structure of Wi-Fi Dataset
For data collection, five elements as described in Section 2, are considered.The details of how each element is covered are discussed in this section.Fig.9 shows the hierarchical structure of the Wi-Fi dataset.The main folder contains one folder for each building where the data are collected.
5.1 Folder Hierarchy for Wi-Fi Dataset
Under the same folder, a subfolder for the smartphone orientation exists and contains data of that orientation.The conceding folder contains information on the scenarios used for the data collection.Each scenario involves ground truth points for data collection as the path geometry is different for each scenario.For each scenario, five smartphones (Samsung A8, S8, and S9+ and LG G6 and G7) are used for data collection.Under the folder for smartphones, one folder exists for each surveyor or data collector, and four people collect Wi-Fi data.
At the bottom of these folders, data files are stored in the XML spreadsheet (XLSX) format.A specific pattern is followed to name the file, and it is standard for each file stored in the dataset.The name has been assigned in the following format: “Wi-Fi_CS Engineering_Scenario 2_User 2(M-174 cm)_Navigation_2018.02.20 110423.xlsx,” where
Wi-Fi - indicates that it contains the Wi-Fi data,
CS Engineering - indicates the name of the building where the data are collected,
Scenario 2 - indicates the scenario followed for data collection,
User 2 - indicates the user who collected the data.“M” and “F”refers to a male and female,respectively, while the value given in () indicates the height of the data collector,
2018.02.20 110423 - indicates the date stamp in the “yyyy.mm.dd” format followed by timestamp in the “hh:mm:ss” format.
5.2 Details of Excel Sheet for Wi-Fi Data
The file that records Wi-Fi data contains six columns (Fig.10).Column names are “Time,”“X-pos,” “Y-pos,” “SSID,” “BSSID,” and “RSSI,” and the description of each column is given in the following:
“Time”shows the time stamp, including the date and time.when the data were collected.The format for the timestamp is “yyyy.mm.dd hh:mm:ss.”
“X-pos” shows the localxcoordinate of the location point used for data collection.
“Y-pos” shows the localycoordinate of the location point used for data collection.xandyrefer to local coordinates regarding the dimension of the building where the data were collected.
“SSID” refers to the service set identifier and indicates the name of the Wi-Fi AP.
“BSSI”refers to the basic service set identifier and exhibits the unique MAC address of Wi-Fi AP.SSID may be the same for more than one AP; however, BSSID is unique for every AP.
“RSSI” exhibits the measured received signal strength indicator for a particular Wi-Fi AP.The records in the file are sorted based on the RSSI values.
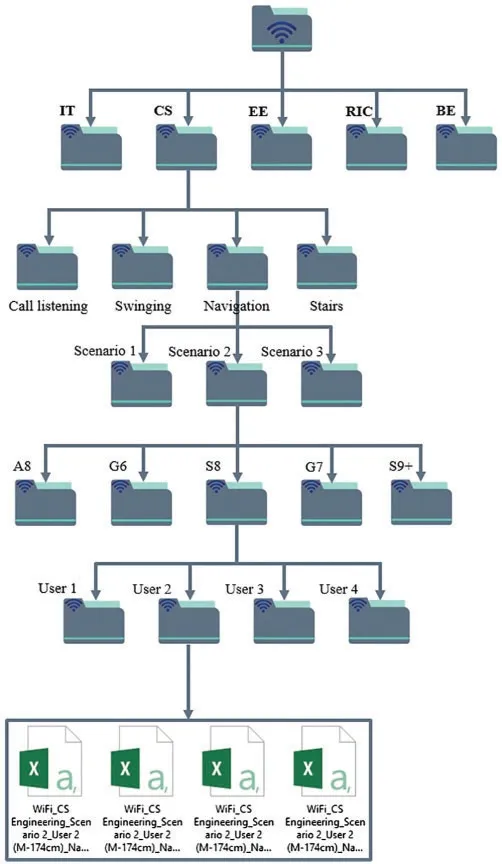
Figure 9: Structure of the Wi-Fi dataset
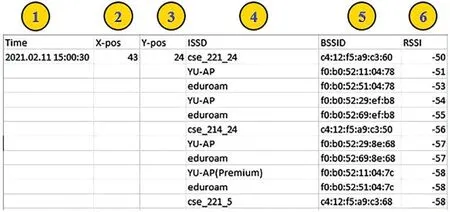
Figure 10: Details for the Wi-Fi data file
6 Discussions and Conclusions
The wide use of smartphones has opened new possibilities for indoor positioning and localization.Specifically, modern smartphones equipped with various sensors such as motion sensors,Wi-Fi, barometers, and Bluetooth; new technologies; and approaches have been presented.For example, over the past two decades, Wi-Fi has been investigated as one of the leading indoor positioning technologies where the existing wireless signals can be used for positioning.
Despite Wi-Fi being one of the most widely used indoor technologies, it has several challenges.Three major issues that remain unresolved for Wi-Fi indoor positioning are device heterogeneity, robustness to signal changes owing to human mobility, and device attitude such as varying orientations.Predominantly, Wi-Fi-based indoor positioning uses fingerprinting solutions, which rely on the RSSI.Smartphone heterogeneity significantly changes the measured RSSI values owing to the sensitivity of the Wi-Fi antennas embedded in smartphones, as well as other hardware and software configurations.
Similarly, dynamic environments owing to human mobility and other factors such as the placement of furniture, change in indoor settings, and temperature variations cause RSSI variations, which affect the performance of the Wi-Fi indoor positioning approaches.Human mobility is a major challenge in solutions where signals are absorbed, shadowed, and scattered by the human body and affect the positioning performance.The complex behavior of users with smartphones is another major challenge for Wi-Fi-based indoor positioning solutions.Change in smartphone orientations modifies RSSI values and affects the performance of positioning methods.The existing methods have not extensively studied these aspects of Wi-Fi positioning as data collection is laborious and time-consuming and requires experienced users to war-drive for data collection.In addition, the lack of publicly available datasets makes it very difficult to properly study the aforementioned aspects.
This study covers the aforementioned aspects by introducing a dataset that contains the Wi-Fi RSSI.First, five important elements of Wi-Fi positioning are introduced: dynamicity, the orientation of a smartphone, user diversity, time-related depletion and mutation of Wi-Fi signals,and smartphone heterogeneity.In light of these elements, data are collected using five different devices, i.e., Samsung Galaxy S8, S9+, A8, LG G6, and LG G7, operated by four surveyors,including both female and male, of different heights.To cover the smartphone orientation issue of Wi-Fi positioning, three orientations of the smartphones are used for the data.
The provided dataset contains data collected from five different buildings with different numbers of APs, different indoor settings, and different path geometries.Three scenarios have been considered to collect data from each building.To cover the floor detection aspect of Wi-Fi, data have been collected from multifloor buildings.In addition, existing datasets do not provide data for stairs, which are covered in the current dataset.The data have been collected moving from floors 1 to 3 andvice versa, so that the user events of “stairs up” and “stairs down” can be studied.
Moreover, the Wi-Fi data have exhibited a large number of positioning errors for uneven floor structures pertaining to floor identification events.For this purpose, the data of a long corridor with an uneven floor structure containing ascending and descending stairs have been considered.For dynamicity, a large public exhibition hall is used for data collection, considering medium and high levels of human mobility.The COEX center has a large hall where we collected the data during an exhibition with 50-500 people moving at a time.To analyze the time-related impact on Wi-Fi RSS, data over ~5 years have been collected.We believe that the dataset provides a great resource for the research community working in the indoor positioning and localization domain to analyze various aspects of Wi-Fi-based indoor positioning and evaluate the performance of state-of-the-art positioning approaches.
Funding Statement:This research was supported by the Ministry of Science and ICT (MSIT),Korea, under the Information Technology Research Center (ITRC) support program (IITP-2020-2016-0-00313) supervised by the Institute for Information & communications Technology Planning& Evaluation (IITP).This research was supported by Basic Science Research Program through the National Research Foundation of Korea (NRF) funded by the Ministry of Science, ICT and Future Planning (2017R1E1A1A01074345).
Conflicts of Interest:The authors declare that they have no conflicts of interest regarding the present study.
杂志排行
Computers Materials&Continua的其它文章
- Spark Spectrum Allocation for D2D Communication in Cellular Networks
- An Optimized Deep Learning Model for Emotion Classification in Tweets
- Swarm-Based Extreme Learning Machine Models for Global Optimization
- Deep Learning Based Intelligent Industrial Fault Diagnosis Model
- Extremal Coalitions for Influence Games Through Swarm Intelligence-Based Methods
- Artificial Intelligence Based Optimal Functional Link Neural Network for Financial Data Science
