Quantifying the impact of mineralogical heterogeneity on reactive transport modeling of CO2 + O2 in-situ leaching of uranium
2022-02-28YunYangWenjieQiuZhengbangLiuJianSongJianfengWuZhiDouJinguoWangJichunWu
Yun Yang• Wenjie Qiu • Zhengbang Liu • Jian Song • Jianfeng Wu •Zhi Dou • Jinguo Wang • Jichun Wu
Abstract CO2 + O2 in-situ leaching (ISL) of sandstonetype uranium ore represents the third generation of solution mining in China. In this study,reactive transport modeling of the interaction between hydrodynamic and geochemical reactions is performed to enable better prediction and regulation of the CO2 + O2 in-situ leaching process of uranium. Geochemical reactions between mining solutions and rock,and the kinetic uranium dissolution controlled by O2 (aq) and bicarbonate ( HCO-3) are considered in the CO2 + O2 ISL reactive transport model of a typical sandstone-hosted uranium ore deposit in northern China.The reactive leaching of uranium is most sensitive to the spatial distribution of the mineralogical properties of the uranium deposit. Stochastic geostatistical models are used to represent the uncertainty on the spatial distribution of mineral grades. A Monte Carlo analysis was also performed to simulate the uranium production variability over an entire set of geostatistical realizations. The ISL stochastic simulation performed with the selected geostatistical realizations approximates the uranium production variability well. The simulation results of the ISL reactive transport model show that the extent of the uranium plume is highly dependent on mineralogical heterogeneity. The uncertainty analysis suggests the effect of uranium grade heterogeneity was found to be important to improve the accurate capture of the uncertainty. This study provides guidance for the accurate simulation and dynamic regulation of the CO2 + O2 leaching process of uranium at the scale of large mining areas.
Keywords In-situ leaching · Reactive transport ·Heterogeneity · Stochastic geostatistical model · Monte Carlo analysis · Uranium grade
1 Introduction
Uranium roll-front deposits are created by the groundwater transportation of dissolved U+6in an oxidized fluid, with subsequent mineralization upon interaction with reducing agents (Johnstone et al. 2021). In-situ leaching (ISL),which represents the reverse process of mineralization,has received much attention in recent decades due to its significant advantages over conventional mining methods,especially for mining low-grade sandstone-hosted ore deposits. In ISL, leaching solution is injected into the deposit where it contacts the ore. The reactive solution bearing the dissolved ore content is then pumped to the surface and the ore content is recovered from the solution.The total uranium mass extracted with ISL is expected to reach more than 90% in the future (IAEA 1987, 1992, 2016). CO2+ O2ISL of sandstone-type uranium ore represents the third generation of solution mining in China.In CO2+ O2ISL,a chemical solution of O2(aq)and CO32-is injected into well confined and permeable sandstone aquifer to modify the oxidation–reduction conditions of the deposit; this chemical solution provides an oxidizing agent to oxidize reduced uranium (UO2) to the U+6state and a complexing agent to form stable complex ions with soluble U+6, such as uranyl dicarbonate ions[UO2(CO3)2–2], and uranyl tricarbonate ions [UO2(-CO3)3–4] (Su et al. 2016, 2020; Su 2017).
Understanding and modeling the uranium leaching process is very complex due to the various chemical reactions occurring between the circulating solution pumped/injected into the aquifer and solids (uranium ore minerals), the thermodynamic and kinetic reactions, and the complexity of being able to couple the hydrodynamic transport and chemistry (Sadykov 2019). Reactive transport modeling has been identified as an important tool to quantify the leaching processes, evaluate remediation techniques, and guide mining management (Steefel et al.2015; Musa et al. 2018; Duan et al. 2020; Zhang et al.2020). Panfilov et al. (2016) developed an asymptotic analytical solution of a one-dimensional(1D)flow problem with several detrimental chemical reactions. Simon et al.(2014) calibrated the geochemical reaction paths and kinetic laws with the geochemical code CHESS based on batch experiments and simulated the 1D hydrogeochemical transport mechanism during the ISL process with the coupled hydrodynamic and geochemical code HYTEC based on column experiments. However, studies on the coupled 3D reactive transport for industrial use at the field scale of production units are still scarce. Lagneau et al.(2019) performed simulations using the HYTEC code on the Katco acidic ISL mine. Qiu et al. (2021) first applied the TOUGHREACT code to simulate CO2+ O2neutral leaching of uranium in the Qianjiadian mine of Songliao Basin, China, and the results of the parameter sensitivity analysis show that the volume fraction of UO2in uranium ore is the most sensitive factor affecting the leached uranium concentration. Besides, if a uniform distribution of uranium minerals is assumed, mineralogical heterogeneity can cause significant errors in uranium concentrations prediction.
Mineralogical property measurements have been performed using imaging techniques, such as scanning electron microscopy and interpreting logging data (Liu et al.2017). However, irrespective of how many measurements are obtained, there will still be a lack of data to precisely estimate the mineralogical properties of ore bodies. Qiu et al (2021) stated that the shape of the total production curve of leached uranium was adjusted correctly using a single realization of the deterministic model if the uranium was spread evenly in the block. However, the shape of the production curve in a single pumping well would have a large fitting error,even with moderately altered parameters.In his study, the spatial variability of the uranium grade was the key to controlling the spatial distribution of the concentration of the leached uranium. More recently,similar studies have been performed in the reactive transport domain. Langanay et al. (2018, 2021) provide some insights into the impact of geological uncertainty on simulated uranium leaching. Liu et al. (2017) investigated the impact of mineralogical heterogeneity of rocks in porescale reactive modeling considering multi-mineral reactions.However,it is also essential to quantify the impact of mineralogical heterogeneity on the reactive transport modeling of CO2+ O2ISL during uranium production.
Previous reactive transport modeling of ISL is limited to the deterministic simulation of acidic leaching processes or solely considering hydrogeological uncertainty on uranium production (Dinwiddie et al. 2012; Boissezon et al. 2020).This study focuses on the uncertainty related to mineralogical heterogeneity in terms of uranium grade,while the hydrogeological uncertainty of the parameter variability is deemed constant. The uncertainty regarding the quality of uranium grades of a typical sandstone-hosted uranium ore deposit in northern China can be represented by many geostatistical realizations obtained by stochastic simulations. In this study,the ISL process of a typical sandstonehosted uranium ore deposit in northern China was simulated using the TOUGHREACT code, which couples physio-chemical processes involving groundwater flow,transport,and chemical reactions in porous media. An ISL stochastic simulation was then carried out with the selected geostatistical realizations to correctly predict the uranium production variability.
2 Methodology
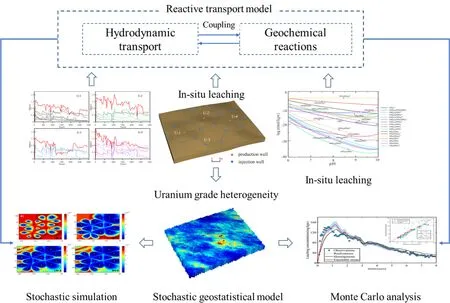
Fig.1 Methodological framework of the reactive transport modeling of the CO2 + O2 ISL of uranium considering mineralogical heterogeneity
This study aims to quantify the impact of the spatial variability of the mineralogical properties of a uranium deposit on the CO2+ O2ISL process of uranium-based on the well-documented reactive transport model. The methodological framework developed in this study includes the following stages as shown in Fig. 1. We first developed a multi-component reactive transport model based on the TOUGHREACT code to model the coupled physiochemical processes; actual monitoring of pumping/injecting liquid volume and water chemistry data periodically recorded during the process of long-term ISL of uranium at the scale of production units.Then,variogram analysis was performed using logging data from densely-drilled exploration holes to determine the variability of heterogeneous uranium grades. Finally, a well-calibrated stochastic reactive transport model was developed to quantify the intrinsic mineralogical uncertainty with multiple conditional realizations using a geostatistical model. To quantitatively measure the intrinsic mineralogical uncertainty, we used Chebyshev’s inequality method,which incorporated all the stochastic realizations in the context of the expectation and variance of the concentrations of the leached uranium.
2.1 Characterizing the heterogeneity of the uranium minerals
Spatial distribution in uranium grades can be highly heterogeneous and it has a significant impact on the ISL of uranium.Geostatistics is used widely to generate stochastic random fields for characterizing this heterogeneity.
Variograms are routinely implemented to analyze the spatial variability of geological domains with categorical and/or continuous variables,e.g.lithofacies in an aquifer or mineralogical domains in an ore body (Emery and Robles 2009; Oualid et al. 2019). Variance function models are very useful in representing the spatial correlation of regionalized variables. For instance, when investigating a variable Z at sample location x, the semi-variogram γ(h )reflects how the dissimilarity between Z(x) and Z(x + h)changes with separation h; the theoretical expression is given as follows:

where Z(xi)and Z(xi+h)are sample values at locations xiand xi+h separated by a vector h,θ is the angle along point xiand xi+ h, N(h, θ) is the total number of sample pairs with the lag interval h.
In general, the basic important properties of the semivariogram(but not necessarily in all cases)include the:(1)nugget effect, which contains information regarding the error of the sampling and the analytics,(2)the sill,which is equal to the variance for stationary processes that correspond to zero correlation; and (3) the range, which is by definition the distance within which the samples influence each other(Webster and Oliver 2008)and outside of which they are quasi-independent (Chile`s and Delfiner 2012).This distance (range) determines the average area of influence surrounding the sample locations, within which the measured values of the explored variable are interconnected (Tra´sy 2018).
2.2 Reactive transport modeling
2.2.1 Mathematical formulations
In this study, the reactive transport simulation was implemented using the TOUGHREACT code (Xu et al. 2014),which is a generalized multi-species reactive geochemical transport code developed by introducing reactive chemistry into the framework of the existing multi-phase fluid and heat flow simulator TOUGH2 (Pruess et al. 1999). The basic mass and energy balance equations are governed by

where Vndenotes the volume of discretized elements,which are bounded by the closed surface Γnand n is a normal vector on surface element dΓnpointing inward into Vn. The quantity M represents mass or energy per volume,F denotes mass or heat flux, and q is sinks and sources.TOUGHREACT uses an integrated finite difference method for spatial discretization, and a sequential iteration approach to sequentially solve the transport and reaction equations. In this study, we only implemented its equation of state EOS9,represented by the variably saturated flow of a single aqueous phase; the governing equations for fluid flow and chemical transport are given by

where u is Darcy velocity (m/s);k is absolute permeability(m2);kris relative permeability(m2);μ is viscosity;P is the pressure gradient (Pa); g is gravitational acceleration (m/s2); In Eq. (5),Mj=φSCjφ is porosity; S is liquid phase saturation, Cjrefers to the concentration of the aqueous chemical component(mol/L),Fj=uCj- (τφSD)∇Cj,τ is porous medium tortuosity; D is the diffusion coefficient(m2/s); qjis the source and sinks.
2.2.2 Chemical reactions
In recent decades, extensive research has been conducted primarily regarding the mineralization processes of sandstone-type uranium deposits (Yue et al. 2011; Zhao et al.2018;Jia et al.2020),where the CO2+ O2in-situ leaching uranium represents the reverse process of mineralization.The key hydrogeochemical factors including major ion composition, alkalinity, pH, redox conditions, and hydrodynamic conditions have a major influence on the water–rock interaction system associated with uranium dissolution and migration, and thus affecting uranium recovery.The CO2+ O2leaching system,where uranium is prone to soluble and transport under oxidizing and neutralweakly conditions, involves the injection of leaching solutions with O2(aq) as the oxidant through injection wells and the inorganic carbon promotes the release of adsorbed U+6from the Uranium-bearing mineral. Within the deposit, uranium is converted from the relatively insoluble tetravalent form of U+4into the water-soluble hexavalent form of U+6under oxidizing conditions,mainly exists as uranyl-carbonate complexes of UO2(CO3)2-2 and UO2(CO3)4- 3; then the dissolved uranium is recovered through production wells and treated in surface plants(Langmuir 1978; Regnault et al. 2012; Asghar et al. 2020;Su et al. 2020). The principal geochemical reactions between mining solutions and minerals as well as the host rock include oxidation and reduction, dissolution and precipitation, and aqueous complexation, among others. The dissolution of uraninite (UO2) during CO2+ O2ISL processes follows the principal reactions described in Eqs.(6)–(9)

According to previous studies, the oxidative dissolution of uraninite (UO2) to U+6has been important to understand uranium mobility from uranium ores (Eqs. (7)). In practice the oxidative dissolution mechanism of U for the processes proceeding during uranium in-situ leaching from the ores can be illustrated by several processes including three main steps: oxidation of the uranium dioxide solid surface, surface complexation of U+6by HCO3-, and detachment of the surface complex formed. Some preliminary studies of this this aspect of mechanism are reported in Refs. (Torrero 1997; De Pablo et al. 1999; Gimenez2005). The geochemical conceptual model of the ISL of uranium mainly consists of 11 primary aqueous species(i.e. Na+, Mg2+, HCO3-, Cl-, O2(aq) and UO22+ions, etc.)and a total of 40 secondary aqueous complexes and their equilibrium constants including uranyl ions, which are listed in Table 1. Geochemical networks experience multiple water–mineral reactions involving aqueous species complexation and a suite of mineral dissolution/ precipitation reactions.

Table 1 Aqueous complexes related to the primary species of uranyl ions (UO22+) and their equilibrium constants at 25 °C
The sandstones in the uranium ore-bearing aquifer are moderately and poorly sorted with many mudstone interlayers; they are composed of homogeneously distributed quartz-rich sandstone, and quartz accounts for 68.4 vol.%.The remaining minerals, in order of increasing abundance,are dolomite, muscovite, calcite, ankerite, K-feldspar, and Na-feldspar by analysis of the lithologic samples (Rong 2014). The ISL of uranium involves the injection of an oxidant and leaching solution into mineralized strata.Uranium dissolution during CO2+ O2leaching is dominated by the oxidation of uraninite by O2(aq) in the leaching solution.
In the following mass balance reactions were used to describe bicarbonate-promoted oxidative dissolution of uraninite (UO2):

The dominant reactions for uranium dissolution and precipitation have been described by the general kinetic transition state theory (Lasaga 1984). The values of the most relevant kinetic parameters of the predominant minerals are summarized in Table 2.The geochemical reaction of the oxygen (O2(aq)) and bicarbonate (HCO3-) assisted kinetically-controlled oxidative dissolution of uraninite is based on the following well-documented mineral precipitation and dissolution reaction (Qiu et al. 2021).

where rnis the reaction rate of mineral dissolution and precipitation reactions in moles/kgw/s, Amis the specific reactive surface area per kg of water, k1and k2are the temperature-dependent rates considering the effect of O2and HCO-3on mineral precipitation and dissolution reactions in moles/m2/s, Q is the corresponding ion activity product,and Keqis the equilibrium constant of the reaction.
2.3 Uncertainty analysis
Predicting uranium concentrations through a reactive transport model of CO2+ O2ISL of sandstone-type uranium ores is uncertain due to the spatial variation of the uranium grade. To precisely predict the behavior of dynamic uranium recovery under field-scale conditions, it is necessary to quantify how the inherent uncertainty of the uranium grade affects the ISL process of uranium.
In this study,the Monte Carlo(MC)method was applied to analyze the uncertainty of the uranium grade in the reactive simulation model based on multiple equally plausible candidate realizations of the fields. Based on the MC method,the uncertainty analysis can be summarized in the following three main steps: (1) determine the probability distribution of random variables and the feasible domain, (2) sample a certain number of random variables in the feasible domain of the random variable using a geostatistical model, and (3) implement stochastic simulations with the selected geostatistical realizations tocorrectly measure the uranium production variability. The statistic characteristics of the output concentration results,such as the mean, variance, and confidence interval, were calculated by statistical analysis. In this study, we utilize all realizations of uranium grades assuming that the variability in the reactive transport results from the stochastic MC simulations falls within the uncertainty associated with the well-calibrated reactive transport model. Finally, Chebyshev’s inequality method was applied to quantify the uncertainty of the interval of the prediction.

Table 2 Major minerals in uranium ores and their kinetic parameters used in reactive transport simulations
Chebyshev’s inequality characterizes the dispersion of data away from its mean(average).Let X(integrable) be a random variable with finite expected value μ and finite non-zero variance σ2. Then for any real number k >0,

Chebyshev’s inequality then states that the probability that an observation will be more than k standard deviations from the mean is at most 1/k2.
3 Case study implementation
3.1 Study area
CO2+ O2in-situ leaching system on uranium recovery has been performed at the Qianjiadian uranium deposit,Songliao Basin, northern China, for nearly ten years. The sandstone-hosted uranium ore body mainly occurs in the Upper Cretaceous formation at a burial depth of 212–315 m; this formation is primarily composed of red and grey thick-bedded sandstones with a few thin-bedded mudstones (Rong et al. 2020). The uranium orebodies which are tabular and lenticular, are mainly controlled by the interlayer oxidation zone (Yang 2020). From the hydrogeological perspective, the uranium ore-bearing aquifer is dominantly composed of fine to medium-grained sandstones characterized by permeability, that are vertically adjacent to mudstone interlayers that function as aquitards (Fig. 2a) (Zhao et al. 2018). In general, the thickness and grade of the uranium ore body vary considerably near the frontline of the interlayer oxidation zone.The groundwater chemical type in the ore-bearing aquifer is mainly HCO3-Na and HCO3·Cl-Na, and it has a pH between 7 and 8, which can facilitate uranium mobility.
The modeled production units consist of a total of 4 production wells and 16 injection wells distributed in a seven-spot well pattern, and the distance between the production and injection wells is 30 m. During the operation of the wells, time-varied flow rates are controlled on each well to maintain the integrity of the hydrodynamic conditions.
3.2 Numerical model set-up
In this study, a 3D reactive transport model was built to represent the mineable uranium-bearing layer at 200 m depth as shown in Fig. 2b. Realizations of heterogeneities in the mineralogical Uraninite generated by each of the stochastic simulation models were coupled into the existing framework of TOUGHREACT.The modeling domain was set to 260 m long and 250 m wide; we also used an orthogonal grid with x- and y- directions rotated 25°counterclockwise from the north direction.Model discretization was the same as that of the geostatistical models. The model domain was divided into 8610 regular grids,and the hydraulic conductivity was assumed to be homogeneous and isotropic in the model domain.

Fig. 2 The uranium deposit for ISL, a hydrogeological profile of the uranium ore-bearing aquifer, b schematic representation of the 3D geological model domain

Fig. 3 Change in well rates from injection and pumping wells in four ISL units, a U-1, b U-2, c U-3, and d U-4
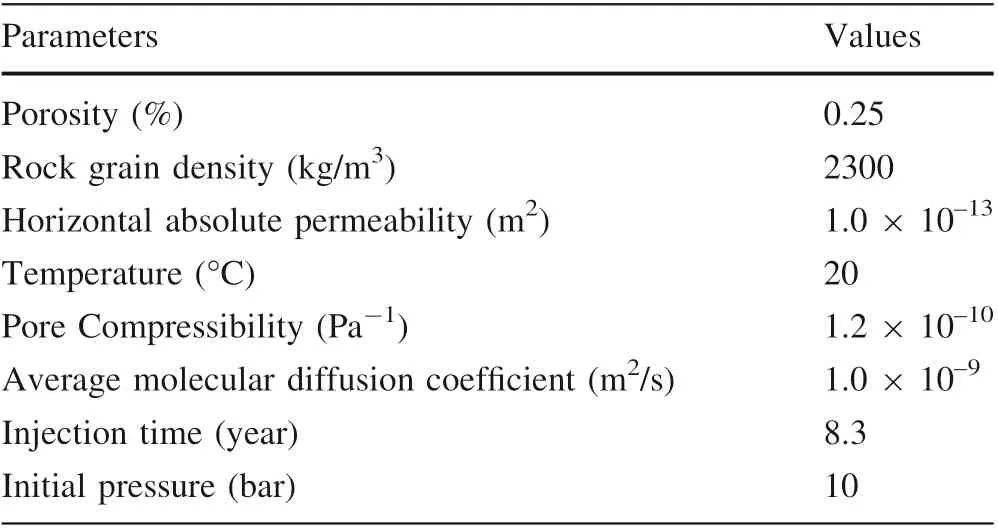
Table 3 Hydrogeological properties used in the simulation model
The variable flow rates of both the production and the injection wells obtained from historical records (shown in Fig. 3) were incorporated into the numerical model. The simulation time, which spans a period of 8.3 years, was covered by an adaptive time step △t ranging from 1 day to 1 month.Specified heads were assigned to the surrounding boundaries. The key hydraulic parameters of the flow and the solute transport model are presented in Table 3,and the initial concentrations of the major aqueous chemical species in the ore-bearing aquifer defined in the reactive transport model are listed in Table 4.
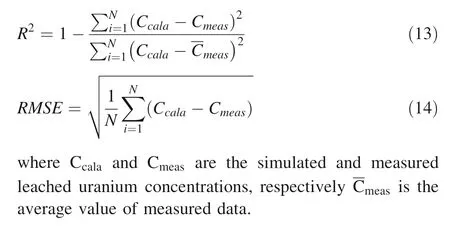
The model calibration was manually performed through the trial-and-error method, and the fitting goodness ofleached uranium concentration was evaluated in terms of the coefficient of determination (R2) and the root-meansquare error (RMSE). The performance criteria were obtained as follows:

Table 4 Initial concentrations of the major aqueous chemical species and pH in the orebearing aquifer
3.3 Uranium mineral heterogeneity
3.3.1 Uranium grade dataset and geostatistical analysis
The existing geological exploration data of the sandstone type uranium deposits were compiled and data from 78 geological drill holes were obtained in this area; the minerals are heterogeneously distributed in a clay-rich zone in the host sandstone, and the spatial distribution of the uranium grade is shown in Fig. 4a. The uranium grades were analyzed statistically to obtain the basic statistical characteristics of the data, and the histogram of the frequency distribution of the uranium grade is shown in Fig. 4b. The n = 78 measured uranium grade values around the mining area range from Xmin= 0.01 to Xmax= 0.06 wt.% with a mean value of m = 0.02 wt.%, a variance of σ = 0.01 wt.%, and the coefficient of variation CV = 0.45.

Fig.5 Fitting of the modeled spherical semi-variogram(solid line)to the experimental semi-variogram for conditioning points (dashed lines and circles) along the horizontal direction
3.3.2 Variogram analysis
Variogram analysis was performed to estimate the spatial autocorrelation lengths of geological media such as discrete hydraulic conductivity values. Horizontal variograms of the uranium grade were fitted with a spherical model.The experimental semi-variogram in the horizontal direction was calculated using 5 lags at a lag spacing of 10.The model is shown in Fig. 5 and the experimental spherical variogram was adjusted with a nugget contributing 4% of the total sill and one spherical structure with a range of 95 m horizontally.
Geostatistical modeling of the uranium grades was first decluttered using the cell method; then, the original grade data was transformed into grade data into normal scores accounting for decluttering weights. Finally, the experimental semi-variogram was fitted with a nested model composed of a nugget effect and spherical structures. The following semi-variogram(Eq. 13)for uranium grades was then obtained. In the below expression, the distances in brackets correspond to the practical ranges along with the main anisotropy directions.
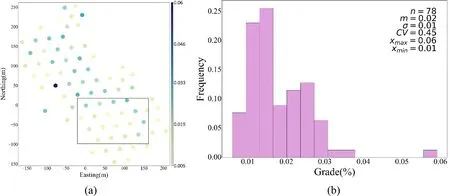
Fig.4 a Map of the ISL site showing the location of the 78 drill-holes from which data were collected for statistical analysis of uranium grades,the framed area indicates the reactive transport model domain; b the frequency distribution and descriptive statistics of the uranium grade estimates
The experimental semi-variogram grade values (Fig. 5)were fit with a zonal anisotropy model from the horizontal semi-variogram that is expressed as:

where h is the semi-variogram value for a lag distance,c is a positive contribution to the variance, and a is the direction-dependent range (95 m).
4 Results and discussion
4.1 Uranium mineral heterogeneity
First, the heterogeneity of the uranium grade was stochastically simulated through the variogram analysis.Sequential Gaussian Simulation (SGS) was employed to conditionally generate the realizations with a random distribution of uranium grade within the modeled region at a 2 × 2 × 1 m resolution.The grade fields were conditioned to the data collected from the 78 boreholes drilled at the production units. Figure 6 displays the 2D perspective view of the SGS single realization and four selected conditional realizations of the uranium grades, respectively.The uranium grades of the generated random field ranged from 0.01 wt.% to 0.051 wt.%, and the SGS realizations honor the spatial structure of the grade and are consistent with the available data.

Fig. 6 Four selected conditional realizations of the Uraninite grades(UO2(%));the upper image is the domain of the entire collected data,and the lower clipped domain is the reactive transport model range
4.2 Stochastic reactive transport during the leaching process
We selected two scenarios to examine the effects of heterogeneities in the uranium grade and the associated influences on the CO2+ O2ISL of the uranium. The two scenarios are the homogeneous case and the heterogeneous case taking into consideration of the mineralogical heterogeneity. The simulation results of the leached uranium concentration validated based on 100 conditional simulations were compared with actual observed data.Reactive transport simulations using TOUGHREACT were performed for each grade realization to represent a longterm ISL uranium exploitation scenario.
Figure 7 shows the dynamic evolution of the uranium concentration in the leachate of the deposit during in-situ recovery. As can be seen, both the scenarios successfully reproduced the behavior of the dynamic uranium recovery;it is worth noting that the spatial variability of the uranium grade was the key to control the distribution of the leached uranium concentration and thus trigger the uncertainty on the predicted uranium recovery.
To further illustrate the effect of the heterogeneous uranium grade results on the dynamic leaching of uranium,the model’s performance was evaluated using the coefficient of determination(R2)and the root mean squared error(RMSE) as defined in Sect. 3.2. Notably, the results from different (uniform and random) grade fields can lead to different leaching behavior. A comparison between the observed values of the leached uranium concentrations and two reactive transport simulation values (i.e., the homogeneous and ensemble mean) in the sum of all the production wells and the four production wells during the entire duration of exploiting are shown in Figs. 8 and 9. It is obvious that the uncertainty of the spatial variability of the uranium grade significantly affects the prediction of the leached uranium concentration and the uncertainty interval tends to become smaller as time changes; this may be due to the combined effect of hydrodynamics and mineralogical heterogeneity. As for statistical metrics, the R2and RMSE of the simulated leached concentrations of uranium representing the uranium heterogeneity scenario were 0.91 and 11.20 mg/kgw, respectively; they outperformed those of the homogeneous scenario (R2of 0.85, and RMSE of 13.79 mg/kgw). The ensemble mean U+6leached concentrations for 100 realizations of uranium grade in the four production wells are shown in Fig. 9; the R2of the production wells in Units U-1, U-2, and U-4 were 0.81,0.66,and 0.88,and the RMSE was 6.30,8.14,and 3.92 mg/kgw,respectively,and these results are superior to those in the homogeneous case. For the homogeneous case, the peak leached concentrations in the four production wells are similar to each other due to the spatially uniform distributed grade, which also reflects on the spatial leaching concentration distribution, as shown in Fig. 7. In contrast,the simulated peak leaching concentration in the heterogeneous case agrees better with the observed concentration than the results from the homogeneous case as shown in Figs. 8 and 9.The results indicate that the spatial variation of mineral composition significantly influences the peak leaching concentration.

Fig.7 Spatial distribution of the leached uranium concentration(C(U+6))of the deposit at 100 d,300 d,and 1000 d for the a homogeneous grade case and b the heterogeneous case; white points indicate injection wells and the crosses indicate production wells
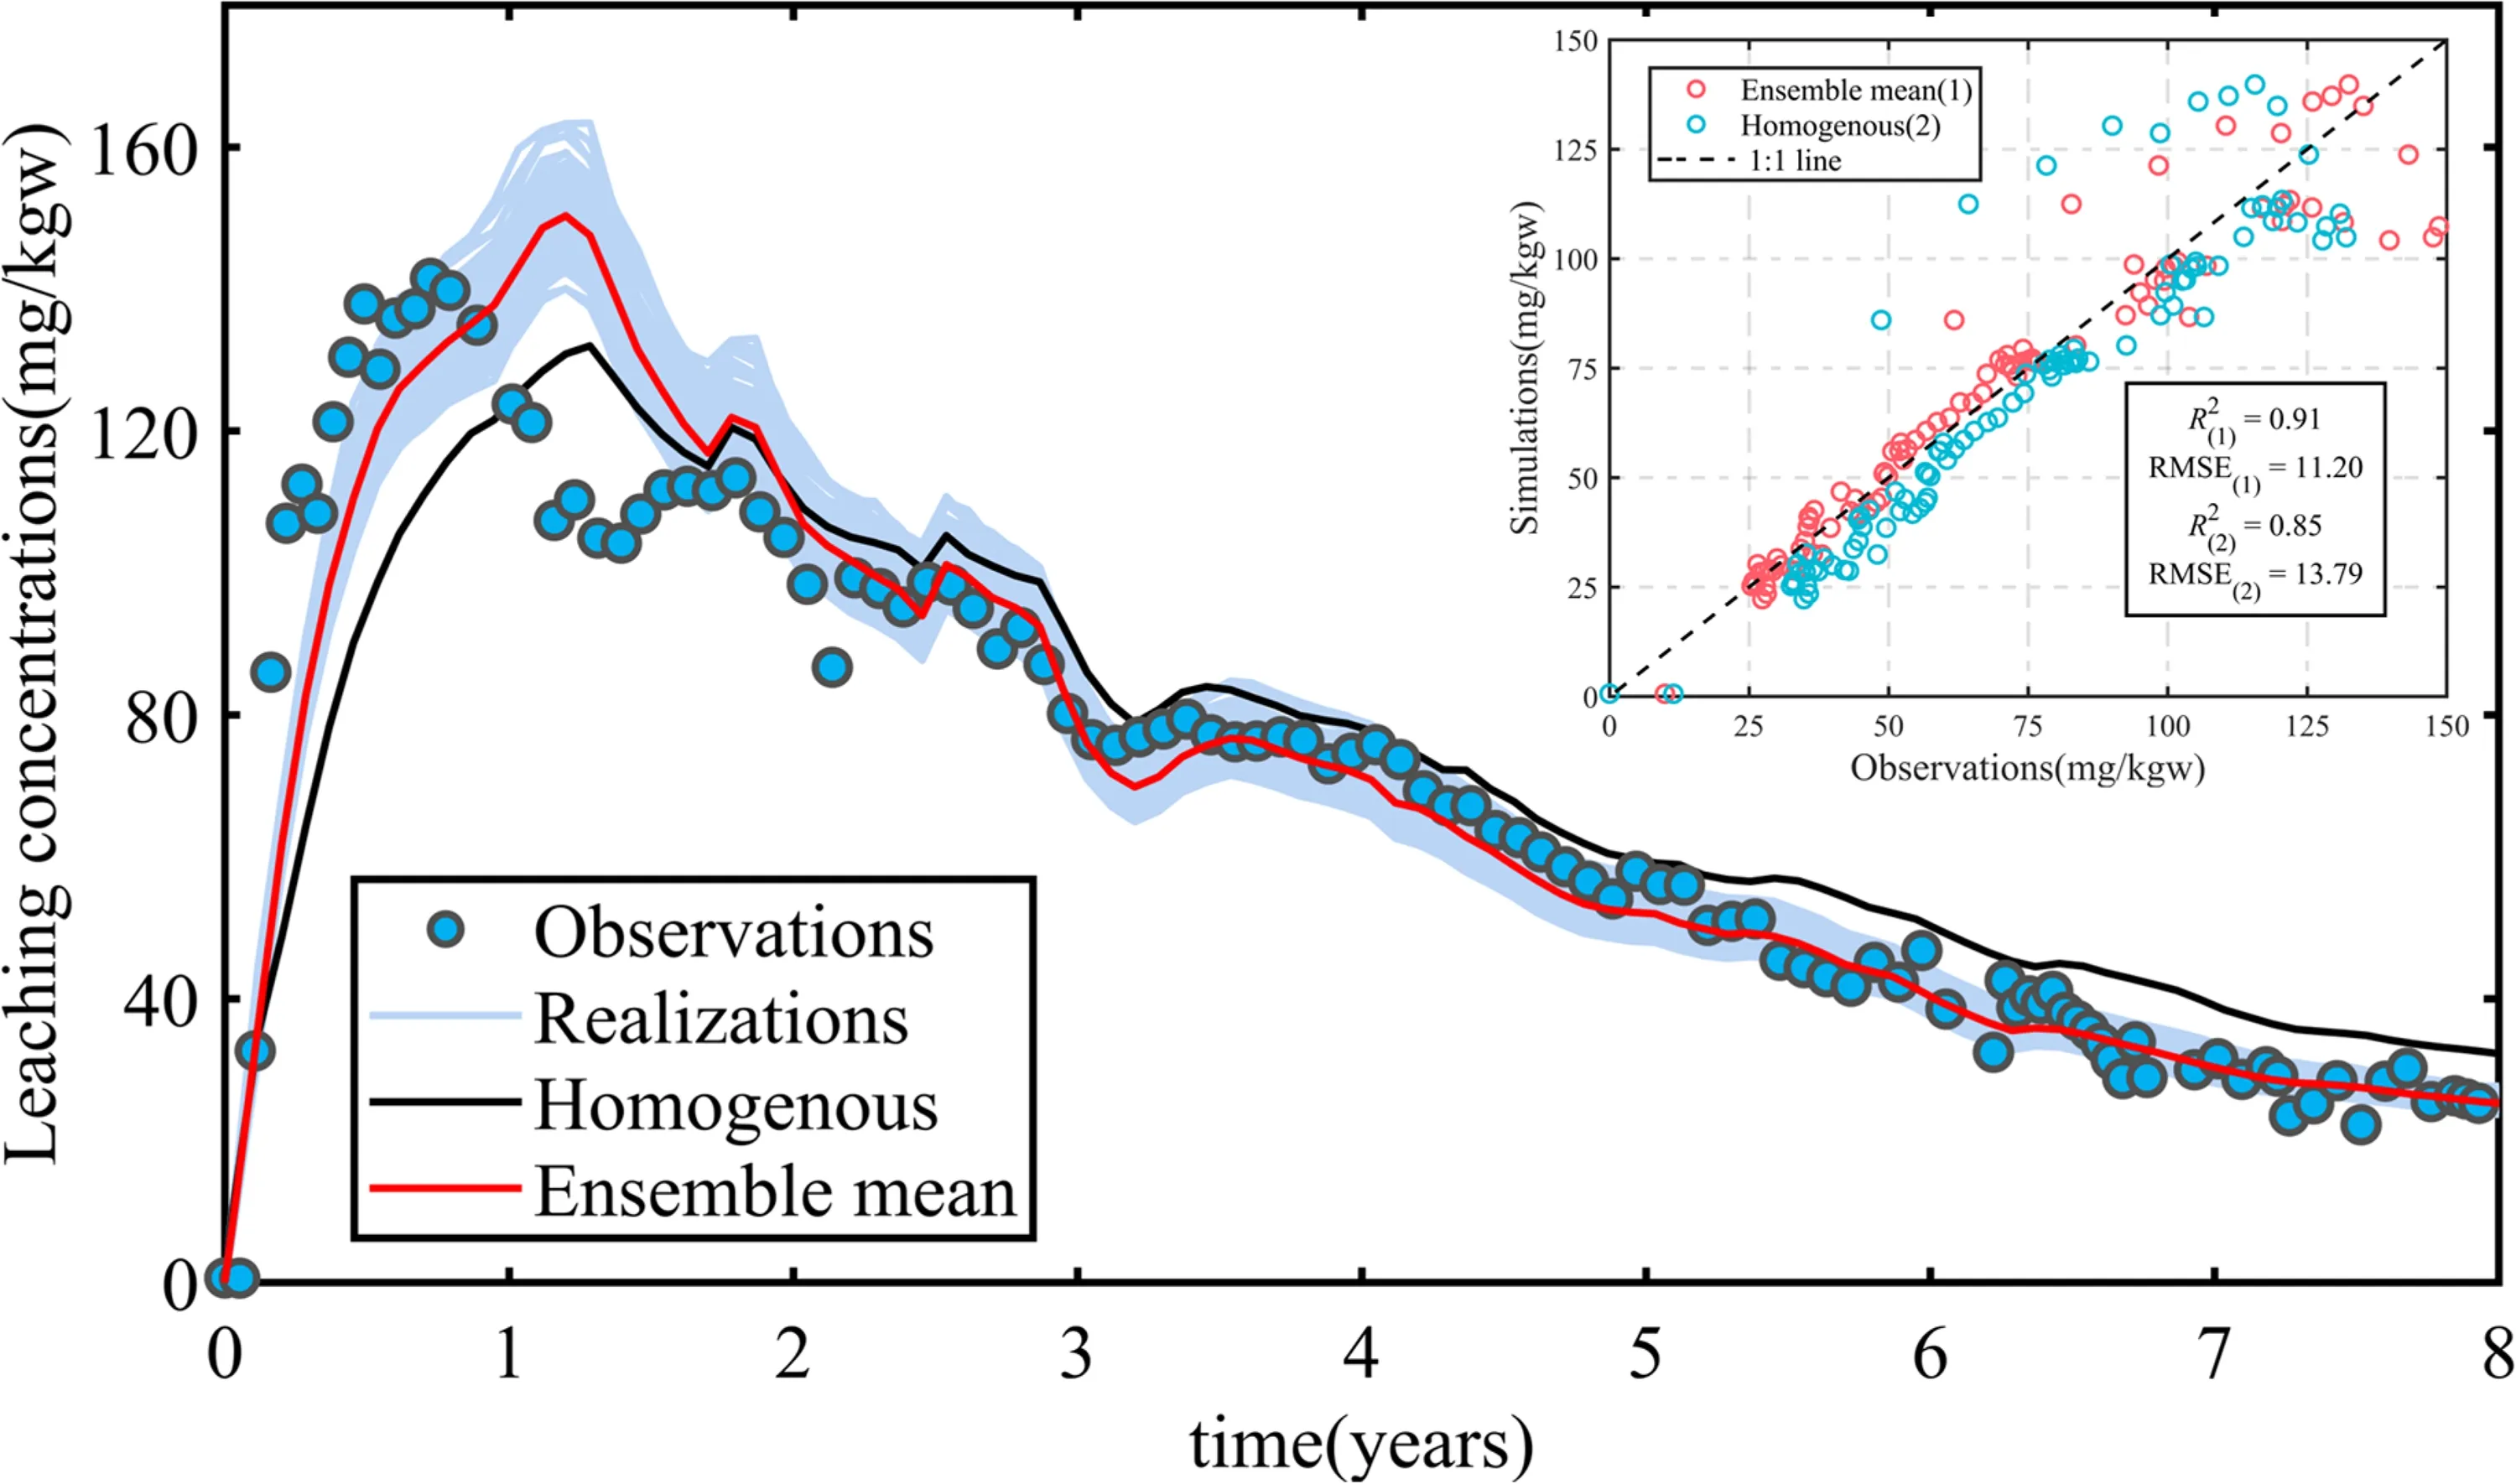
Fig. 8 Total observed and simulated leaching concentrations of uranium in four production wells. Blues lines correspond to leaching concentrations of a set of 100 conditional realizations, and the red line indicates their average over 100 realizations; scatter plot with linear regression with R2 and RMSE of the simulation VS observation of the leaching uranium concentrations
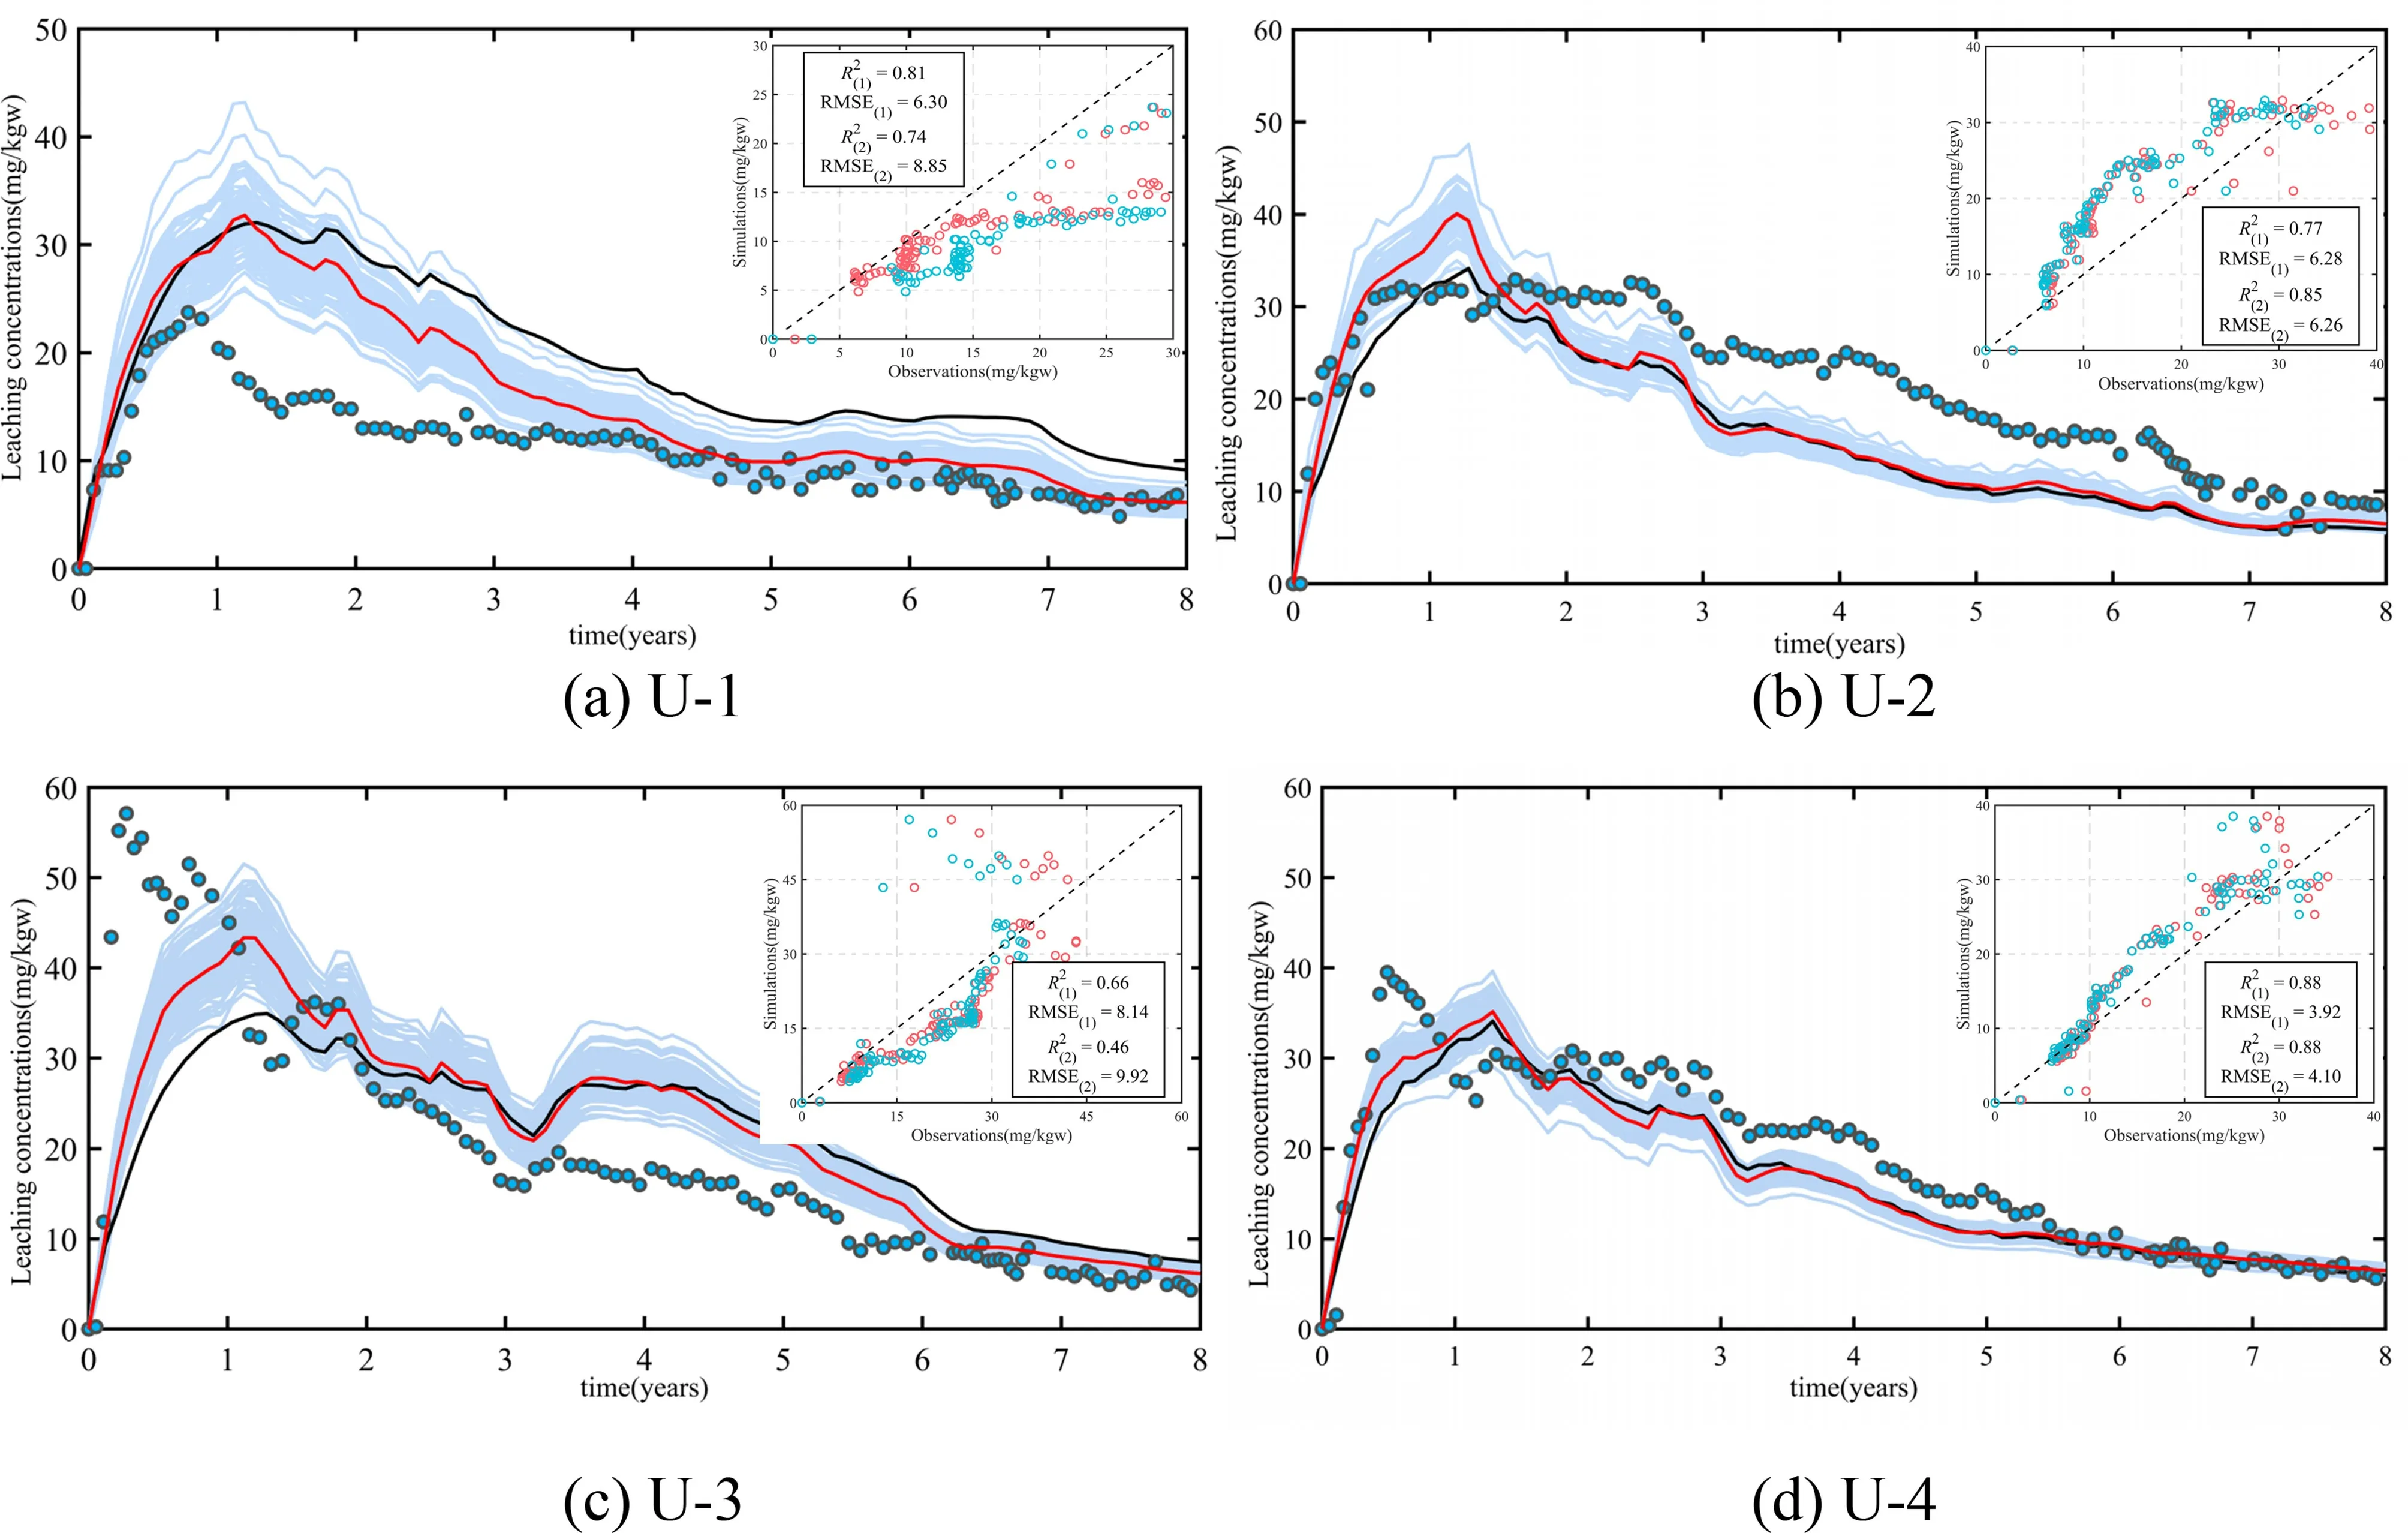
Fig.9 Comparison of the U+6 leaching concentrations for 100 realizations of uranium grade in the four production wells.Blues lines correspond to leaching concentrations of a set of 100 conditional realizations,and the red line indicates their average over 100 realizations;scatter plot with linear regression with R2 and RMSE of the simulation VS observation of the leaching uranium concentrations
4.3 Model uncertainty
The generation of stochastic realizations of a geostatistical model by conditional simulation constitutes an MC sampling from a uniform distribution. The usual approach to deal with uncertainty is to utilize all realizations assuming that the variability in the results from the MC simulations falls within the uncertainty associated with the calibrated model. Chebyshev’s inequality method can be applied to completely arbitrary probability distributions (unknown except for mean and variance)and has great utility. However,the inequality generally gives a poor bound compared to what might be deduced if more aspects are known about the distribution involved.
In this study, a conservative estimate (over-estimate) of the confidence interval length for the expected value of the total leached uranium concentrations from 100 realizations was obtained by considering Chebyshev’s inequality.
Figure 10 presents the statistical values of the total leached uranium concentrations from a set of 100 stochastic realizations obtained from the reactive transport model; the sample mean and standard deviation of these data are 572.27 and 20.33 mg/kgw, respectively. Consequently, Chebyshev’s inequality method states that 95%percent of the data falls between 563.22 and 581.31 mg/kgw.This indicates that the ISR simulation carried out with the selected geostatistical realizations gives a good approximation to the actual measurements of the cumulative uranium production calculation of 536.49 mg/kgw over the whole set of geostatistical simulations. This approximation can then be used to quantify the uncertainties on uranium production.Besides,dynamic regulation of CO2+ O2ISL are subject to a large set of uncertain variables,in which the management objective is to drill an injection/production well at the early field development plan stage to maximize future uranium recovery, and therefore, the uncertainty analysis enables robust optimization for considering the inherent geological uncertainty.

Fig. 10 Statistical values of the simulated total leached uranium concentrations from a set of 100 stochastic realizations
5 Conclusions
To assess the impact of the spatial variability of the mineralogical properties of a uranium deposit on the CO2-+ O2in-situ leaching (ISL) of uranium, a 3D reactive transport model was developed to simulate the reactive kinetics of uranium minerals during long-term exploitation.The model sufficiently replicated the behavior of the hydrodynamic evolution, leaching solutions-rock interaction, and dynamic uranium recovery. Spatially stochastic random fields for the uranium grade were generated using the Sequential Gaussian Simulation model. Two scenarios were designed and compared to examine the effects of heterogeneities in uranium grade and the associated influences on the in-situ leaching of uranium.The first scenario is based on a conceptualization of the geology and the spatial distributions of lithofacies and mineralogy, and thus, can be regarded as a 3D deterministic model. The other integrates the characterization of highly heterogeneous uranium grades through a stochastic simulation.The key conclusions of the present study are:
(1) We developed a reactive transport model considering real-world conditions to quantitatively replicate the exploitation of uranium by ISL. This wellcalibrated model can be used to improve our understanding of the leaching process and how the kinetically controlled oxidative dissolution and transport of uranium affect the uranium leaching efficiency in mining areas.
(2) Geostatistical simulations of the uranium deposit based on the 78 uranium grade values collected from exploration drill holes and logging data were performed using variogram analysis to describe the variability of the uranium grade. The results of the geostatistical analysis reveal that the distribution of the grade distribution has a high degree of spatial correlation.
(3) Quantification of the uncertainty was performed based on homogenous and heterogeneous scenarios.In contrast to the homogenous model,the sum of the leached concentrations in the heterogeneous scenario obtained via the stochastic simulation generated with the variogram-based SGS method accounts for nearly all the measured values. In other words, the stochastic reactive transport model presents envelopes for a range of possible solutions. Finally,implementing Chebyshev’s inequality method showed that the leached concentrations between 563.22 and 581.31 mg/kgw fall within the 95%envelope.
AcknowledgementsThis work was jointly supported by the National Key Research and Development Program of China (No.2019YFC1804304) and the National Natural Science Foundation of China (Nos. 2167212, 41772254).
Declarations
Conflict of interest On behalf of all authors, the corresponding author states that there is no conflict of interest.
杂志排行
Acta Geochimica的其它文章
- Geochemistry of metasedimentary rocks of the Sonakhan and Mahakoshal greenstone belts, Central India: Implications for paleoweathering, paleogeography and mechanisms of greenstone belt development
- Geochemical analysis of multi-element in archaeological soils from Tappe Rivi in Northeast Iran
- First-principle study of Ba isotopic fractionation during ion exchange processes
- Late Cretaceous K-rich rhyolitic crystal tuffs from the Chuduoqu area in Eastern Qiangtang subterrane: evidence for crustal thickening of the central Tibetan Plateau prior to India–Asia collision
- Pure forsterite in Nyiragongo lavas: evidence for subsolidus oxidation of volcanic rocks
- Petrogenesis and tectonic implications of the Early Cretaceous Dagushan adakitic porphyries in the Anshan area, North China Craton
