Cluster dynamics modeling of niobium and titanium carbide precipitates in α-Fe and γ-Fe
2022-02-24NadezdaKorepanovaLongGu顾龙MihaiDimaandHushanXu徐瑚珊
Nadezda Korepanova Long Gu(顾龙) Mihai Dima and Hushan Xu(徐瑚珊)
1Institute of Modern Physics,Chinese Academy of Sciences,Lanzhou 730000,China2School of Nuclear Science and Technology,University of Chinese Academy of Sciences,Beijing 101408,China3Institute for Physics and Nuclear Engineering,Bucharest 077125,Romania4School of Nuclear Science and Technology,Lanzhou University,Lanzhou 730000,China5Paul Scherrer Institute,Villigen 5232,Switzerland
Kinetic behaviors of niobium and titanium carbide precipitates in iron are simulated with cluster dynamics. The simulations,carried out in austenite and ferrite for niobium carbides,and in austenite for titanium carbide,are analyzed for dependences on temperature, solute concentration, and initial cluster distribution. The results are presented for different temperatures and solute concentrations,compared to experimental data available. They show little impact of initial cluster distribution beyond a certain relaxation time and that highly dilute alloys with monomers only present a significantly different behavior from denser alloys or ones with different initial cluster distributions.
Keywords: cluster dynamics,precipitates,precipitation kinetics,carbides
1. Introduction
Addition of titanium and niobium to steels in metallurgy is conducive to titanium/niobium carbide precipitates in solid solution due to their combination with the carbon present in steels. This process limits the formation of chromium carbides, thereby preventing intergranular corrosion.[1,2]Additionally, finely dispersed carbide precipitates increase alloy strength at low and high temperatures.[2,3]Nuclear-grade steels are required to meet higher additional standards, and the question of precipitate dynamics is raised with respect to their action as point defect recombination centers and sinks for helium, which reduces void swelling and helium embrittlement.[4–8]TiC/NbC precipitates tend to stabilize dislocation networks, and hence enhance creep resistance.[9,10]Titanium carbides are in particular attractive in this respect,which led to the development of 15-15Ti steel in the 1970s[11]for nuclear reactor applications. This steel exhibits excellent resistance to irradiation swelling and creep and has been chosen as a structural material for several generation-IV designs.
To simulate the precipitation behavior of carbides we use cluster dynamics (CD), which is effective in predicting microstructural evolution in the material, having also minimal computing overhead for long time period simulations. In this method polyatomic clusters embedded in the solid solution exchange solute atoms by absorption or emission. Time evolution of cluster distributions is computed from differential equations coupled through monomer exchanges.
In the case of iron, CD yields good results for Cu precipitates in ferrite[12]and MnSiNi precipitates in ferritemartensitic steel.[13]
For NbC and TiC precipitates in steel, classical kinetic nucleation theory (CNT) has been used.[14–17]TiC precipitate modeling focuses more on precipitation–temperature–time (PTT) diagrams, rather than on time-evolution of mean radius,volume fraction,and number density.
This paper is organized as follows:Section 2 gives a brief description of the CD method. Section 3 presents our simulation results for niobium carbides in austenite and ferrite for titanium carbide in austenite. Also,Section 3 presents a comparison of our results to existing experimental data. Section 4 summarizes our study.
2. Methodology
In cluster dynamics, alloys are treated as binary systems of an alloy matrix with clusters of solute atoms. Clusters grow or shrink through the absorption and emission of solute atoms,respectively. Time evolution of solute clusters is dictated by a set of differential equations (1) and (2), which assume that only the monomers are mobile. Small cluster mobility may result from a common drift of monomers, i.e., an assumption reasonable in dilute alloys:[18]


wherenis the cluster size,Nmaxthe maximal cluster size,Cnthe uniform concentration of size-nclusters,C1the concentration of monomers,αnthe rate of monomer emission from size-nclusters,βnthe rate of monomer absorption by size-nclusters. The latter two can be calculated by

whereis the atomic volume of the alloy matrix,rnthe radius of size-nclusters,Dthe thermal diffusion coefficient of solute atoms in the system,Athe geometrical factor,σthe interfacial energy between precipitates and matrix,the equilibrium concentration of solute atoms in the system,Tthe temperature in degrees Kelvin,andkthe Boltzmann constant. The radius of clusters with sizenis

CD is a computationally efficient method. However,with increasingNmax100 it can become CPU-wise intensive.A traditional way to overcome this is to transform the differential equations into a Fokker–Planck partial differential equation[19,20]

The discretization of the Fokker–Planck equation using the central difference method brings Eq.(6)into the following form:

and the evolution of monomer concentration to

Here,njis defined as follows:

The above system is reduced to the initial differential equations fornj=j. This numerical scheme does not strictly conserve matter(as done by differential equations(1)and(2)).However,under carefully defined circumstances the losses are small and acceptable. To solve the above system we use in our study the ODEINT solver.[15]
In this study we assume that the diffusion coefficient of titanium/niobium carbide is determined by the most resistive element,i.e.,we use the Ti and Nb diffusion coefficients in the simulations,correspondingly.
The authors of Refs. [15,21] employed the “pipediffusion” effect, i.e., a faster solute diffusion along dislocations than in the lattice in general, for TiC/NbC precipitation kinetics. We include the effect of dislocations in the model,in Eq.(3),as a modified effective diffusivity:[15]

whereDdislis the diffusion along dislocations (equal toDbulkαdisl, with theαdislcorrection factor defined according to Ref. [22] and presented in Table 1),Dbulkis the bulk diffusivity,Rcoreis the radius of the dislocation core, andρis the dislocation density. Figure 1 illustrates the effect of dislocations on diffusivity and how this changes with temperature.The figure shows the ratio of effective diffusivity to bulk diffusivity in austenitic steel for several values of dislocation densities. The ratio increases with dislocation density increasing and drops sharply with increasing temperature.

Fig. 1. Effect of dislocation on diffusivity, i.e., the ratio of effective diffusivity to bulk diffusivity in austenite steel for several values of dislocation densities.
The results of the simulation are the time-evolution of the mean radius,the volume fractionfv,and the number density of precipitatesNtot,calculated with the following equations.
Mean radius

whereis the atomic volume of precipitate,andthe mean size of precipitate clusters,

with Δnj=nj −nj−1,jcuttaken such thatrjcut= 1 nm for TEM data (given the resolution limit in Refs. [23,24], andrjcut=0.5 nm for SANS data).
Volume fraction

Number density

withthe atomic volume of the matrix.
In our study we use an initial cluster distribution described by

whereC0is the concentration of the alloying element in steel,xthe part of the alloying element in monomer form,Mthe maximal cluster size assumed to exist in the steel at momentt=0. In the next section, we show the dependence of CD results on the initial state of the system.
3. Results and discussion
In this section, we present the results of our CD simulations for NbC and TiC in ferrite and austenite and compare them with experimental data from literature. The parameters used in the simulations are shown in Tables 1 and 2. Table 1 displays the material parameters for TiC, NbC, and iron matrix, and Table 2 gives references from which experimental data and conditions are taken.

Table 1. Material parameters for titanium and niobium carbides and for the iron matrix.

Table 2. Experimental datasets and the concentrations and temperatures at which they were measured.
3.1. Niobium carbide
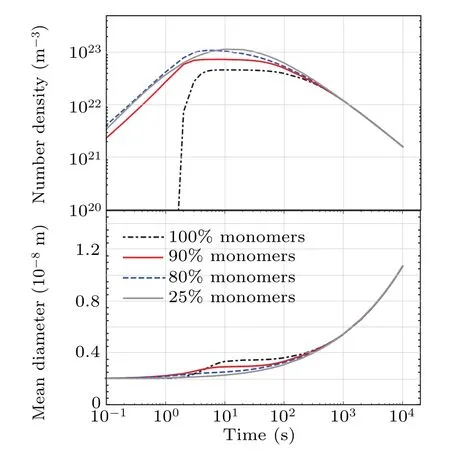
Figures 2 and 3 show the dependence on the initial cluster distribution for the time-evolution of precipitate mean radius and number density. We assess this in order to verify the sensitivity of our simulations to the initial state of the system.The initial cluster distributions for our simulations are described by Eq.(15). Note in the figures that we index the radiusrMbyM,the maximal size of a cluster initially exists in the system. The cluster distributions used are described by Eq.(15),as well as by arbitrary distributions: Poisson-like,or step-function. The simulation results show to be the same for all distributions,warranting our use of Eq. (15) describing the initial distributions throughout our study.
Figure 2 shows the time evolution of precipitate mean radius and number density in 4 distinct cases for which we vary the concentrations of monomers and other clusters (see Eq. (15), while keepingrMconstant. Complementary, Fig. 3 presents the time-evolution of the mean radius and number density in relation torM,for the same corresponding monomer concentrations. For comparison, Fig. 3 shows the simulation only for monomers.

Fig.2. Dependence of simulation results on initial cluster distributions.T =950 °C,C(wt%Nb)=0.095.

Fig. 3. Dependence of simulation results on initial cluster distributions and radius rM. T = 950 °C, C(wt%Nb)=0.095 (left graph),C(wt%Nb)=0.031(right graph).
As shown in Figs. 2 and 3, the initial cluster distributions play a role only in the initial departure time (with the notable exception of the 0.031 wt%Nb-steel simulation, with monomers and very small clusters). After 1000 s the effect of the initial cluster distribution wanes and all simulations become indiscernable from one another. The exception case of 0.031 wt%Nb-steel with monomers and very small clusters is shown in Fig. 3. Its anomalous behavior is also observed for TiC inγ-Fe and NbC inα-Fe. This is likely due to the very few precipitation centers in very dilute alloys,which have the opportunity to grow faster than those in higher solute concentration alloys. The amount of such clusters remains however small (see upper panels in Fig. 3). If we introduce clusters with higher size in the initial distribution, the precipitate kinetic would follow the typical behavior.

Fig. 4. Comparison of simulation results with experimental data for NbC precipitates in austenitic stainless steel. The dots represent the experimental data of Ref. [23]. The simulations and experimental data are shown for Nb concentration of 0.031 wt%and 0.095 wt%at temperatures 900 °C and 950 °C.
Comparing our simulations (Fig. 4) with experimental data for niobium carbide precipitates in austenitic iron[23]we find that in 0.031 wt%Nb-steel, 90%of niobium should exist as monomers. If we accept the 100%assertion of Ref.[23],the simulations would contradict with the available experimental data. We assume that the remaining 10% distributes in clusters withrM<1 nm,invisible in TEM.The exact dislocation density for the steel used by Hansenet al.[23]is unavailable,hence we adjust this parameter to agree with the experimental data. The result shows that the dislocation density of steel is in the range 1011–1012m−2. This concurs with the mention that the steel is well annealed.[23]Note that the pipe-diffusion effect for given dislocation density range and temperatures is negligible.
For niobium carbide precipitates in ferrite,the simulation results and experimental data[16,34]are depicted in Fig.5. Our model with the set of parameters from Table 2 matches quite well with the experimental data of Refs. [16,34]. There appears less volume fraction, predicting faster clustering of the precipitates than the data. Figure 5 also shows better agreement with the experimental data at low temperatures versus high temperatures. This is likely due to the higher energy available at high temperatures, which activates the diffusion of small clusters along with monomers,whereas in our model only the monomers are mobile.

Fig. 5. Simulation results for C(wt%Nb)=0.079 (left) and 0.040 (right) at temperatures 600 °C, 700 °C and 800 °C. The dots represent the experimental data of Refs.[16,34]. For C(wt%Nb)=0.040 at T =800 °C the simulated number density and volume fraction of precipitates are too small,and therefore invisible in the figures.
3.2. Titanium carbide
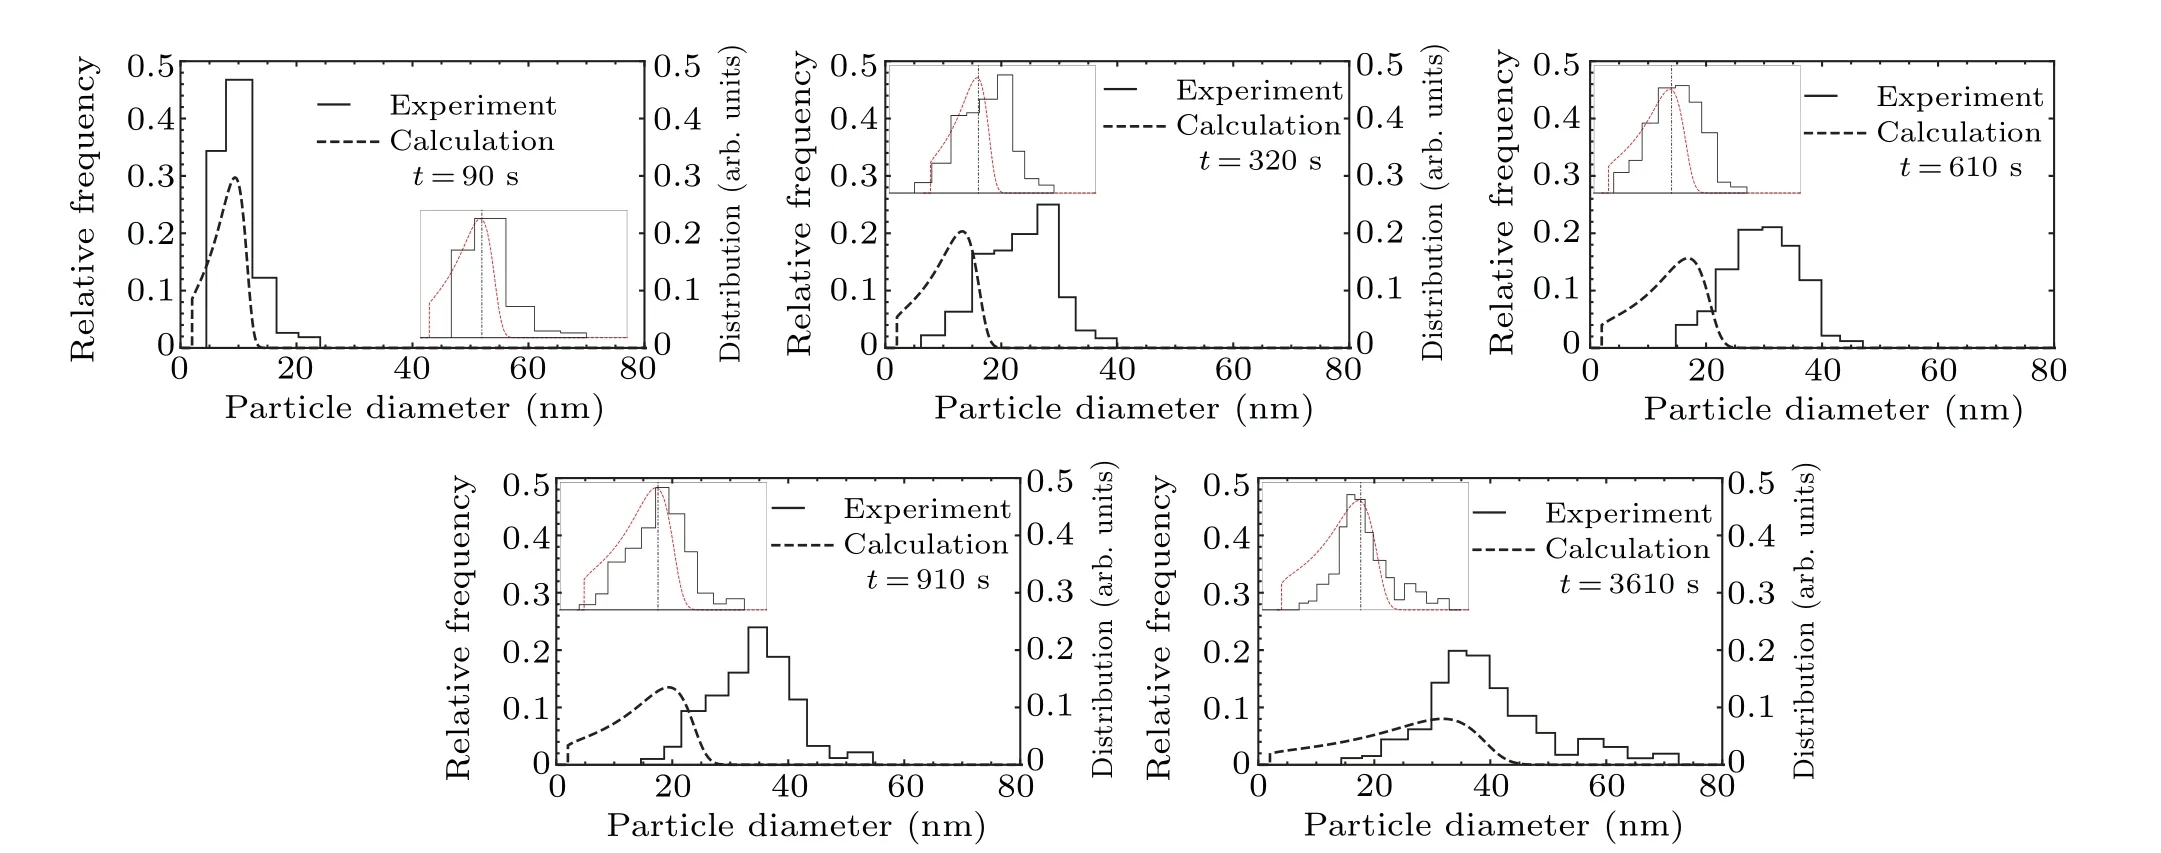
Simulation results for TiC precipitates in austenite and experimental data from Refs.[24,27,32,33]are presented in Figs. 6–8. Figure 6 displays the time evolution of mean particle diameter, with CD predicting a particle diameter ∝t1/3,regardless concentration,temperature,and dislocation density(except in 0.1 wt%Ti-steel–∝t1/2). Experimental data on the other hand exhibits two regions: an initial region, with mean diameter proportional to time exponent with factor 0.5–1.0;and a second region with the time exponent having a very low factor, practically a plateau. Although in Ref. [33] the secondary region was considered as ∝t1/3(reflecting the Ostwald ripening phenomenon controlled by bulk diffusion of Ti), the authors believed that the time exponent exhibits a much lower factor (likely due to other phenomena). The two regions are also clearly observed in the size distributions.
The size distributions from experimental data[33]are shown in Fig.7. Although our model predicts a smaller mean diameter, the overall distribution shape of the sizes is strikingly similar to the experimental ones (up to 3610 s, after which the distributions start to differ). Additionally, in the insets in Fig. 7 the experimental and simulated size distributions are plotted such that both have the same mean diameter and maximal magnitude. The comparison of size distributions relative to the experiment[24]at 750°C(Fig.8)shows a similar change in size distribution. The small difference observed may suggest a competing mechanism controlling the growth of TiC precipitates.

Fig. 6. Comparison of simulation results with experimental data for TiC precipitates in austenitic stainless steel. The dots represent the experimental data taken from Refs.[24,27,32,33].

Fig.7.Size distributions from experiment[33]and simulation for different times at 900°C.The insets inside the graphs display the experimental and calculated distributions shifted such that both have the same mean particle diameter.The dot-dashed vertical line represents mean diameter.

Fig.8.Size distributions from experiment[24]and simulation for different times at 750°C.The insets inside the graphs display the experimental and calculated distributions shifted such that both have the same mean particle diameter.The dot-dashed vertical line represents mean diameter.
In Ref. [24] it is mentioned that the pinning of mobile dislocation affects TiC precipitates kinetics in the temperature range 650–900°C. However, CD applies only diffusioncontrolled growth of precipitate clusters.To overcome this obstacle, a model for time-evolution of mobile dislocation density needs to be introduced,alongside with the dependency of diffusion on mobile dislocation density. The verification of this assertion will be explored in subsequent studies. Note that the data itself is quite scarce for TiC precipitations. We feel that there is a need for broader experimental and theoretical work on TiC precipitates.
4. Conclusion
In summary, we have applied cluster dynamics to model precipitation kinetics of niobium and titanium carbides in iron.The kinetic behaviors of NbC precipitates have been simulated for ferritic and austenitic iron matrices. Our simulation results are in agreement with the experimental data. We have analyzed our results for dependence on initial cluster distribution, where we consider various types of distributions and monomers concentration. The analysis has shown that the initial distribution plays a role only in the initial-time range. After this initial time,all simulations exhibit the same behavior.The analysis has also shown the“special”behavior of precipitates for the case of very dilute alloys with only monomers present: a fast growth of mean particle diameter, with small number densities. We therefore assume that dilute alloys have fewer precipitation centers, with less competition per center,allowing said centers to grow faster.
For TiC on the other hand,the simulation results and experimental data differ somewhat more.This is indicative of another controlling mechanism besides diffusion. Such a mechanism could be mobile dislocation and its pining, which was suggested in Ref.[24]. We feel there is a need for more experimental and theoretical work to fully model titanium carbide precipitates kinetics.
Acknowledgement
N.Korepanova is grateful for the CAS-TWAS President’s Fellowship Programme for this doctoral fellowship (Grant No.2016CTF004).
杂志排行
Chinese Physics B的其它文章
- High sensitivity plasmonic temperature sensor based on a side-polished photonic crystal fiber
- Digital synthesis of programmable photonic integrated circuits
- Non-Rayleigh photon statistics of superbunching pseudothermal light
- Refractive index sensing of double Fano resonance excited by nano-cube array coupled with multilayer all-dielectric film
- A novel polarization converter based on the band-stop frequency selective surface
- Effects of pulse energy ratios on plasma characteristics of dual-pulse fiber-optic laser-induced breakdown spectroscopy
