Influence of different microstructural features on impact toughness and crack initiation behavior of coarse grain heat-affected zone in X80 pipeline steel
2022-01-19
Research Institute,Baoshan Iron & Steel Co.,Ltd.,Shanghai 201999,China
Abstract: Coarse grain heat-affected zone samples of X80 pipeline steel under different heat inputs were obtained through thermal welding simulation experiments with Gleeble 3500.Charpy impact tests and a combination of multiscale characterizations were conducted to investigate the influence of various microstructural features on impact toughness and crack initiation behavior.The results prove that,as the heat input increases,the number of M/A components increases,thereby degrading toughness and increasing hardness.Meanwhile,more M/A constituents tend to aggregate on prior austenite grain boundaries (PAGBs),and the overall dimensions of M/A and the width and volume fraction of the lath martensite substructure inside M/A islands would increase as well.These changes make intersections between boundary M/As and PAGBs become one of the preferred sites for crack initiation.In addition,only large-sized grotesque inclusions can act as a direct inducement of crack initiation.
Key words: X80 pipeline steel; coarse grain heat-affected zone; microstructural features; impact toughness; crack initiation
1 Introduction
As the most representative of high-grade pipeline steels,X80 has been widely used in petroleum and natural gas transportation[1-2].In general,the service properties of X80 pipelines require a good combination of high tensile strength,excellent corrosion resistance,and most importantly,good toughness[3].However,the local brittle zone (LBZ) is inevitably introduced into the welded joint through the welding procedure,which is an essential procedure during pipeline manufacturing[4].For a single-pass welding procedure,the LBZ is always expected to be located in the coarse-grained heat-affected zone (CGHAZ)[5].
The deterioration of toughness in the CGHAZ is closely related to microstructural features.For example,coarse austenite grains and an increase in M/A components were found to decrease the toughness in X80 steel[6-7].The sizes of M/A constituents are identified as important factors influencing Charpy impact properties of the CGHAZ[8].Brittle second-phase particles and inclusions were used as the source of crack initia-tion,lowering impact energy[9].However,a more detailed and thorough investigation is still needed to improve the understanding of the influence mech-anism of these microstructural features,especially for crack initiation behavior.In this study,samples with different microstructures were prepared by a thermal welding simulation experiment,followed by Charpy impact tests.Then,detailed characterizations on micro-structure evolution between samples were performed by optical microscopy (OM),scanning electron micro-scopy (SEM),energy dispersive X-ray spectrometry (EDS),and transmission electron microscopy (TEM).Subsequently,the effects of different microstructural features on impact toughness and crack initiation behavior of X80 steel were dis-cussed.
2 Materials and experiments
The chemical composition of the parent X80 steel is shown in Table 1.The single-pass welding thermal simulation experiment was conducted on a thermodynamic simulator (Gleeble 3500).Fig.1 shows the thermal cycles employed for X80 pipeline steel:heating to peak temperatures of 1 350 ℃ and 1 150 ℃ with a heating rate of 200 K/s,holding at the peak temperature for 0.5 s,and then cooling down to 200 ℃ with differentt8/5(cooling time from 800 ℃ to 500 ℃) of 25 s, 36 s, and 49 s.The samples are named groups A (1 350 ℃,25 s),B (1 350 ℃,36 s),C (1 350 ℃,49 s),and D (1 150 ℃,36 s),respectively,according to the different simulation parameters,as shown in Fig.1.

Table 1 Chemical composition of X80 pipeline steel %
During the thermal simulation procedure,samples measuring 10 mm×10 mm×71 mm were kept in the vacuum chamber of the simulator.After the welding thermal cycle,the specimens were cut into standard Charpy V-notch impact specimens with a size of 10 mm×10 mm×55 mm,and Charpy impact tests were conducted at a test temperature of -20 ℃.Subsequently,hardness (Vickers) was determined by a load of 1 kg with holding time of 10 s for each specimen,and hardness values for groups A-D of samples were 201,236,225,and 216,respectively.
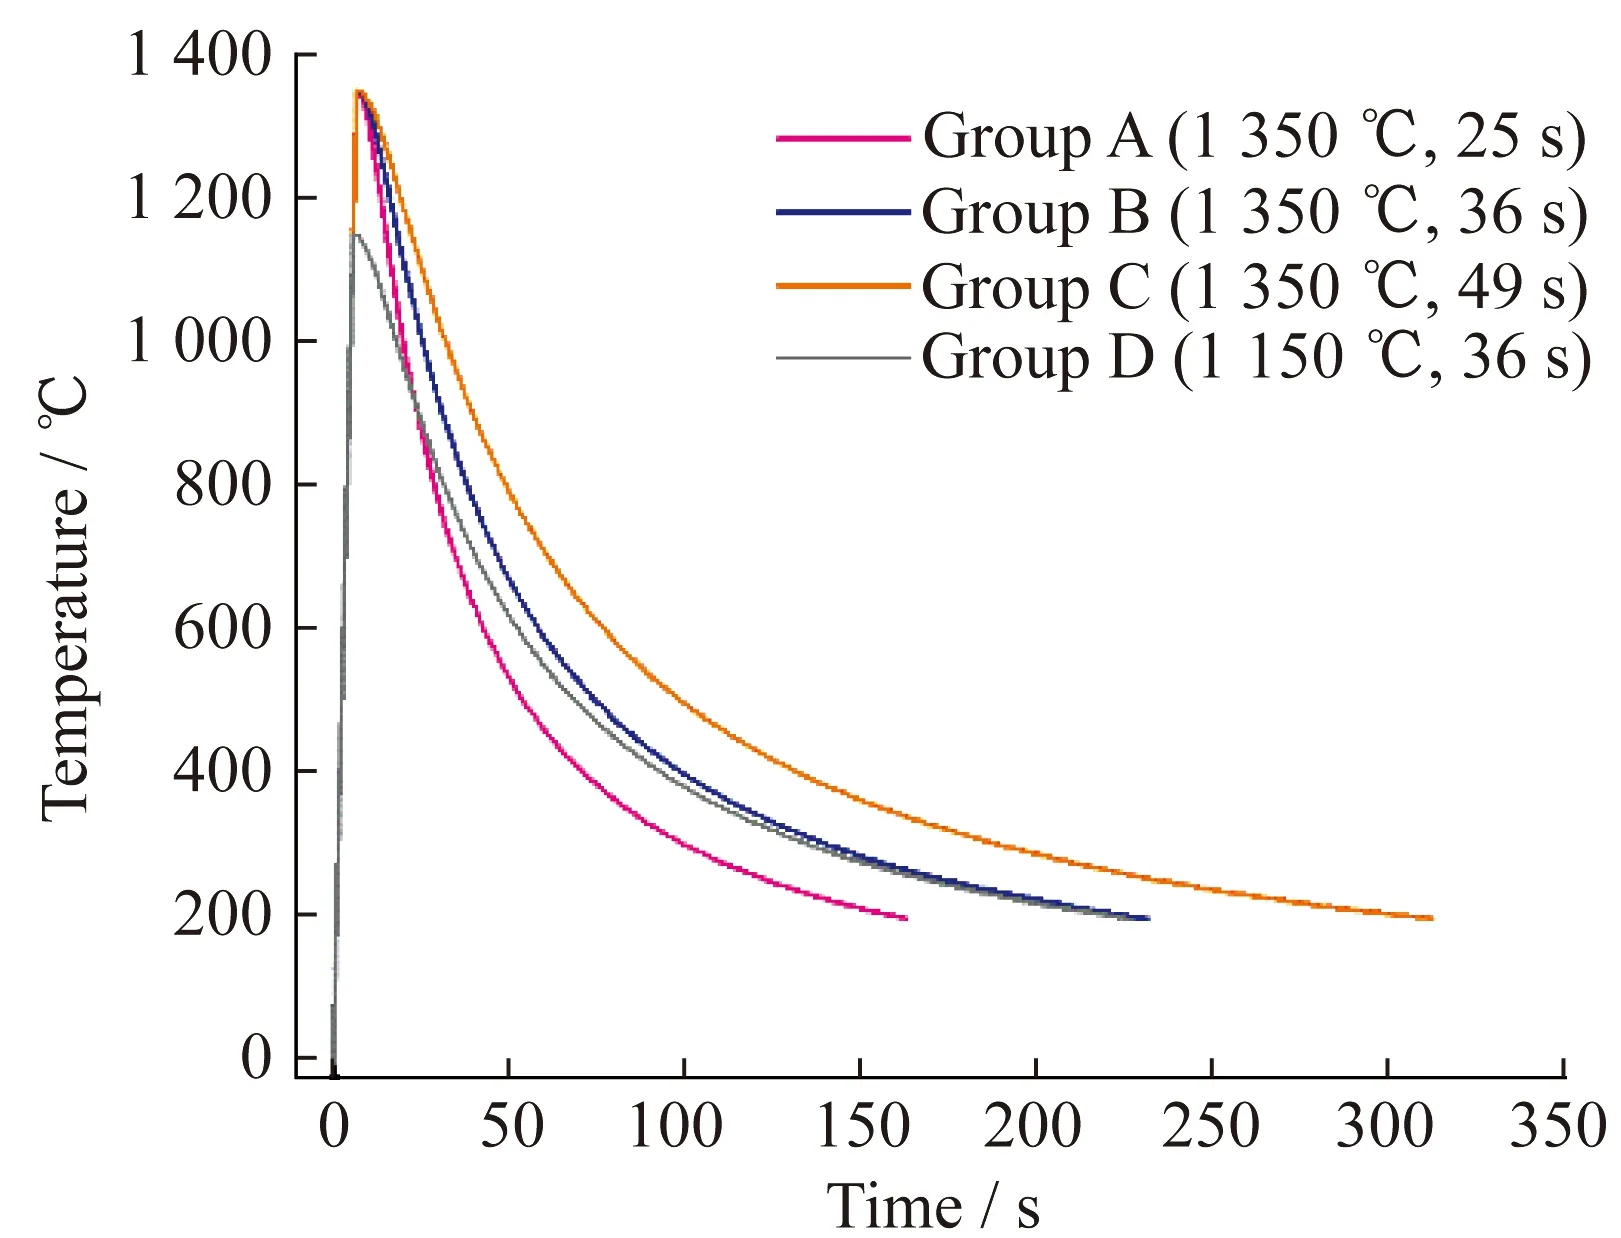
Fig.1 Schematic of thermal simulation curves
The specimens for microstructural characteri-zation were blocky ones cut from the central posi-tion of simulated samples by wire-electrode cutting.The metallographic specimens were prepared by mechanical polishing and then etched with 4% nitric acid alcohol for 10 s.To reveal the quantity and distribution characteristics of M/A con-stituents,all simulated samples were additionally etched by Lepera etchant (consists of equal parts of 20-ml distilled water+20-ml picric acid with 0.2-g Na2S2O5) for 30 s.The microstructure of simulated samples was successively characterized by Lecia’s DM6000M optical microscope,Zeiss EVO 25 scan-ning electron microscope,and JEOL JSM-2100 transmission electron microscope.
3 Results and discussion
3.1 Impact toughness
The Charpy impact test was first conducted at -20 ℃,and three samples were tested for each welding thermal simulation parameter.The tough-ness data (absorbed energy) are presented in Fig.2.Except for average impact energy,the single minimum value is also given since it is an important toughness judgment criterion from an engineering perspective.Group A samples have the highest absorbed energies (both average and single mini-mum),followed by group D samples.Besides,ast8/5increases,impact toughness (both average and single minimum) decreases.
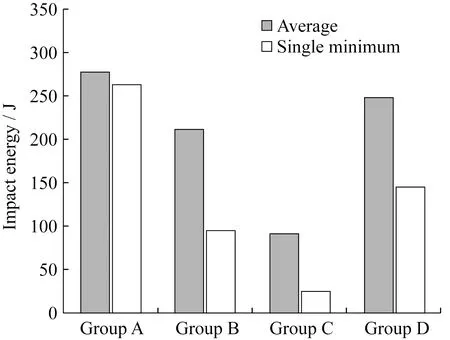
Fig.2 Charpy impact toughness of simulated samples
3.2 Metallographic microstructure
Fig.3 presents metallographic structures of dif-ferent simulated samples.The samples in four groups all consist of bainite ferrite (BF),granular bainite (GB),and M/A constituents.
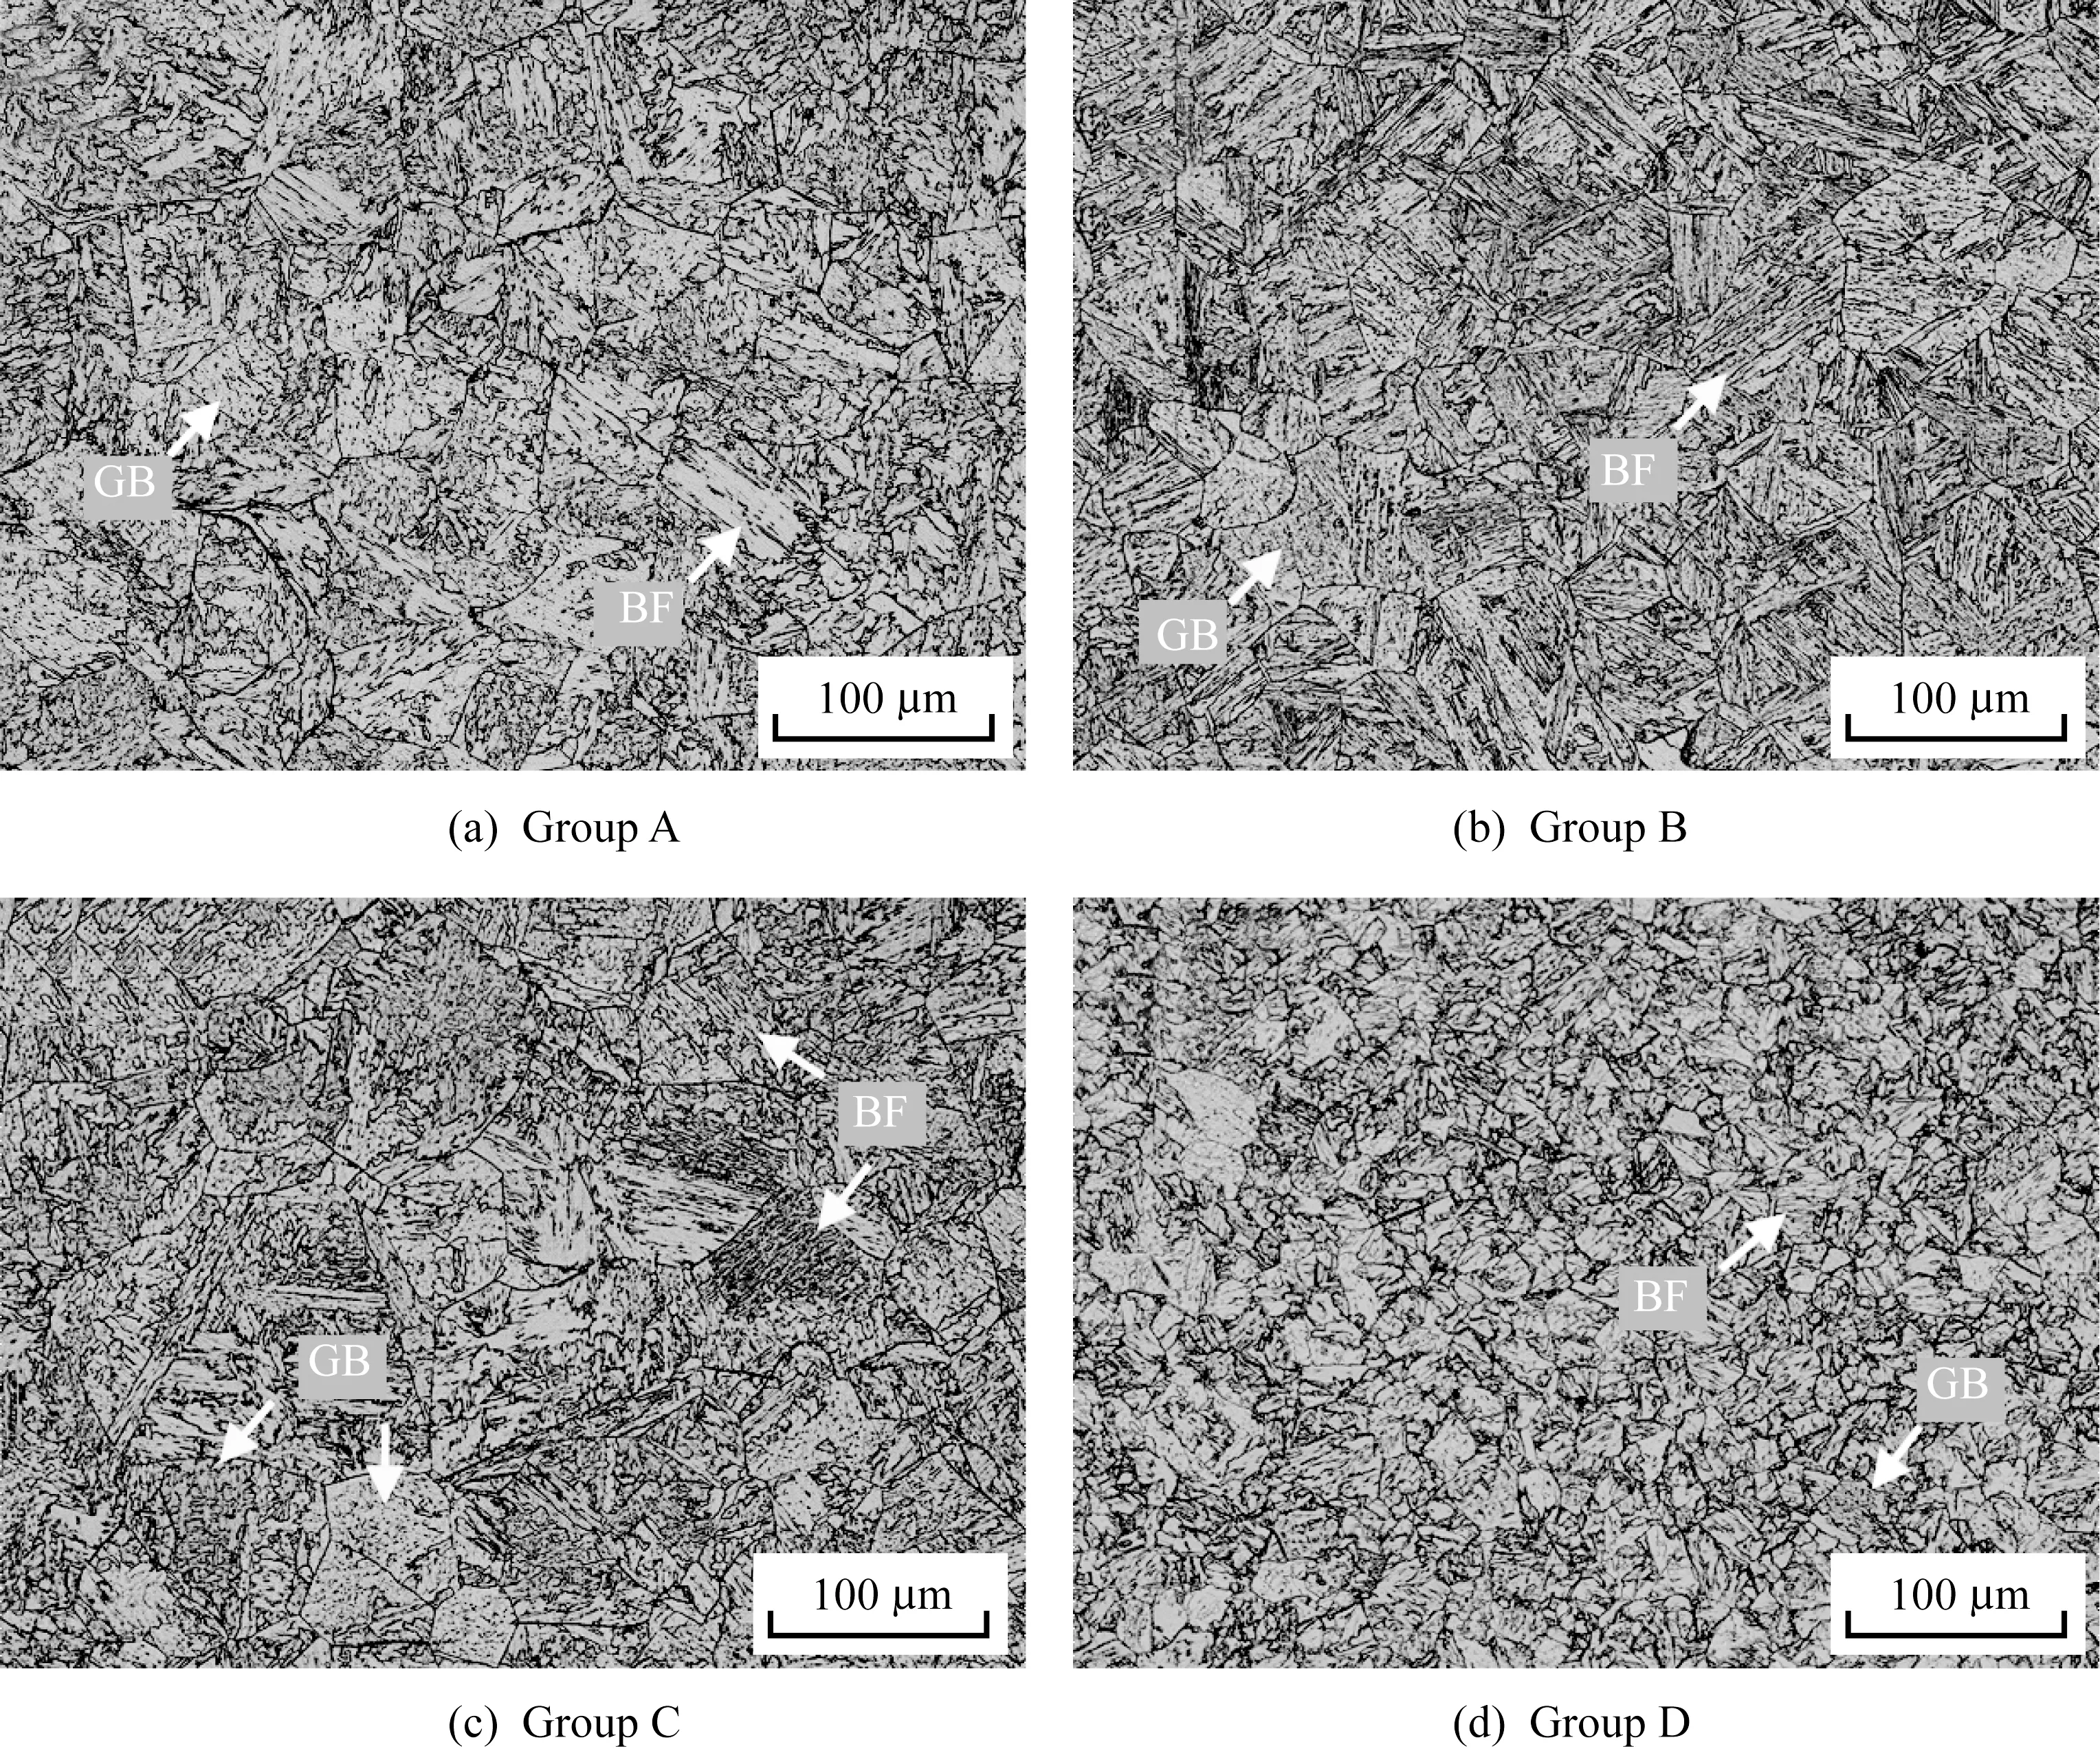
Fig.3 Metallographic structure of simulated samples under different parameters
Besides,another interesting finding is that the mean sizes of different samples are approximately equal whent8/5increases,whereas austenite grains coarsen nearly three times as the peak temperature rises from 1 150 ℃ to 1 350 ℃.This is because the austenite coarsening temperature for X80 pipeline steel is 1 200 ℃[10].Thus,austenite grains will grow rapidly once the heating peak temperature goes beyond this critical point.By contrast,the holding time extension during austenitization has a weaker influence on grain size coarsening than the peak temperature.In a previous study[11],the coarsening of austenite grains degrades toughness.
3.3 M/A constituents
Fig.4 presents the microstructure of samples etched with nitric acid alcohol under a scanning electron microscope.There are two main types of M/A components in the samples of this study:stringer and island components,as illustrated in Fig.4.Simultaneously,some M/A components show an aggregated distribution along prior au-stenite grain boundaries (PAGBs),and these M/As are named boundary M/As in this study.Then,the differences in the number of boundary M/As,or the number of PAGBs aggregated with M/As,in different simulated samples can be found in SEM microstructures.As shown in Figs.4(a)-(c),as the heat input increases,the number of PAGBs aggregated with M/As increases.Afterward,by lowering the peak temperature to 1 150 ℃ and keepingt8/5constant,the boundary M/A can be found abundantly in the sample,as shown in Fig.4(d).
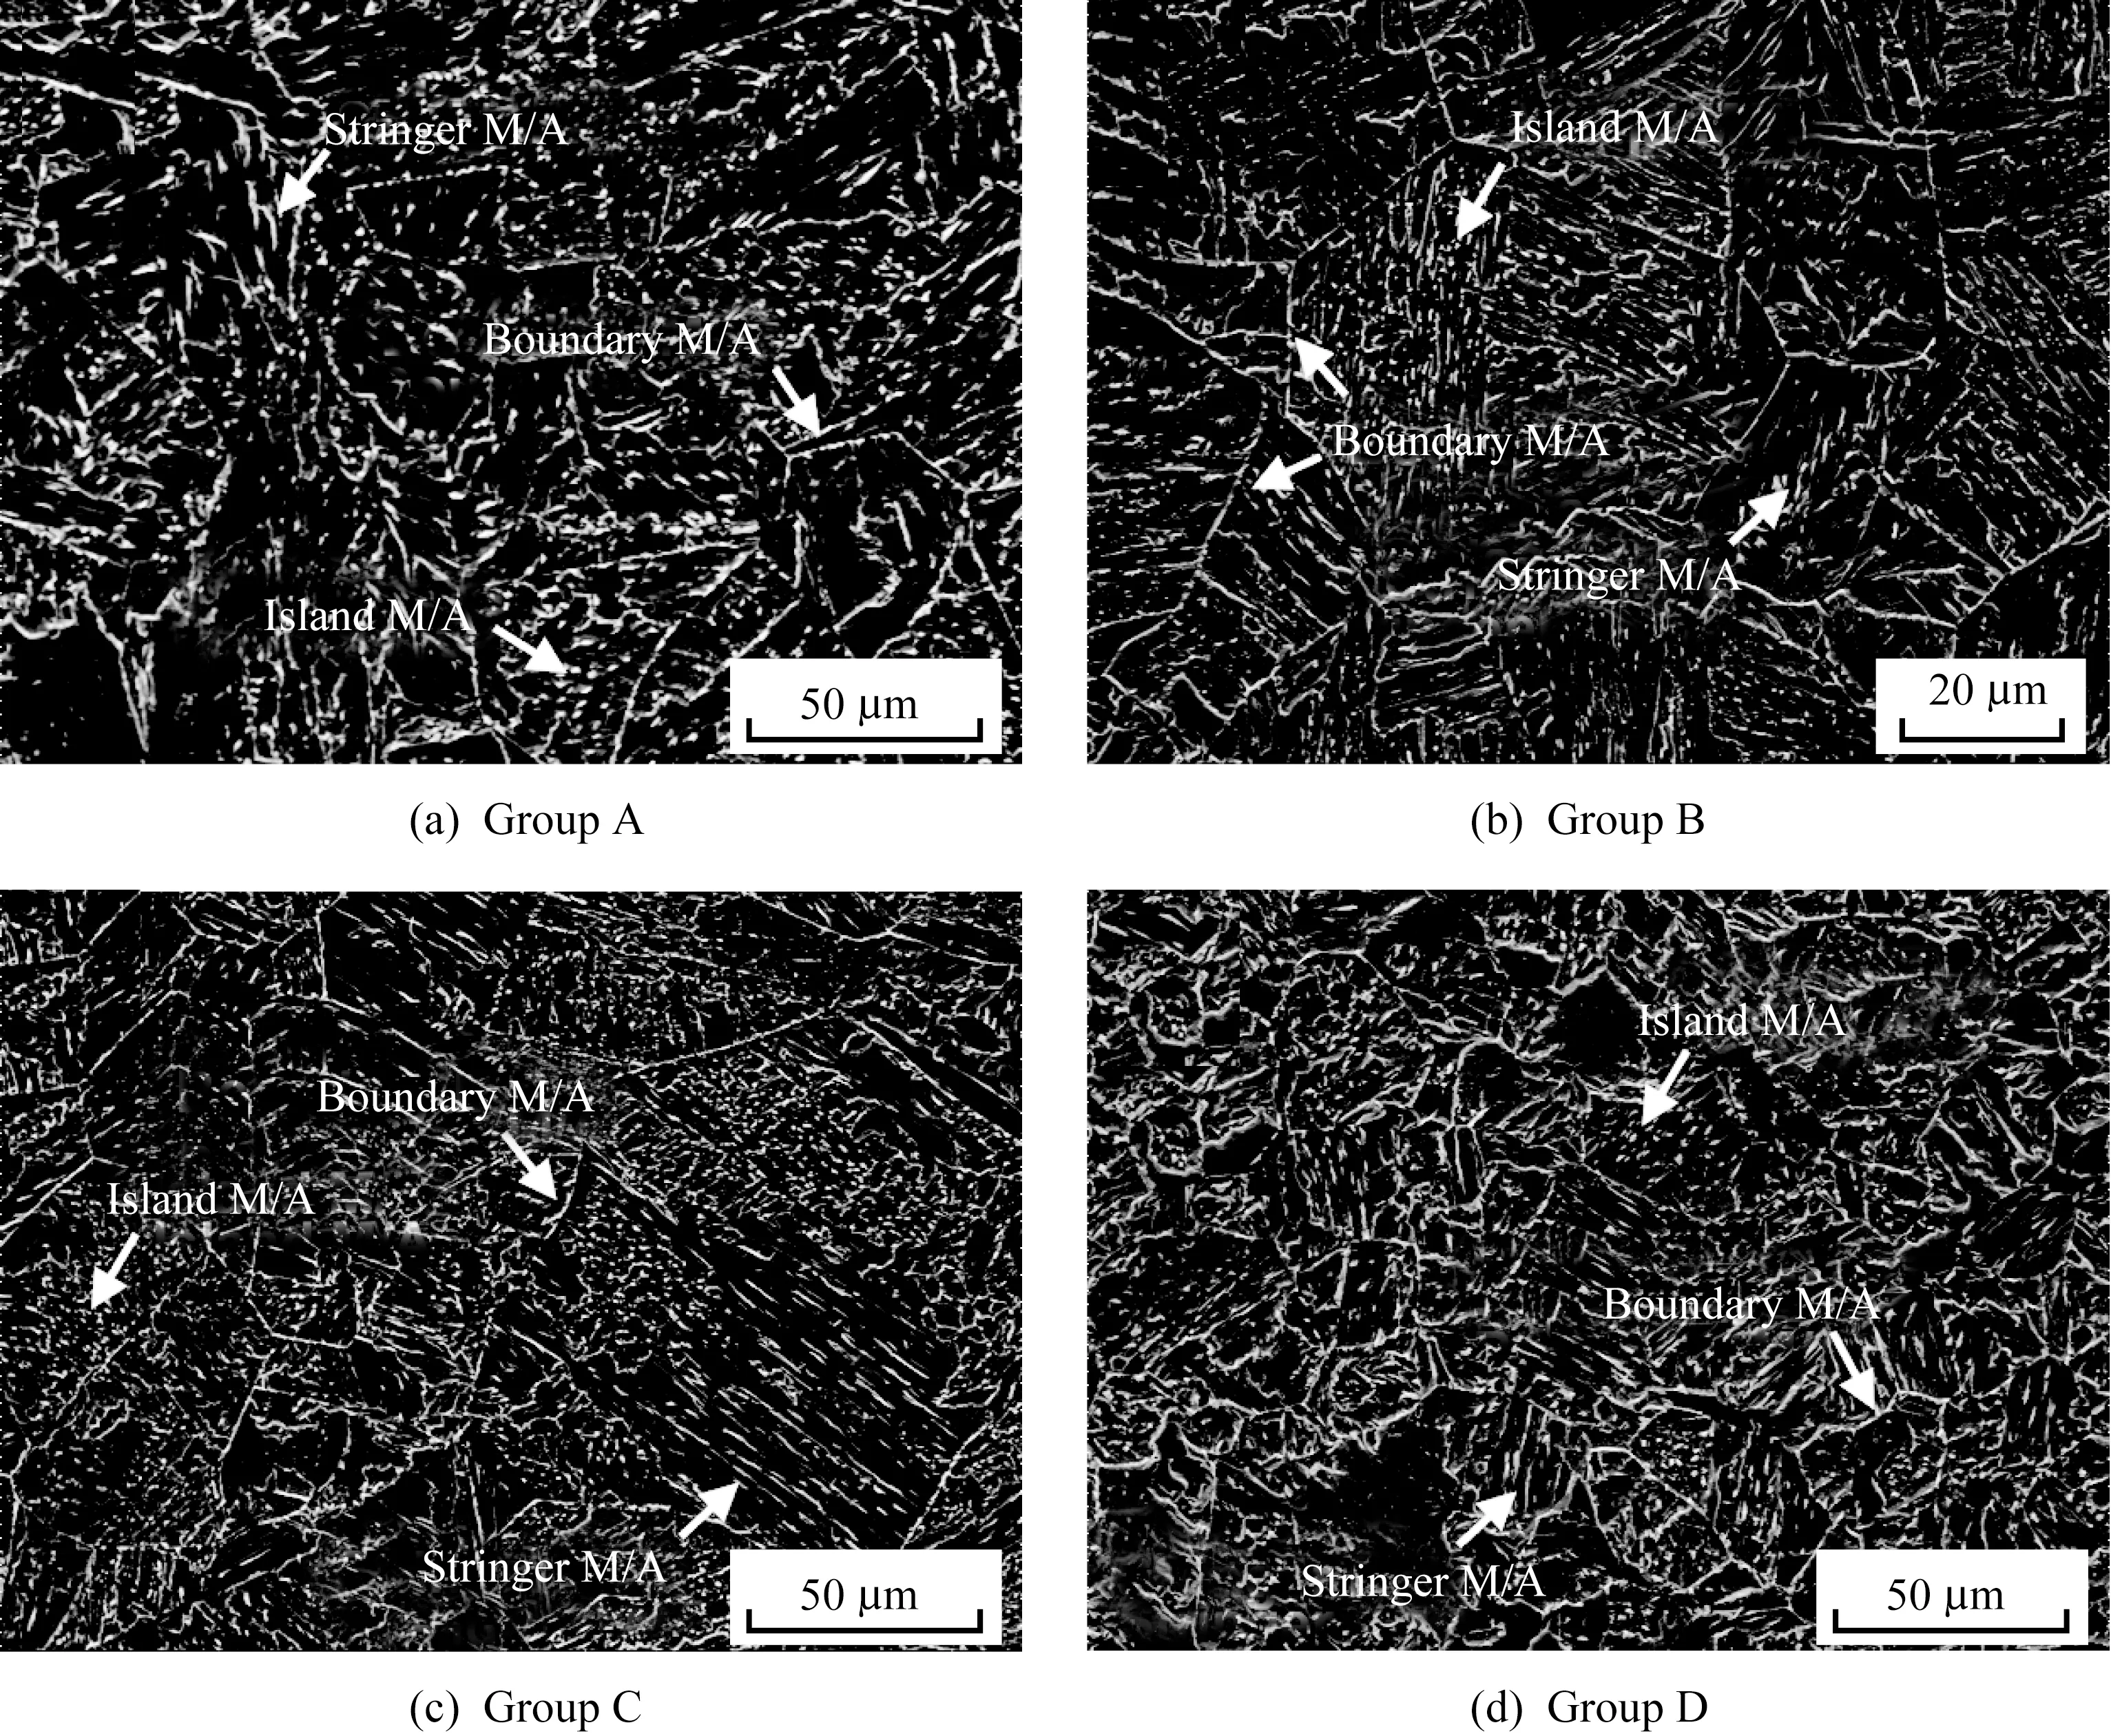
Fig.4 SEM microstructure of samples under different simulated parameters
To reveal the distribution feature of M/A com-ponents more intuitively,Lepera etchant was used to etch different samples,and then the etched samples were observed by an optical microscope.Notably,the samples in this study were not pre-etched by nitric acid before being formally etched with Lepera solution,as in Ref.[12],resulting in M/A constituents appearing as black islands in the field of view.Thus,the distribution law of M/A com-ponents under different thermal welding thermal simulated parameters can be observed,as indicated by the yellow arrows in Fig.5.Few boundaries gathered with M/As can be found in group A samples,as shown in Fig.5(a).In comparison,the tendency of M/As aggregating on PAGBs is more evident in the other three groups of samples,which is mainly reflected by increasing quantities and im-proving discontinuity,as shown in Figs.5(b)-(d).This result indicates that the number of boundary M/As is closely influenced by the heat input since thet8/5of the last three groups of samples is relatively larger than that of group A samples.This finding can be explained by the formation process of M/A components.In the initial stage of bainite transformation during the cooling procedure,BF transformed from austenite has a low supersatu-ration of carbon.Meanwhile,the diffusion capacity of carbon is strong at this moment,so it would quickly diffuse into austenite and greatly improve its stability,especially along PAGBs,because the grain boundary is always a fast diffusion channel of elements.Consequently,a large amount of carbon-rich retained austenite is retained along PAGBs at low temperatures to form M/A constituents[13].In this study,as the heat input increases,the cooling rate decreases,and the phase transformation driving force decreases accordingly.As a result,a larger number of carbons have difficulty diffusing and enriching along austenite boundaries,eventually forming consecutive M/A constituents on PAGBs.
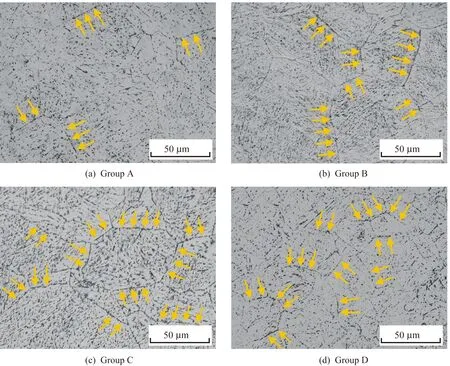
Fig.5 Distribution of M/A constituents in samples under different simulated parameters
Aside from the distribution feature,the number of M/A components can be obtained here by counting them using Image Pro-Plus 6 software.The quan-titative data of M/A of groups A-D samples are 7.76%,11.64%,13.58%,and 8.12%,respectively.The number of M/A components increases as the heat input increases.The increase in M/A components accounts for the increase in microhardness and the decrease in impact toughness of samples in groups B and C because M/A constituents belong to the hard and brittle phases in steel and have poor strength matching with matrix[14].
In this investigation,to reveal the changes in dimensions and evolution of substructures of M/A components in different simulated samples,TEM was used,and the results are shown in Fig.6.Consistent with the characterization results of SEM and OM,M/A constituents are observed aggre-gating on PAGBs (respectively instructed by yellow and white arrows) in samples.There are some differences in M/A features between these samples,including the morphology and dimensions of M/A components and their substructures.
M/A constituents in samples in group A are similar to narrow and long strips with enriched carbon and few breaks.As the heat input increases (groups B-D),M/A constituents change from strip-like into island-like,and the interior of the M/A island begins generating lath martensite structures.The selected electron diffraction patterns from the M/A island (as shown in Fig.6(c)) suggest the existence of a body-centered cubic structure (martensite),which is in agreement with findings in a previous study[15].However,note that the lath-like substructure is very clear in samples of groups B and C,whereas that in group D samples is relatively incomplete.This finding demonstrates that increasing the peak temperature has less of an effect on substructural sizes changing than increasing the heat input,which is consistent with the law of grain size change with simulated parameters discussed above.

Fig.6 The M/A constituents along PAGBs in samples under different simulated parameters
A detailed measurement was performed on the overall dimensions of M/A islands in the last three group samples.Notably,the changes in the dimension M/A are described here by the mean length,which is defined as the average value ofLmaxandLmin,as shown in the illustration in Fig.6(b).In this way,the dimensions of M/A islands in the group B-D samples are 0.66 μm,1.90 μm,and 1.45 μm,respectively.According to a previous study[16],an increase in M/As’ dimension would favor crack nucleation and,hence,degrade tough-ness.Lee et al.[17]pointed out that a M/A con-stituent with a mean length greater than 2 μm could become a source of crack.In this study,although the dimension of boundary M/As does not reach this critical size,it will also strongly induce crack initiation,as shown in Fig.7.The results reveal the crack initiation and propagation behavior observed on the cracking source plane (obtained by grinding im-pact fracture specimens along the thickness direc-tion,as shown in the illustrations in Fig.7(a),where the dashed lines in the illustration represent the original size of the impact fracture sample).Fig.7(a) shows that crack initiation at the PAGB with several M/As gathered on,and Fig.7(b) depicts a similar characteristic of crack initiation behavior.This result confirms the facilitating role of boundary M/As in crack initiation mentioned above,and this is the result of stress and strain con-centration caused by several factors.First,as a type of hard and brittle phase in steel,a M/A constituent has poor strength matching and coordination with matrix,and stress tends to concentrate near its inter-face[18].Second,M/A constituents along PAGBs are always observed in weird shapes with sharp corners (as shown in Fig.6),which would substan-tially increase the level of strain concentration near themselves.Third,because of the shear coherent property of bainite when it is transformed from austenite,PAGBs are coherent and always have very high strain energy[19].Thus,when wired M/A constituents aggregate on PAGBs,the state of strain concentration on boundaries superimposes and multiplies,especially at grain boundary intersections with M/As,as shown in Fig.6(d).THOMPSON and KNOTT[20]pointed out that fracture cracks would start to initiate once the stress concentration near a grain boundary reached a threshold value.That is,intersection locations on PAGBs are always in an ultra-high strain concentrate state and will make it a good site for fracture initiation,as observed in Fig.7(a).In addition,a small-sized and spherical inclusion with some voids surrounding can be found near the crack in Fig.7(b).It strongly indicates that this type of inclusion is not the direct cause of crack initiation.The influence of different inclusions on toughness will be further discussed in the next chapter.
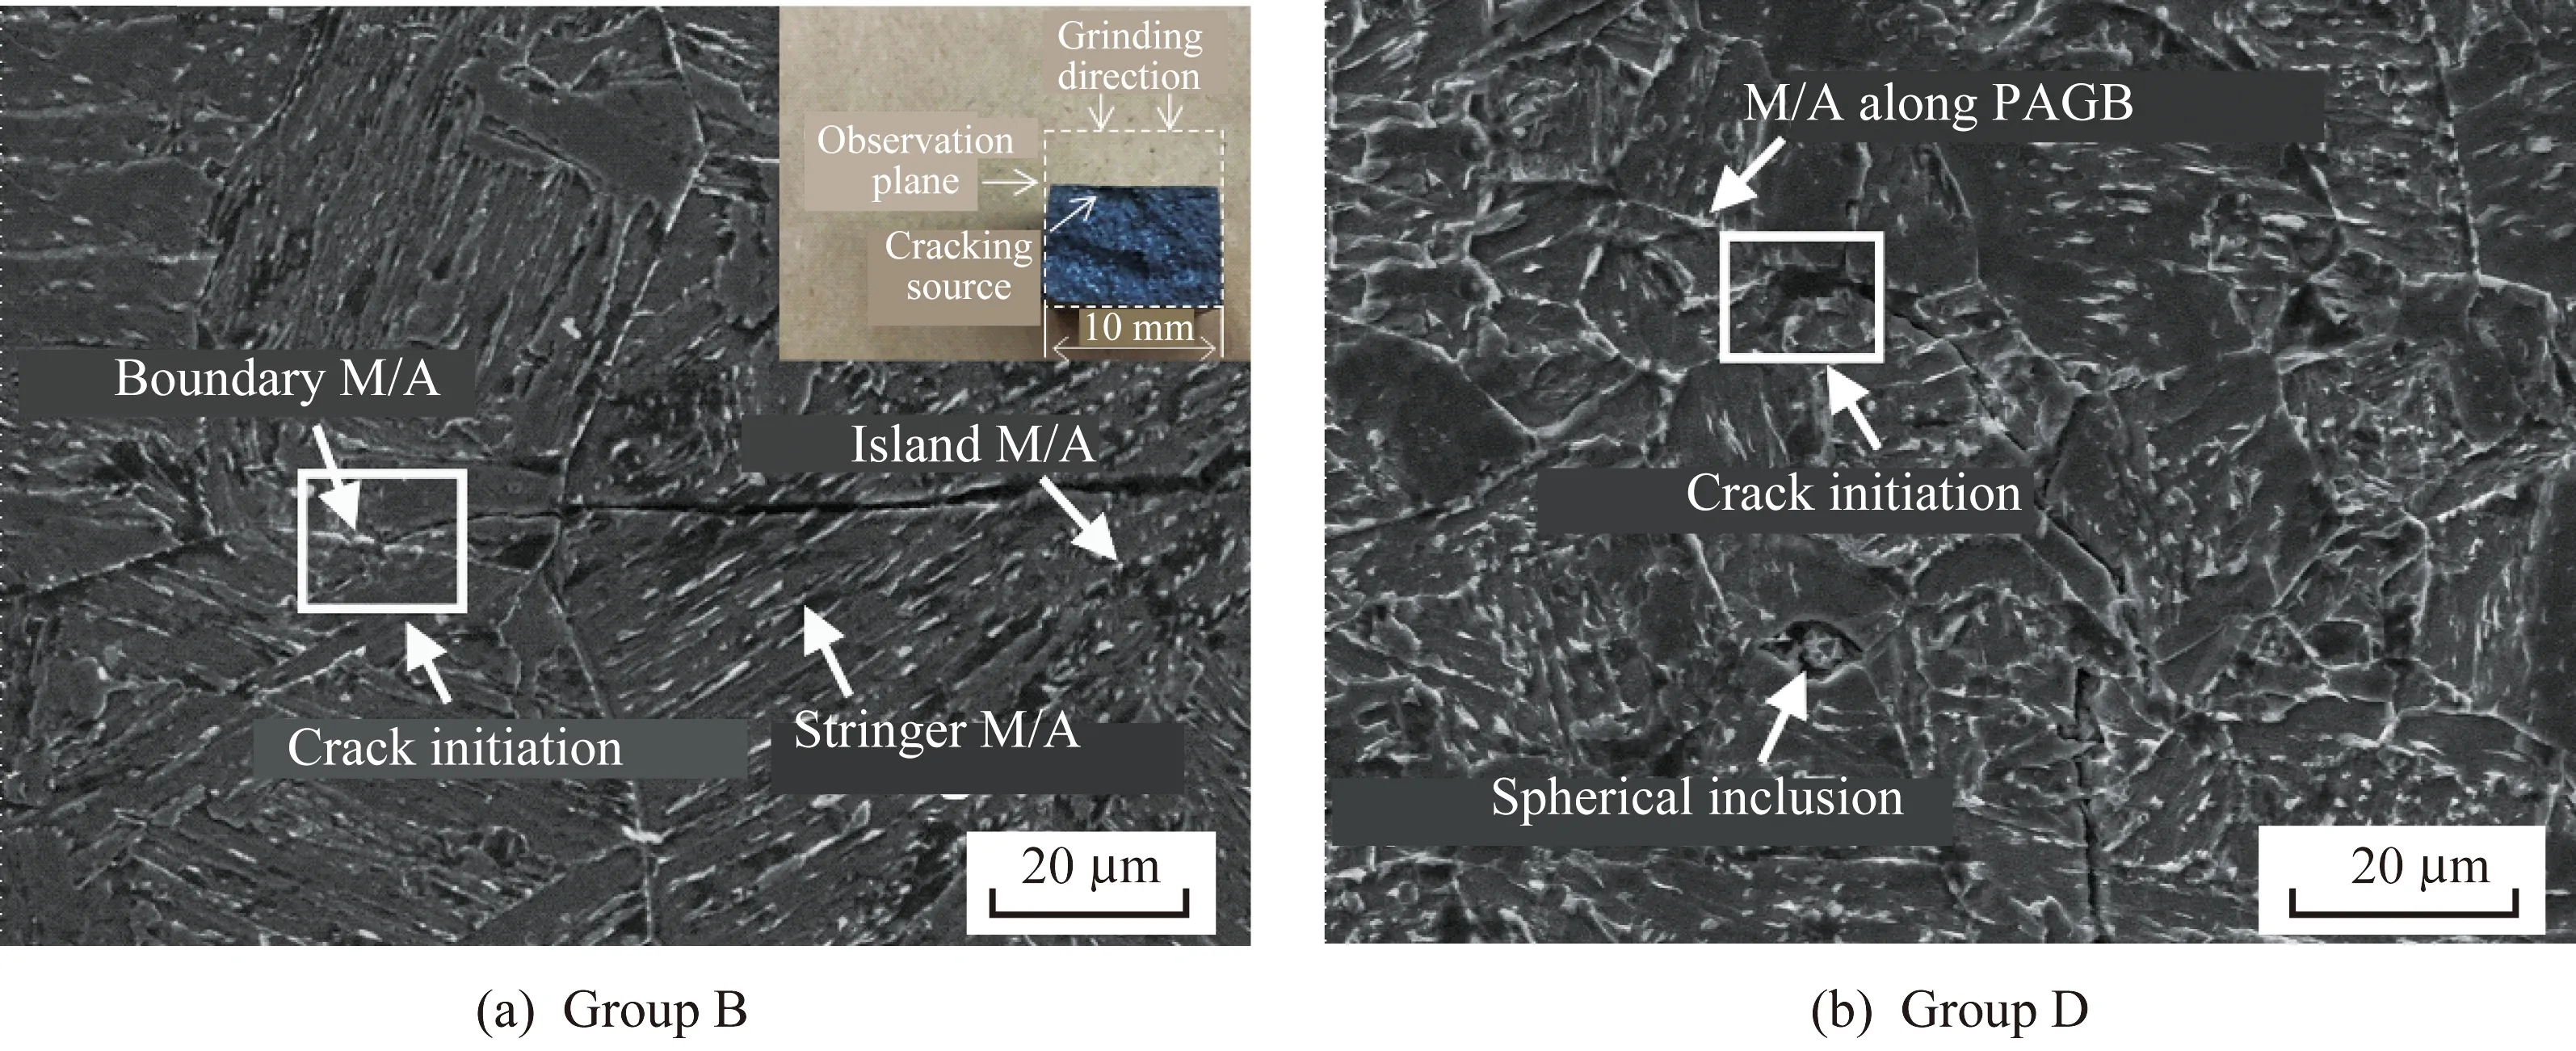
Fig.7 Crack propagation behaviors on cracking plane in specimens with minimum absorbed energy
The changes in substructure in M/A islands can also be obtained by TEM,including the width of the lath martensite substructure and its volume fraction.The substructural lath width of M/A in group B samples is very small for approximately 30 nm,as shown in Fig.6(b).When the heat input is kept constant and the heating peak temperature is reduced to 1 150 ℃,the lath width is slightly reduced to 24 nm.When the heat input increases,the width of martensite laths increases drastically.From the measurement results,the maximum lath was 420 nm.Spontaneously,an increase in the martensite lath width will increase the volume fra-ction of the martensite zone transformed from retained austenite internal to the M/A islands.Notably,the volume fraction of the lath martensite substructure refers to its proportion relative to a single M/A island rather than the entire field of view,and it is counted by the two-color chart con-verted from TEM images as in the previous study[21],as shown in the illustration in Fig.6(b).Through measurement,the volume fractions of the martensite zone of groups B-D are 37.85%,65.38%,and 36.05%,respectively.An increase in the martensite fraction degrades toughness.LAN et al.[22]reported that the austenite zone inside the M/A island belonged to a microregion with high toughness,and hence,increasing the austenite area in the M/A constituents would improve toughness.KRAUSS[23]pointed out that the strength and stiffness of the martensite microzone inside M/A constituents were higher than those of both the austenite zone and the matrix.As a result,an increase in the martensite fraction and a decrease in the austenite zone will inevitably generate a larger high strain,which may degrade toughness.Thus,an increase in the size and volume fraction of the lath martensite zone will intensify the stress and strain concentration state around it,thereby increasing the risk of crack nucleation.
3.4 Inclusions
The characterization results of representative fractured surfaces are shown in Fig.8.Figs.8(a) and (b) are the fractographs of selected samples in group B,and they present the characteristics of mix-mode fracture.The plastic fracture zone (upper half part separated by white dot lines) and brittle fracture zone (lower half part) simultaneously exist in the cross-section.The high magnification images show that the microstructure of the plastic fracture zone is unequal-sized dimples,and there are some small and rounded inclusions (less than 3 μm) embedded in these dimples.EDS analysis shows that the inclusion is composed of C,O,Mg,Al,Si,Ca,and Fe,as shown in Fig.8(b).However,no obvious inclusion or second phase can be found in the cracking source located in the brittle fracture zone.A similar phenomenon has been found in other fracture samples in this experiment as well.That means small and spherical inclusions are not the immediate cause of cracking,which is consistent with the phenomenon observed in Fig.7 (b).
By contrast,some grotesque inclusions with a large size (more than 20 μm) were found in some fractures,such as the flaky ones shown in Figs.8(c) and (d).They are located in the true center of the cracking source,and hence,they are unquestionably the direct inducement of fracture initiation.The EDS results show that they are oxidized inclusions.
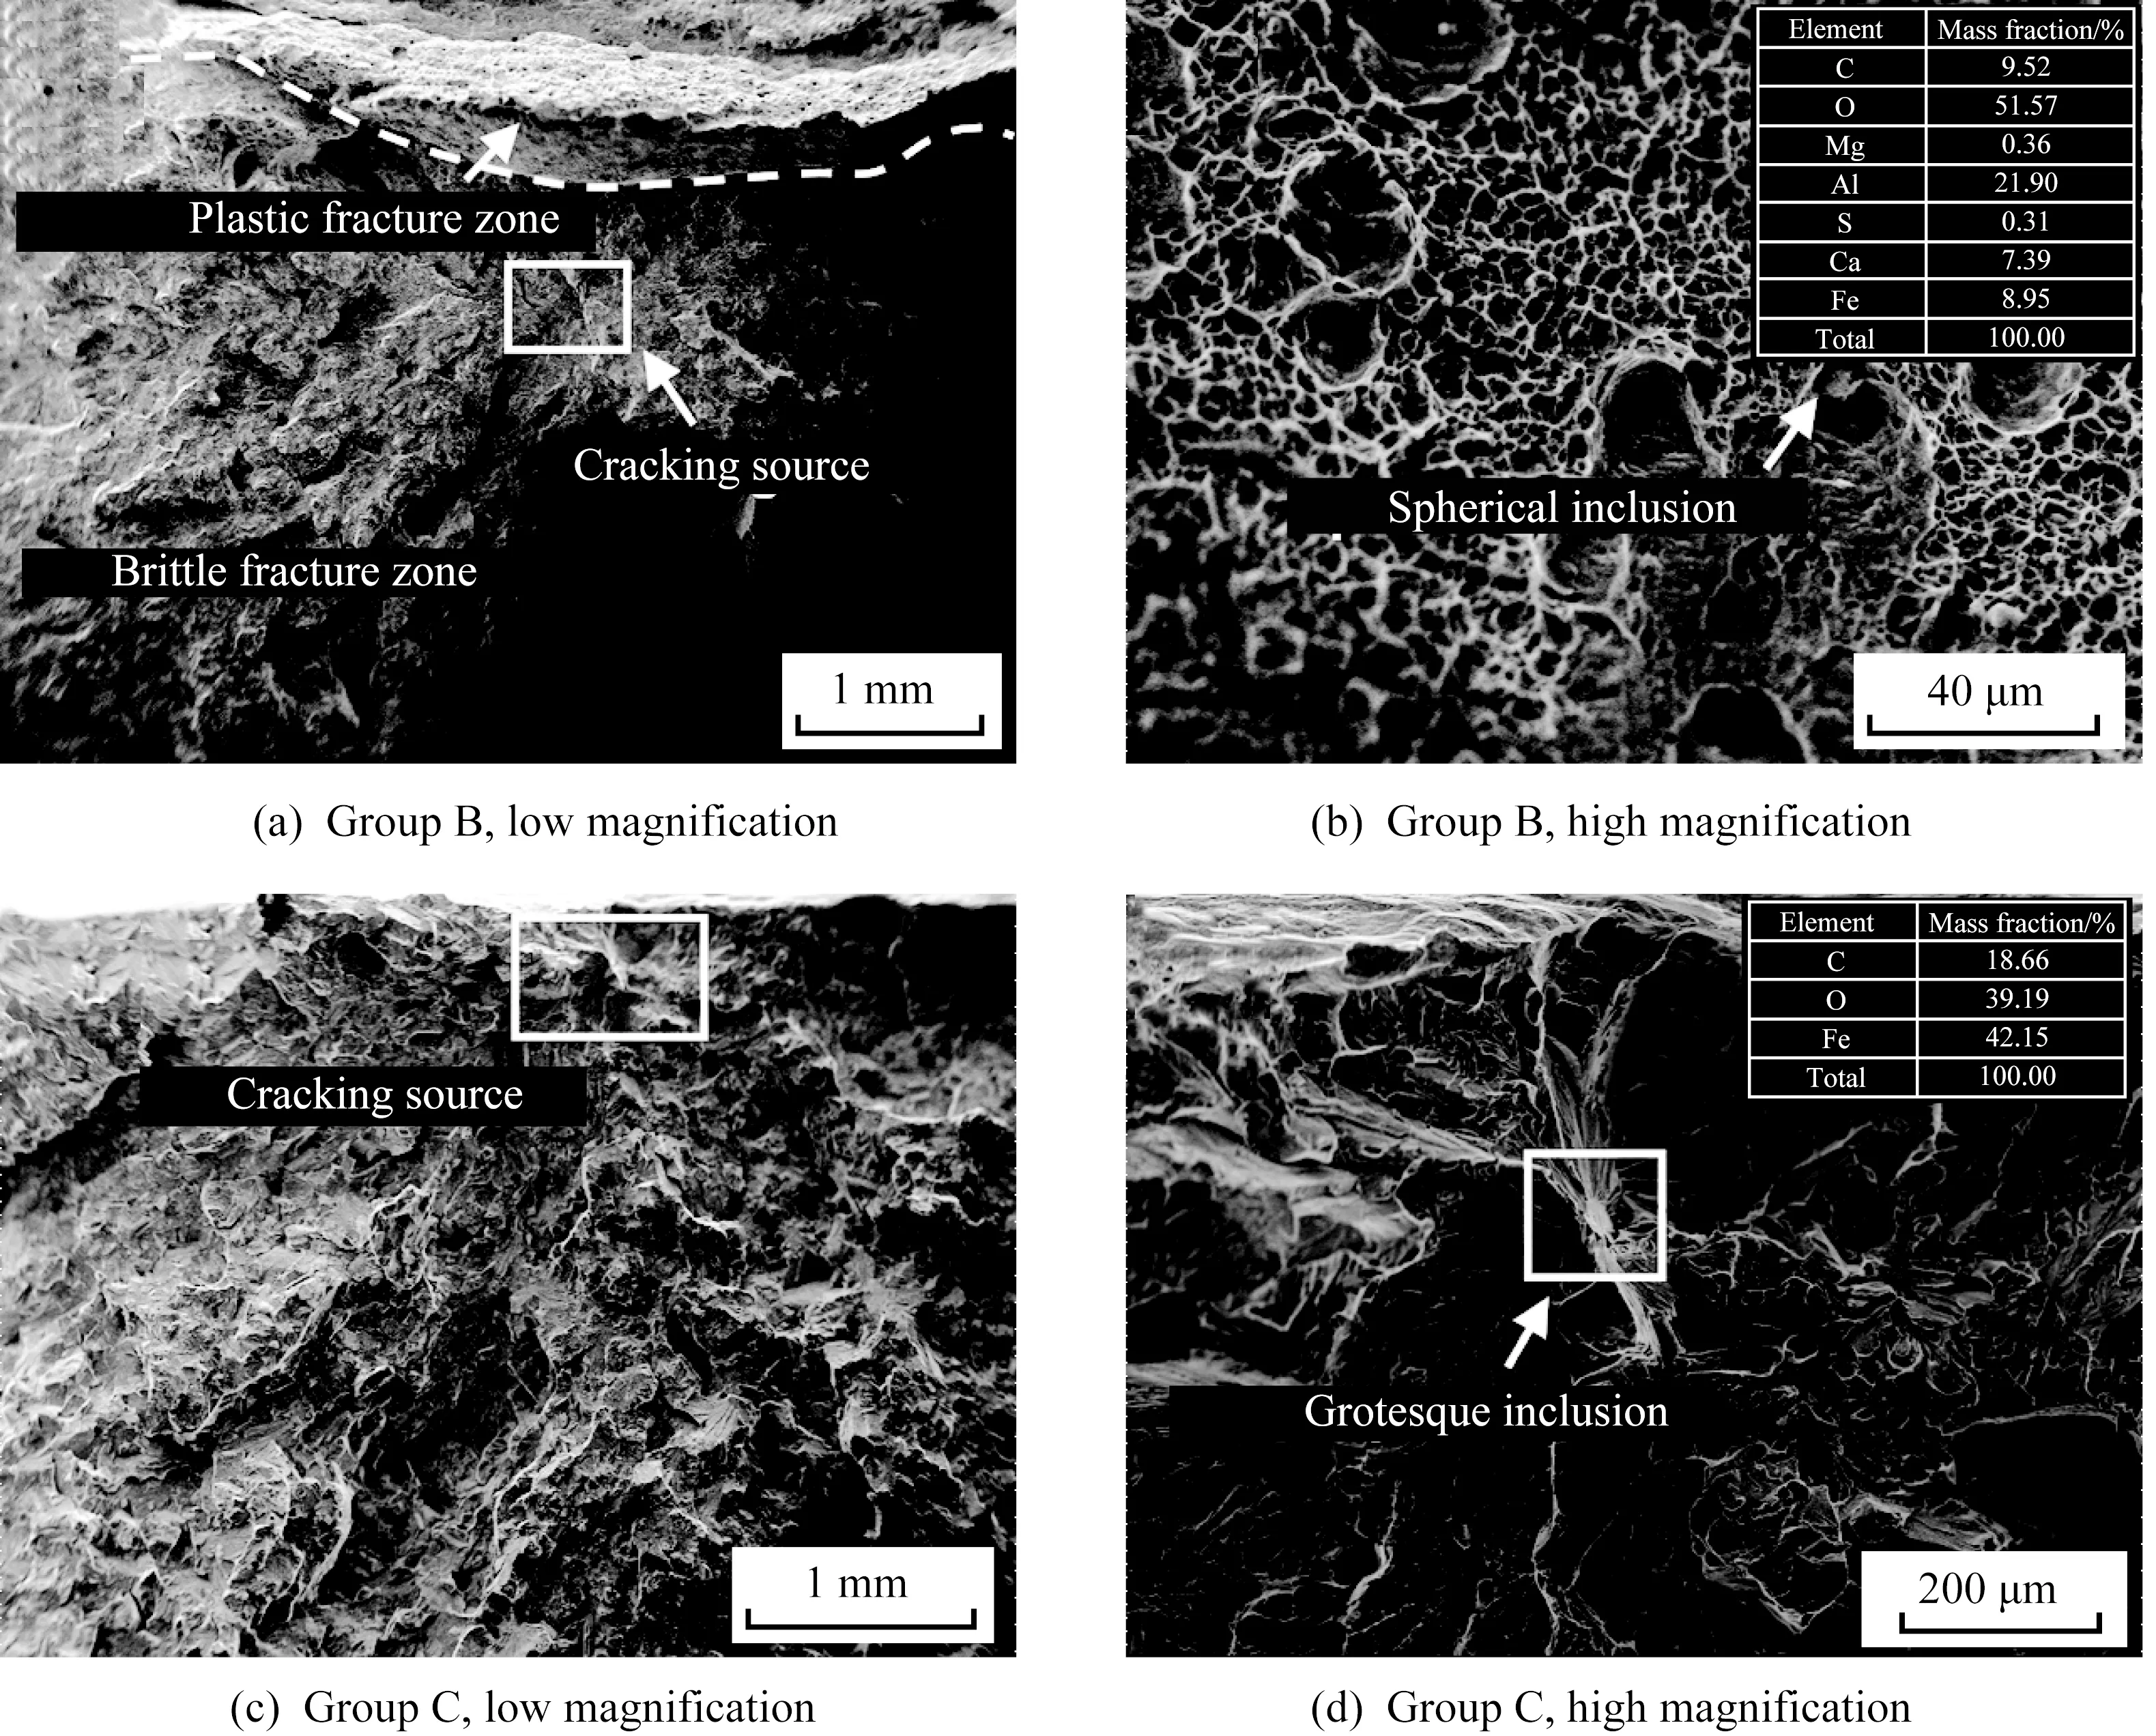
Fig.8 Fractographs and SEM-EDS analysis of representative fractured specimens of impact toughness test
Therefore,small and spherical inclusions are not the immediate cause of cracking,whereas large and grotesque inclusions,similar to boundary M/A constituents along PAGBs,are the direct inducement of fracture initiation.
4 Conclusions
(1) As the heat input increases,the number of M/A components increases,resulting in increased microhardness and decreased toughness.Meanwhile,M/A components tend to aggregate more along grain boundaries.
(2) PAGBs aggregated with M/A constituents,especially at intersections with M/As,were observed to be the preferred sites for crack initiation.
(3) Increases in heat input would contribute to an increase in both overall dimensions of M/A and the width and volume fraction of the lath martensite substructure inside M/A components,which would increase the risk of crack initiation,intensifying the deterioration of toughness of steel.
(4) Large-sized grotesque inclusions would di-rectly induce crack initiation and decrease the tough-ness,whereas small-sized and spherical inclusions were not the immediate cause of cracking.
杂志排行
Baosteel Technical Research的其它文章
- Influence of shielding gas on the transfer behavior of droplets
- Microstructure and properties of laser-arc hybrid welding of high-strength low-alloy steel
- Hot cracking susceptibility research in BTW1 austenitic high-manganese wear-resistant steel
- Research status of corrosion environment failure and safety assessment of pipeline welded joint
- Analysis of inclusions and precipitates in tough weld metal of X80 steel
- Preface