Different hybrid machine intelligence techniques for handling IoT‐based imbalanced data
2022-01-12GauravMohindruKoushikMondalHaiderBanka
Gaurav Mohindru | Koushik Mondal | Haider Banka
1Department of Computer Science and Engineering,IIT(ISM)Dhanbad, India
2Department of Computer Centre,IIT(ISM)
Dhanbad,India
Abstract In the era of automatic task processing or designing complex algorithms,to analyse data,it is always pertinent to find real-life solutions using cutting-edge tools and techniques to generate insights into the data.The data-driven machine learning models are now offering more or less worthy results when they are certainly balanced in the input data sets.Imbalanced data occurs when an unequal distribution of classes occurs in the input datasets.Building a predictive model on the imbalanced data set would cause a model that appears to yield high accuracy but does not generalize well to the new data in the minority class.Now the time has come to look into the datasets which are not so-called‘balanced’in nature but such datasets are generally encountered frequently in a workspace. To prevent creating models with false levels of accuracy, the imbalanced data should be rearranged before creating a predictive model. Those data are, sometimes, voluminous,heterogeneous and complex in nature and generate from different autonomous sources with distributed and decentralized control.The driving force is to efficiently handle these data sets using latest tools and techniques for research and commercial insights. The present article provides different such tools and techniques, in different computing frameworks, to handle such Internet of Things and other related datasets to review common techniques for handling imbalanced data in data ecosystems and offers a comparative data modelling framework in Keras for balanced and imbalanced datasets.
1 | INTRODUCTION
Bare environment sensors or smart hand-held devices generate data at an unprecedented rate in the era of Internet of Things(IoT)-driven world. The IoT paradigm is an emerging technology that is expected to connect 30 billion heterogeneous objects through the Internet by 2020[1].It is not so difficult to handle a dataset with sufficient numbers of data points if it is found that the number of data points are more or less the same in two class classification models or multiclass data models.The trained model that was built using this dataset will perform as per the authors'expectation.These data points are popularly known as balanced datasets. But the problem will start when skewed datasets such as under-represented data or overrepresented data is obtained for designing a data model for predictive analysis.Such datasets are frequently encountered in predicting rare diseases, email spam-based detection, fraud transaction detection, crime incident detection, road accident alert detection, electricity theft detection, handling seismic hazards in mining etc. in daily professional engagements. The data capturing techniques in each case may be enabled with IoT sensors. Nowadays, most of the IoT driven business houses provide channel details to capture the world wide data through already enabled sensors[2].It is required to subscribe to those stream channels to enable to receive sensor captured data against a valid subscribe key. The data imbalance may be found in different forms such as intra or interclass,extrinsic or intrinsic, relative or absolute rarity and only having small sample size in hand. If any predictive analysis model is designed based on this unbalanced dataset, the biased result will be obtained at disposal.The emerging tools and techniques in IoT environment are going to impact the quality of analyses in many aspects which provide seamless integration of information and communication technologies for a better tomorrow. The enabling X-information technologies are heavily dependent on different computational intensive techniques [3]. The data generated through next generation smart computing-based IoT enabled devices need to integrate seamlessly with proper presentation and storage for efficient processing. Proper visualization techniques with exploratory data analysis may be used. It will be of great help to demonstrate the ability to build an environment for heterogeneous datasets, be it, large or small [4]. Hybrid approaches to handle imbalanced data include both data level methods and algorithm level methods to counter the issue. Data level methods are using different sampling techniques to minimize the imbalance in data,whereas the algorithmic approaches provide some cost adjustment scheme in the learning parameters during the model building.
The motivation of this research is to offer a computational environment for handling different imbalanced datasets by ensemble of different base models to obtain better predictive performance. The general neural network models are nonlinear in nature and have a high variance which may lead to a high convergence time-induced model.Ensemble techniques usually help in reducing variance of the predictions as well as reduce the generalization error. Moreover, if the model has been trained with imbalanced datasets, it basically produces over-classify outcomes due to its prior bias and it will not be able to offer judicious treatment to the instances of the feature vectors that belong to the minority class.
The importance of the proposed solution is to deliver an unified environment which will be able to handle all types of datasets, be it batch or stream, to offer viable predictive solutions in an ensemble way.The proposed solution is enabling a hybrid ensemble approach which will address the basic inherent slowness of the machine learning architecture with back-propagation by adopting Adam optimization in Keras-TensorFlow enabled PySpark environment. Adam, derived from adaptive moment estimation, is an extension to the stochastic gradient descent (SGD) that has recently seen broader acceptance for deep learning and IoT applications in computer vision and natural language processing.Adam optimization is a combination of adaptive gradient algorithm(AdaGrad) and root mean square propagation (RMSProp) by accepting the positive learning tricks from both of these variations of SGD algorithm. Instead of adapting the parameter learning rates based on the average first moment to the mean as in RMSProp,Adam also makes use of the average of the uncentred variance which is popularly known as second moments of the gradients.The algorithm specifically calculates an exponential moving average of the gradient and the squared gradient by controlling the decay rates of these moving averages. This technique is used for providing algorithmic level solution. In the data level approach,popular sampling methods such as ROSE,SMOTE,Under and Over along with random forest (RF) have been used. These popular methods have their own pros and cons.Each individual technique comes up with RF modelling with repeated cross-validation and performs over- or undersampling on each fold independently to get better estimation of model performance.
The article is organized as follows. Section Review of Literature provides an in-depth survey on the related works about handling the imbalanced data classification in the IoT era.The focus of this article is mentioned in Section Handling Imbalanced Data. Section Application Framework elucidates the computational approaches of different application frameworks that are used to handle both balanced and imbalanced datasets. The experimental results of application of the discussed methods are illustrated in Section Experimental Results.Section Discussion and Conclusion concludes the article with future directions of research.
2 | REVIEW OF LITERATURE
The pervasive influence of class imbalanced data is offered to relook into the available avenues to handle it efficiently. The article in[2]extensively discussed all three approaches viz.data level methods, algorithmic level methods and hybrid approaches to handle imbalanced datasets in different deep learning frameworks. The authors in [5] crafted detailed deliberations on different IoT-driven engineering fields and their use-cases with the ever-increasing demands of the application areas. Authors, in [6], presented different issues in designing big data models in parallel environments. Nonstandard machine learning models provide more fruitful results in different big data domains as presented in [7]. Detecting frauds in balanced and imbalanced datasets with the help of modern deep learning technologies is also gaining interest in recent days [8, 9]. The author in [10] lucidly explained and created a new avenue of hybrid mechanisms of handling imbalanced data mentioning its challenges in the computational domains.Different association rules and tree-based approaches are also used in minimizing bias towards the prominent classes. The advancement of computing facility and algorithmic approaches facilitated researchers to develop different variations of the multilayer perceptron and convolution neural network(CNN),such as feed forward neural network architectures, to bring overall improvements in accuracy. The seminal article in [11]described how deep learning gained tremendous popularity post-2006 due to these facilities in solving real-life problems with sufficiently large datasets. These architectures include recurrent neural networks, stochastic networks, autoencoders etc. that are capable of handling complex radar images to low power edge computing devices for balanced and imbalanced datasets,as described in,[12–14].Now with the advancements of Keras with the TensorFlow architecture,it is the beginning of another boom of IoT industries where data processing with the help of preprocessing quality management techniques offered a significant breakthrough as mentioned in[15].In cost sensitive (CoSen) CNN [16], the authors proposed a CoSen CNN model, eliminating the requirements of grid search procedure for unbalanced datasets. The deep learning hybrid approaches, mentioned in [17–19], are gaining popularity for the imbalanced data domains. The researchers are using popular libraries,packages and application programming interfaces(APIs) such as SMOTE [20], ROSE [21], adaptive synthetic(ADASYN) [22], PySpark [23], CARET [24] etc. for handling imbalanced datasets along with balanced datasets in an effective manner.
Several machine learning algorithms are available for building predictive data models. The accuracy of the model does not only depend upon how good it is predicting a negative class but also at identifying the positive class.Even if a model offered 90% accuracy, the rate of classifications of the above two classes has to be checked. If a skewed percentage between these two classes is found, sometimes, it is due to imbalanced data set working in the background.In that case,it has to be moved with some preprocessing sampling techniques or some algorithmic techniques or both to offer a sustainable model for analysis. For executing any successful data model building,the whole process may transit through six phases viz.data discovery, data preparation, model planning, model building, communicating the results and operationalise the model for real-life data. It involves collecting, classifying,summarizing, analysing, organizing and interpreting scientific and nonscientific data for better decision-making and conclusion. The key basic assumptions of regression analyses viz.linear relation, no autocorrelation, no/small multi-collinearity,multi-variate normality and homoscedasticity are also the prevailing characteristics of the candidate datasets [25].
Data level techniques, algorithmic techniques or hybrid approaches are the most commonly used methods to deal with class imbalanced datasets.Data level techniques include undersampling or random under-sampling and over-sampling or random over-sampling to modify the skewed distribution in training data by eliminating or reducing the level of imbalance and noise. Under-sampling works by reducing the size of the abundant class voluntarily when sufficient amount of data is available.The popular approach K-nearest neighbour(K-NN)with its different variants, mentioned in [26, 27], is used extensively for the under-sampling data processing which more or less removes the misclassified data from the training samples or its boundaries.The under-sampling methods are of two types: random and informative. EasyEnsemble and Balance-Cascade methods tackle informative under-sampling. Oversampling, on the other hand, creates a superset by replicating the minority data class to bring balance and indiscrimination in the data set.There are different variants of interpolating-based[13], SMOTE-based [20] and cluster-based [28] approaches available to settle down over-sampling issue in the data level techniques. The popular problem of over-sampling is over fitting of the data which is unable to generalize the data model to a new data set due to its high variance and proximity of the training data.
The algorithm-based techniques are handling the issue by changing the process of model design rather than data manipulation. In this case, researchers are using different variants of three main algorithmic approaches viz. cluster based,threshold based and cost matrix based as described in [20, 22,28]. It is also good to think to collect more data so as to get either more data to the minority class or to bring an imbalance in the data sets.When there is hardly any scope to find the data for the analysis and the data sets, and the data in hand is imbalanced in nature,then the discussed methods will be used to remove skewness in the data sets. The CoSen classifier approach adopts some cost sensitive methods to train the models.It basically uses different modified versions of decision trees to train the models. These are classic decision trees in nature with adjusted thresholds to obtain the most accurate points. There are broadly two categories of cost CoSen methods: meta learning and direct approaches. Meta learning process generally uses an external wrapper to make the non-CoSen learning to the CoSen one. On the other hand, in direct methods, we generally inculcate CoSen approach within the algorithms by tweaking some learning parameters. Now deep learning algorithms are also used in this technique to get more viable solutions.
The existing popular solutions comprise under-sampling,over-sampling, CoSen modelling, SMOTE and ADASYN. In under-sampling,balanced dataset are created by eliminating the sample of the majority class. Under-sampling of the dataset is attributed loss of useful information. On the other hand, by creating copies of the existing dataset, over-sampling tried to balance the dataset. It may be random copies of the subset of the data. It causes over-fitting of the model which is, most of times, computationally expensive in nature. SMOTE-based method synthetically generates the sample data instead of replacing the existing samples or by putting more data samples in the minority class. The problem with the SMOTE-based approach is to add noise in the dataset which is not desirable. CoSen modelling does not create balanced data distribution. Instead, it highlights the imbalanced learning problem by using cost matrices which describe the cost for misclassification in some cases. It has been found that the CoSen modelling has many a times outperformed the sampling methods. ADASYN is based on the idea of adaptively generating minority data samples according to their distributions using KNN.The algorithm adaptively updates the distribution and there are no assumptions made for the underlying distribution of the data. The algorithm uses Euclidean distance for KNN algorithm.The key difference between the SMOTE[20]and ADASYN[22]is that the latter uses a density distribution,as a criterion to automatically decide the number of synthetic samples that must be generated for each minority sample by adaptively changing the weights of the different minority samples to compensate for the skewed distributions.
In hybrid approaches, a combined work flow of the data level and algorithmic level approaches is used to handle the imbalanced datasets. In this process, a combination of upsampling, down-sampling, data augmentation and ensemble methods is used to deal with the situations. SMOTE [20],ROSE [21] and ADASYN [22] are popular software-based hybrid approaches available for efficiently tackling the imbalanced environments. The basic problem of the general machine learning architecture with a back-propagation algorithm is the slow convergence rate of the model.This slowness is due to the effect of the weight of the majority class,which is quite high in gradient descent than that of minority class [29, 30].The authors are interested in show casing the handling of the imbalanced data sets in the recent Keras-TensorFlow deep learning architectures with different python packages that make the process easy to build a model by removing the inherent slowness of convergence.
3 | APPLICATION FRAMEWORK
IoT data gives a greater temporal and spatial granularity about processes and events than other data sources. The open data model approach is the main enabler of collecting data for IoT and big data environments.It is always challenging to design an interface for the IoT data framework.The framework is known to be a less susceptible robust framework if it takes into account evolution in data patterns and changes in volumes over time. The mathematical data expansion model provides the evolution and deformation of patterns to study the data characteristics.The technology-driven IoT world slowly shifted to the market-driven world with the increasing use of different sensors as per the demands of the various services. Different network infrastructure models like low reliable Zigbee, Wi-Fi,low power WAN or high reliable cellular solutions are handled by the deployment authorities who decide to implement them for different IoT-based solutions based on the CAPEX and OPEX models. These models along with deep learning algorithms helped to create probabilistic inference on statistical models for large scale IoT data sets. The generality of programming constructs along with the probabilistic programming helped to deal with more complex models as well as large data sets.
The generalized model for the data expansion is based on the standardization using the standard score formula,which is also known as Z score defined by Berry and Lindgren [31] as follows:

where μ represents the mean and σ represents the standard deviation and the variable z is assumed to follow the Gaussian/normal distribution when the parameters μ and σ are known.If population parameters μ and σ are replaced with respective sample mean ~x and sample standard deviation sxin the standardization process, then Equation (1) can be rewritten as follows:

where t represents the standard score, following a student's tdistribution, as mentioned in [32]. Now if it is interpret in different manner for standardization process, then it can help to formulate big data applications. It is assumed that n observations x1j,x2j,…,xnjof the feature xjwhere j=1,…,p.It is also assumed that its population mean μ and standard deviation σ are not known and with (1 - α)% confidence; the following interval can be defined as:


where i=1,…,n and j=1,…,p.If the same is rewritten by rearranging, the following will be obtained:

Now the above equation is divided with 1+sxj≠0, and the following is obtained:

Hence, the weighted score on the left hand side can be taken as an approximated standardized score wijfor any large IoT data set application:

With the help of the above equation, the following parametrized data expansion model can be built, where the approximated standard score is scaled using a parameter β and mean-shift using the parameter α:
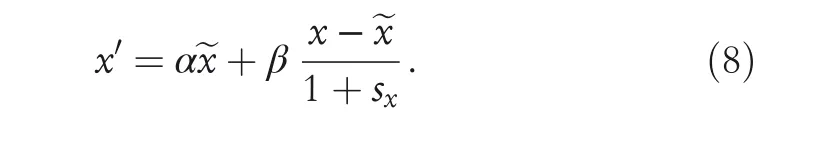
The parameters α and β are normalized. Proper values of α and β have to be selected to ensure orthogonalized properties between the classes. If all other variables are fixed,a one-unit change in the regressor variable xj(j = 1, 2, 3enleadertwodots k) changes the expected mean response by βjunits. The estimation of the parameters (α, β) is usually achieved through least squares, which is identical to the maximum likelihood estimation for independent normal errors. The controlling of model-wise error rate is one approach to addressing the value of such multiplicity problem. The Bonferroni method, for example, adjusts the significance level for the whole family of say, m, tests be(at-most) α, then the Bonferroni correction tests each individual hypothesis at the significance level αm. This is one way of adjusting α. Two distributions viz. Gaussian and uniform can be used to implement data expansion model for IoT data applications.
As most of the training algorithms presumed balanced data sets, it may happen to reach a suboptimal result while using imbalanced data sets. The general framework for guiding imbalanced data sets into a logical classification follows the below steps, more or less, to reach to a conclusion:
(i) Collect the IoT data sets either by offering stream details,channel names and subscriber keys or in the csv file and store the data in the desired format as per the framework requirements after preprocessing;
(ii) Construct different variants of RF or ensemble methods to handle the data imbalanced;
(iii) Using either of the data level, algorithmic level or hybrid approaches to reduce the bias in the data sets;
(iv) Using of cross-validation and other performance evaluation techniques to find the accuracy;
(v) Alter the RF tuning parameters accordingly and repeated the above steps for data level or set the hyperparameter tuning for the algorithm level and
(vi) Finalize the model as per the desired threshold limit.
Ensemble techniques are further classified into bagging and boosting. Boosting is an ensemble technique where the predictors are not operative independently, but sequentially.This technique deploys the logic in which the subsequent predictors learn from the mistakes of the previous predictors.The most effective boosting technique is the gradient boosting machine (GBM) and its different variants. The basic idea behind the development of GBM is to turn relatively‘poor hypotheses’ into ‘good hypotheses’. It is achieved with the help of either of the following: using adaptive boosting(AdaBoost)and/or generalization of AdaBoost using adaptive reweighting and combining techniques. Gradient boosting generally evolves with three basic elements viz. a loss function to be optimized, a weak learner to make prediction and an additive model to add weak learners to minimize the loss function. The selection of loss function depends upon the type of problem in hand such as for the regression type problem, least squared error may be used whereas for classification based problems, logarithm loss function may be used. Broadly, decision trees are used as weak learners in gradient boosting. Gradient descent procedure is generally used to minimize loss functions. To enrich GBM with more functionalities, the following factors are considered for setting enhancement viz. shrinkage, tree constraints, random sampling and penalized learning.
RF is an example of the bagging technique which is widely used as an ensemble method. Bagging is a basic ensemble technique where many independent predictors/models are combined them using some model averaging techniques such as majority vote, weighted average or normal average. RF is a tree-based algorithm that involves building several trees and subsequently combining their output to improve the generalization ability of the model. There are two stages in RF algorithm. In the first stage, an RF needs to be created, whereas in the second, a prediction is made from the RF classifier created in the first stage. The RF can handle over-fitting issues of boosting algorithm efficiently. The same RF algorithm can be used for classification as well as regression task. It also helped in reducing variance. Because of its in-built ensemble capacity, the task of building generalized model for all datasets turns out much easier. It can effectively handle thousands of input variables without variable selection. It can be used as a feature selection tool using its variable importance plot.
The concept of the bootstrap method with its aggregation,popularly known as bagging, is the key behind this predictive modelling.The bootstrap is a common but powerful statistical technique for estimating a quantity from a data sample.Bootstrap aggregation is a general procedure that can be used to reduce the variance for those algorithms which have high variance like classification and regression trees(CART).As it is known, prediction through decision trees is sensitive to the specific data on which they are trained.Combining predictions from different models in an ensemble environment works better if individual predictions of all sub-trees are weakly correlated or uncorrelated. In CART, when selecting a split point, the predictive algorithm is allowed to look through all variables and respective variable values in order to select most optimal split point. The RF algorithm changes this procedure so that the learning algorithm is limited to a random sample of features which are planned to search. Randomness in RF mainly refers to two processes viz. random observations for growth of each tree and random variables selected for splitting at each node. Another crucial point in the framework discussion is to finalize the performance related metrics for evaluating the models.
Two approaches have been discussed viz. data level techniques and algorithm level technique for handling imbalanced datasets. In the data level approach, popular sampling methods such as ROSE, SMOTE, Under and Over along with RF have been used. These popular methods have their own pros and cons. Each individual technique comes up with RF modelling with repeated cross-validation and perform over- or under-sampling on each fold independently to get better estimation of model performance. In the algorithm level,a sequential model with dense, dropout and dense layers has been created. ReLU activation function is used in the first dense layer and sigmoid activation function in the last dense layer with dropout attribute 0.5 in the middle.The ReLU activation function allows faster convergence in the training phase. The hyperparameter includes size of the hidden layers, learning rate, number of layers, number of iterations, epoch etc. that are required for tuning the model. In the optimization techniques to minimize the loss function,Adam optimizer has been used.
If classification on balanced datasets is considered,generally accuracy is used as a performance metric. The confusion matrix, as in Table 1, provides the basis of performance metrics. But as it is known that imbalanced data may make the model dumb by always predicting the majority class even if 95% of data is from negative class. Surprisingly,95% model accuracy will be obtained even if it only predicts a negative class. The false positive (FP) belongs to type I error and false negative (FN) is in type II error group,respectively. As these two are more dangerous than true positive (TP) and true negative (TN), thus some cost with FP and FN during the design of the cost matrix model is always associated. Out of FP and FN, FN is a more critical attribute to tackle with during the design of the model. The following performance metrics definitions are also useful for model evaluation:


TABLE 1 Basic confusion matrix

Accuracy and error rate are not sufficient for class imbalanced data sets. Though precision is sensitive to imbalanced data sets alone but it is not sufficient to derive any conclusion. Recall, on the other hand, is not sensitive to imbalanced class. F1-score, selectivity and G-mean are more powerful evaluation metrics than accuracy and error rate. The F1 score is the harmonic mean of precision and recall where β is usually taken as 1. It is commonly used in text processing when an aggregate measure is sought. Kappa or Cohen's Kappa is another classification accuracy, except that it is normalized at the baseline of random chance on the dataset.It is a more useful measure to use on problems that have an imbalance in the classes. The receiver operating characteristics(ROC) curve, proposed by [33], is a good general statistic for measuring the evaluation of the unbalanced class. It is equal to the values of a random true positive rate (TPR) over random false negative rate (FNR) in continuous plots. Any point on ROC graph, corresponds to the performance of a single classifier on a given distribution. It is useful because it provides a visual representation of benefits (TP) and costs(FP) of a classification data. The larger the area under ROC curve, higher will be the accuracy. There is always a trade-off between ROC curve (with subsequent calculations of area under ROC i.e. AUC curve) and precision-recall curve during evaluating of sustainable models.

FIGURE 1 Proposed framework of handling IoT data in machine learning domains

FIGURE 3 Heatmap of sensor captured data for preprocessing

FIGURE 2 Imbalanced breast cancer data set

FIGURE 4 Imbalanced data handling using data sampling approach

FIGURE 5 Imbalanced data handling using an algorithmic approach
4 | EXPERIMENTAL RESULTS

FIGURE 6 Imbalanced data handling using hybrid machine learning approaches

FIGURE 7 Evaluation using accuracy and kappa metrics

FIGURE 8 Setting up training parameters in Keras and TensorFlow framework

FIGURE 9 Evaluation metrics after resampled credit card imbalanced data
Three popular imbalanced data sets viz. breast cancer data set[34, 35], environment quality monitoring data set [36] and credit card fraud data set [37] are used in executing experiments. Collecting data using sensors and processing them after storing it in JSON or CSV is a challenging task.Thus, PySpark environment is created along with Keras and Tensorflow to capture the data and stored the same in structured way so as to enable to process the data smoothly.This is used in algorithm level technique. For data level,popular sampling methods such as ROSE, SMOTE, Under and Over along with RF are used. These popular methods have their own pros and cons. Each individual technique comes up with RF modelling with repeated cross-validation and performs over- or under-sampling on each fold independently to get better estimation of model performance.The proposed framework of handling IoT datasets, both stream and static, along with other attributes are depicted in Figure 1. It is pertinent to build the experiment environment ready for handling large IoT data sets. Once that is ready, rest of the processing is easy and as usual similar to other deep learning environments. The same is true for credit card fraud data set. With breast cancer data set, data sampling, algorithm based and hybrid approaches have been executed to encounter imbalance in the data set. Nowadays, hybrid ensemble approaches are finding edge over other data modelling techniques. In this experiment, RF and its variants created with ROSE, SMOTE, Under and Over approaches are used to handle imbalanced in data sets.
Imbalanced breast cancer data set in the decision tree format is depicted in Figure 2. This is clear from the figure that Node 7, Node 8 and Node 9 are holding imbalanced datasets. The heat map generated through IoT devices received data for decision-making is included in Figure 3. The heatmap shows the intercorrelations among all crucial variables. The PySpark environment needs to be enabled before processing environment monitoring static and dynamic data sets. Stream IoT data sets from PubNub [38] real-time publish/subscribe messaging API by mentioning channel name and subscriber key can be easily received. The ROC curve is formed by plotting TP rate (sensitivity) and FP rate(1-specificity). Different techniques viz. data sampling,algorithmic and hybrid approaches in guiding imbalanced breast cancer data set for generating meaningful insights are illustrated in Figures 4–6, respectively. The corresponding evaluation metrics are rendered in Figure 7. The training parameters used in Keras and TensorFlow framework for handling credit card data are reproduced in Figure 8 and subsequent predictive analysis parameters are delineated in Figure 9. The TP and FN are encouraging to apply these hybrid approaches. The accuracy received is around 98%.The estimation of classification errors received through different hybrid approaches is mentioned in Table 2. The results show that the hybrid approaches are working fine with the dataset and the minimal classification error in each approach encourages to work with more such hybrid methods instead of any individual technique.
5 | DISCUSSION AND CONCLUSION
The advancement of architecture-independent, scalable computing environment helped to build models that are sustainable and ensure the improved generalized capability of the predictive analytical modelling. It is now easily possible to manage approximately 3 lakh transaction static or dynamic data at one go. Different techniques can influence model performance. Sensitivity (or recall) describes the proportion of benign cases that have been predicted correctly, while specificity describes the proportion of malignant cases that have been predicted correctly. Precision describes the TPs,that is, the proportion of benign predictions that are actual from the benign samples. F1 is the weighted average of precision and sensitivity/recall. An ROC curve is a graphical plot that illustrates the diagnostic ability of a binary classifier system as its discrimination threshold is varied. It is a plot between TPR and FPR calculated by taking multiple threshold values from the reverse sorted list of probability scores given by a model. Another important consideration is that during the forward propagation, in the forward function for a layer l, what is the activation function in a layer (sigmoid, tanh, ReLU etc.) needs to be known. During backpropagation, the corresponding backward function also needs to know about the activation function for layer l, since the gradient depends on it. As it is known that each activation has a different derivative. Thus during backpropagation,which activation was used in the forward propagation needs to be known.It will help to compute the correct derivative. It is pertinent to perform feature selection only on the training data to avoid prediction bias. The correlations between all features are calculated and visualized.A threshold value needs to be set for keeping the feature with the lower mean. This article has considered all possible ways to handle unbalanced data sets in different machine learning paradigms. Most of the times, hybrid approaches provide better accuracy while dealing with unbalanced data sets by adopting different corrective measures, as mentioned in some recent studies[39–42]. AI enabled robust algorithms allowed both the phases of accuracy and estimation to ease out the unbalanced property of the data sets.
杂志排行

CAAI Transactions on Intelligence Technology的其它文章
- An efficient hybrid recommendation model based on collaborative filtering recommender systems
- Design and analysis of recurrent neural network models with non‐linear activation functions for solving time‐varying quadratic programming problems
- Deep imitation reinforcement learning for self‐driving by vision
- Steganography based on quotient value differencing and pixel value correlation
- D‐BERT:Incorporating dependency‐based attention into BERT for relation extraction
- Modified branch-and-bound algorithm for unravelling optimal PMU placement problem for power grid observability:A comparative analysis