Pre-breakdown to stable phase and origin of multiple current pulses in argon dielectric barrier discharge
2022-01-10SauravGAUTAMandGabrieleMORRA
Saurav GAUTAM and Gabriele MORRA
1Department of Mechanical Engineering, University of California Merced, Merced, California 95343,United States of America
2 Department of Physics,University of Louisiana at Lafayette,Lafayette,Louisiana 70503,United States of America
Abstract We report on the results of numerical models of the(i)initial growth and(ii)steady state phases of atmospheric-pressure homogeneous dielectric barrier discharge in argon.We employ our new inhouse code called PyDBD, which solves continuity equations for both particles and energy, shows exceptional stability,is accelerated by adaptive time stepping and is openly available to the scientific community.Modeling argon plasma is numerically challenging due to the lower speeds of more inertial ions compared to more commonly modeled neon and helium,but its common use for plasma jets in medicine makes its modeling compelling.PyDBD is here applied to modeling two setups:(i)the exponential growth from natural electron-ion seeds(onset phase)until saturation is reached and(ii) the multiple current pulses that naturally appear during the steady state phase.We find that the time required for the onset phase,when the plasma density grows from 109 m−3 to 1017 m−3,varies from 80 μs at 4.5 kV down to a few μs above 6.5 kV, for voltage frequency f=80 kHz and gap width dg=0.9 mm.At the steady state, our model reproduces two previously observed features of the current in dielectric barrier discharge reactors: (1) an oscillatory behavior associated to the capacitative character of the circuit and(2)several(Np)current pulses occurring every half sinusoidal cycle.We show that the oscillations are present during the exponential growth,while current pulses appear approaching the steady state.After each micro-discharge,the gas voltage decreases abruptly and charged particles rapidly accumulate at the dielectric boundaries,causing avalanches of charged particles near the reactor boundaries.Finally, we run a parametric study finding that Np increases linearly with voltage amplitude Vamp, is inversely proportional to dielectric gap dg and decreases when voltage frequency f increases.The code developed for this publication is freely available at the address https://github.com/gabersyd/PyDBD.
Keywords:plasma onset,micro-discharge, multiple current pulse(MCP),discharge asymmetry,seed electrons
1.Introduction
Dielectric barrier discharge (DBD) has been an area of active research over the past few decades with diverse applications in the fields of surface modification[1–3],thin film deposition[4],water treatment [5–7] and medicine [8–11], mainly due to its non-thermal nature,which enables it to modify surface properties of any material without altering its bulk properties.In particular,homogeneous atmospheric-pressure DBD (APHDBD) is particularly promising for industrial applications since they do not need any vacuum ambience.
Most often, DBDs display one current pulse per halfcycle of an applied AC voltage which is termed as singlecurrent-pulse discharge [12].However, several studies have reported the production of more than one current pulse per half-cycle of the discharge, termed multiple-current pulses(MCPs) [12–16].MCPs are one of the commonly observed nonlinear states in APHDBD [12] together with asymmetric discharge,[17]bifurcation and chaos[18].MCPs occur when the DBD is triggered before the end of the half-cycle; therefore a reverse field restrains the discharge process and a new charge accumulates in the DBD.The formation of MCPs introduces current oscillations and instabilities that are disadvantageous to industrial applications as well as to medical applications, which prefer a stable discharge regime[12,16].
Many recent studies of MCPs in APHDBD have focused on light gases such as helium, nitrogen, oxygen and other air constituents, while attempts at modeling argon are less common(e.g.[19]).To our knowledge,a detailed study of the development of MCPs in argon APHDBD has not been published yet, although argon is commonly used in experiments [20, 21], at room as well as at low pressure [22], and has demonstrated important applications in medicine [23],such as wound healing [24, 25], cancer treatment [26–28],bio-decontamination and sterilization.In medicine, argon is commonly used to fill plasma jets, after having been generated in APHDBD, due to its low cost compared to lighter noble gases such as helium and due to better control of the discharge at room temperature compared to air, nitrogen and oxygen [23].
For industrial and medical applications, a diffuse nonfilamentary discharge is preferred; however, experimental studies have shown that argon APHDBD operates mostly in filamentary mode due to the slower,more massive argon ions than other lighter gases present in air and commonly chosen for DBD applications[19,29,30].It is therefore important to improve our understanding of the causes behind the formation of MCPs in argon and to determine the parameters’ranges at which the formation of glow discharge can be ensured by avoiding the filamentary discharge.
The onset phase of the plasma formation can also influence the current pulses.Recent studies showed that MCP can be modulated by a memory effect caused by the accumulation of charges on dielectric surfaces during previous discharges and by persistent seed electrons, both from previous cycles[31, 32].Electron seeds introduce nonlinearities inside the DBD reactor and can switch the discharge mode from symmetric to asymmetric [17, 33–35].To better understand the memory effect in DBDs,it is necessary to first model in detail the exponential growth of free electrons and ions from the pre-ionized gas state to plasma.A systematic study of the onset phase was done by Panousiset al[36] on nitrogen,where they found that current pulses emerge only after several cycles,while here we investigate it on argon for the first time.Our models start from a minimal charge density estimated from the interaction with cosmic background radiation and random thermal collisions.
In modeling the steady state phase, we analyze in detail the formation mechanism of short-lived current pulses in conduction current density and the occurrence of MCP, with results in agreement with recent studies [12–16, 37–39].In particular, we quantify the dependency of (i) number of current pulses (Np) occurring per half-cycle, (ii) amplitude of the first current pulse (Jpeak) in a half-cycle and (iii) phase of the first current pulse (φpeak) from three external parameters:(a) gap between the dielectrics, (b) voltage amplitude and (c)external frequency.
The development of new and open numerical approaches can accelerate the development of efficient DBD schemes,which is mostly done today using codes that are not publicly available or using proprietary codes such as COMSOL.The simulations presented here have been performed with a new Python software package called PyDBD.The code along with Jupyter Notebooks are openly available upon request to the authors of this paper and will be distributed on an open source platform such as GitHub after publication.
The paper is organized as follows.In section 2, the geometry of the reactor is described in detail, together with the governing equations and boundary conditions.A finite difference discretization of the one-dimensional equations is explained, along with the details necessary to understand the online companion Python code.Section 3 contains the results of numerical simulation that includes the temporal variation of the charged particle number density, effect of charge accumulation on the dielectric surface and the current–voltage waveform of the discharge in both onset and steady-state phases.The occurrence of MCP is discussed in section 3.Finally, section 4 is reserved for concluding remarks on this research.
2.Model description
2.1.Operational parameters and geometry
A schematic diagram of the model is shown in figure 1.Two circular parallel plate electrodes, each covered with the dielectric plates of relative permittivity(∊r=7.5),are connected to a sinusoidal voltage source.The dielectric constant of 7.5 corresponds to mica glass which is one of the most commonly used dielectric materials in DBD reactors [40–42].Dielectric plates with millimeter-range thickness are commonly used in parallel plate DBD reactor setups like the one used in our research [14, 43–45].In our numerical model, we set the thickness of both dielectric plates to 0.8 mm and do not vary the dielectric thickness (d) and dielectric constant (∊r), whose role in DBD dynamics has been investigated in several studies[46, 47].We plan to add these parameters in future studies.
The background gas is argon at a pressure of 760 Torr with the gas temperature (T) set to 298 K.We vary the distance between the dielectrics in the range of 0.1–5 mm, the value of peak voltage(Vpeak)of the applied AC in the range of 3.2–10 kV and the frequency (f) in the range of 7–80 kHz.The operational parameters of the numerical model are tabulated in table 1.
The onset phase and the steady state phase are initiated with different populations of electrons and ions:ne=np=109m−3for the onset phase andne=np=1015m−3for the steady state phase.The steady state phase can also be reached by the onset models; however, modeling the steady state phase separately allows a greater number of models to be run with the same computational effort.
2.2.Governing equations
A one-dimensional fluid model approximates the dynamics for a much wider than thicker reactor [48, 49].Inside the reactor, continuity equations are solved for the number density of each type of charged particle.In parallel, another continuity equation is solved for the electron energy density.These continuity equations are coupled with Poisson’s equation to calculate the electric field inside the reactor.The boundary conditions are determined by a separate continuity equation representing the surface charge density and surface energy density on the dielectric layer.The particle continuity equations for electrons and ions in the reactor are written as:

Similarly, the energy continuity equation for the electrons is expressed by:

where · is the scalar product.Γe,pand Γ∊are the particle flux density and energy flux density respectively given by:

Table 1.Operational parameters of the numerical model.

where the subscripts e and p represent electrons and each type of ion respectively,nn,prepresents the charged particle number density, ∊is the electron energy density,Eis the electric field,Dis the diffusion coefficient and μ is the mobility.The right-hand side (RHS) terms of equations (1)are the source terms that represent the gain or loss for each type of charged particle, given by:

wheremjis the mole fraction of each ion pj,characterized by the number densitynj, when it collides at the reaction ratekjwith target molecules of densitynt.The target number density changes with each reaction.
Similarly, the energy source term is given by:

whereEris the energy loss/gain per inelastic collision with the heavy particles (ions and neutral) inside the plasma chamber.Similarly, the second term of equation (2) is the Joule heating term [50].The reactions of argon plasma that are modeled are listed in table 2.
The first term on the RHS of equation (3) represents advective flux, while the second term represents diffusive flux.The electron transport and reaction coefficients used in this model are obtained from BOLSIG+ [51].The electricfield-dependent mobility of ions is taken from a previous study [52], while the diffusion coefficients are calculated using Einstein’s equation [53].
The electrostatic potential between the electrodes is calculated by solving Poissonʼs equation:

whereVis the electrostatic potential, ρ is the space charge density, ∊0is the permittivity of free space and ∊ris the relative permittivity of the medium.

Table 2.Gaseous reactions corresponding to argon dielectric barrier discharge (DBD).σ(E) represents the reaction rate and is obtained from BOLSIG+. T is the gas temperature which is taken to be 300 K.Te is the electron temperature which depends on the electron energy.
2.3.Boundary conditions
The electron and energy fluxes towards the dielectric surfaces are represented by Γeand Γ∊respectively and are calculated using equations (9) and (10) [14]:

in which Γiis the ionic flux,kBis the Boltzmann constant,Teis the electron temperature,meis the mass of an electron,nis the unit normal vector pointing towards the dielectric surface,γiis the secondary electron emission coefficient,NAis the Avogadro constant and αsis the switching function which is defined as follows:

The surface densities of electrons and ions are calculated using equations (12) and (13) respectively:

in which, the function min (σe,σi) compares the values of σeand σiand returns the value of the smallest one.The field generated due to the accumulation of charge on the dielectric plates is calculated using:

where ρsis the net charge density on a dielectric surface,andD1andD2are the electric displacement fields above and below the boundary.
The total current flowing through a DBD reactor is a sum of two components:the conduction current caused by the flow of charged particles between the dielectrics, and a displacement current due to the capacitance properties of the electrode which also depends on its geometry [56].The current in this numerical model follows Satoʼs equation,which takes both of these currents into account [57, 58].
2.4.Numerical model
The advection and diffusion parts of the particles and energy continuity equations (see equations (1) and (2)) were solved separately using different finite difference techniques.Advection was solved using an explicit upwind scheme.Since numerical instability did not allow the use of explicit timestepping for the diffusion term, an implicit scheme was used,which guarantees unconditional stability and greater timesteps at the cost, however, of increased computational time and memory resources.We describe here in detail the finite difference discretization of equation (1).The same approach is used for equation (2).
The explicit finite difference form of the advection term of the continuity equation is written as:

where ϒ is the advective flux calculated with upwind approximation as [59]:

in whichvrepresents the velocity of the particle given by the product of the mobility (μ) and electric field (E).
The implicit finite difference form of the diffusion equation is obtained by expressing the RHS as a function of the future time step:

Equation (17) can be rewritten as:

where

The set of all the equations corresponding to each of the grid points{n it:i=1, 2,… ,ng−1}, whereng=number of grid points, can be written in the form of a single matrix equation:

where A is the column vector containing the number densities at the previous timestep{n1t,n2t,…,nntg−1}, while X is a column vector containing the future number densitiesB is a tridiagonal matrix containingQin the main diagonal,Pin the diagonal below the main diagonal andRjust above the main diagonal.The solution of this matrix equation is obtained by solving the linear algebra equation represented by equation(19).After solving the advective and diffusive parts of the continuity equation, the contribution of the source term to the continuity equation is added as:
Equation (8) can be written in finite difference form as:
The external AC voltage determines the boundary conditions of Poisson’s equation.In this research, the right electrode is grounded (V=0 V), whereas the left electrode is connected to an AC power supply (see figure 1).Therefore,the voltage is given byV=Vpeaksin(ωt).The value of electrostatic potential at all points between the electrodes(Vi:i=1, 2, …,ng−1) is determined by solving Poisson’s equation.
Numerically, this equation is solved by transforming it into a linear algebra problem,similar to equation(19).In this formulation, the column vector A contains the elements {V1,V2, …,Vng−1}, the column vector C contains the elements(−dx2∊){Vpeaksin (ωt) ,ρ1,ρ2,…,ρn−1, 0}, and the tridiagonal matrix B contains −2 in the main diagonal and 1 in both the diagonals just above and below the main diagonal.Poisson’s equation was solved assuming a quasi-neutral approximation, since this guarantees greater numerical stability.This is obtained by setting a null net charge(ρi=0)at all grid points except the dielectric surfaces.The validity of this assumption is tested in the discussion section.
To determine the boundary conditions of the continuity equations inside the reactor, the equations of charge accumulation at the dielectric surfaces(see equations(9)and(10))are solved, again using the the finite difference method.
The simulation has been performed with a new Python software package called PyDBD.Particular attention has been paid to the implementation of the boundary conditions, in order to conserve the total number of electrons and ions over time.The grid resolution is 620 intervals across the gap.The time step Δtis adaptive, responding to the simulation dynamics, based on a stability criterion, with a minimum value of Δt=1 ps.To run a 1 ms long simulation on one processor, the code required from a minimum of ∼48 h, for the case in which plasma did not form, up to ∼15 days to complete the most complex simulations.540 simulations were executed on a cluster,using MPI to distribute the initial conditions and collect the results [60].The code along with Jupyter Notebooks used for this work are available upon request to the authors of this paper.A parallel implementation is under development.
3.Results and discussion
3.1.Onset phase
In a DBD reactor, initially a very small fraction of argon gas is ionized by rare random collisions and cosmic background radiation[61].Charged particles are accelerated by an electric field caused by voltage difference between the electrodes.Electrons,which have much greater mobility than ions owing to their lower mass, acquire greater momentum and produce electron–ion pairs through collisions with ions along with other metastable species and neutral gas molecules.If the electric field is sufficiently strong, electron and ion densities grow significantly through a cascade effect [62].In our model, reaction rates (listed in table 2) control the ionization process.In this section, we describe the transition from a partially ionized argon gas into plasma under the assumption that the ionized gas is well represented by the particles and energy continuity equations [19, 32].
Figures 2(a)and(b)show the log-linear plots of temporal variation of average electron and positive-ion densities respectively between the dielectrics from the onset of the plasma until the steady state is almost reached.The total simulation time is 100 μs at the applied AC voltage with a peak value of 4.5 kV and frequency 80 kHz.The gap width(dg)between the dielectrics is 0.9 mm while the initial number densities of both electrons and ions are 109m−3.There is an exponential growth of charged particle number densities inside the reactor during the first few cycles of the applied AC.During the initial growth of the plasma,the onset phase,electrons move to and fro between the dielectrics of the DBD reactor, colliding with neutral particles and other species to form a greater number of charged particles.At AC voltage at 80 kHz, the phase of growth lasts for ∼85 μs, equivalent to∼7 AC cycles.After that,the electron and ion densities reach the steady state.

Figure 1.Schematic of the DBD reactor used in this numerical model.

Figure 2.Average (a) electron, (b) ion density inside the plasma reactor at an external AC voltage with peak value of 4.5 kV,frequency 80 kHz and a dielectric gap (dg) of 0.9 mm for the total simulation time of 100 μs.(c)Log-linear plot of the electron density production per second plotted alongside the voltage wave applied across the electrodes of the plasma reactor.

Figure 3.Temporal variation of surface charge density on the boundary plates for the initial eight cycles of the applied AC voltage with peak value of 4.5 kV and frequency 80 kHz for the experiment with a dielectric gap of 0.9 mm.
Figures 2(a)and(b)show that during the onset phase the electrons and ions grow at the same rate.This is due to several factors:(i)at our energy level in argon,ions and electrons are produced in equal number by ionization (see table 2); (ii) an equal number of electrons and ions recombine during the experiment; and (iii) both the electrodes are insulated by dielectrics, meaning charged particles cannot leave the reactor.
Figure 2(c) displays log-linear plots of the temporal variation of electron production superposed on the temporal variation of the applied voltage between the electrodes.For each AC cycle, there are two high production phases,corresponding to the highest and lowest extreme values of the voltage.While during the onset phase the production peaks overlap with the peak of the applied voltage,when saturation is reached, the production peak is shifted from the voltage peak, due to the charge accumulation on the dielectric surfaces after the previous cycle.This result is consistent with previous works [38, 43, 63, 64].

Figure 4.(a) Temporal variation current density plotted along with the temporal variation of applied voltage in the DBD reactor at dielectric gap 0.9 mm, voltage 4.5 kV and frequency 80 kHz.(b) Temporal variation of conduction and displacement components of current.
Figure 3 shows the temporal variation of surface charge density on the left and right dielectrics for the discharge produced at a gap width (dg) of 0.9 mm, voltage with peak value (Vpeak) of 4.5 kV and frequency (f) of 80 kHz during the first ∼100 μs of the simulation.The surface charge on both dielectric plates is negligibly small at the beginning of the simulation(∼0–55 μs).After that,one observes a gradual deposition of charge on the dielectric surfaces.The graph shows an asymmetric surface charge deposition,which is caused by the greater number of electrons deposited at the boundary compared to positive ions during the onset phase.This is caused by higher mobility of the electrons than the ions; therefore, electrons are more quickly transported towards the boundaries than the ions.Discharge asymmetry in the onset phase has been reported in other numerical studies of DBD [17, 31, 33, 34].
Figure 4(a)shows the current density versus time and the inter-electrode voltage versus time in the DBD reactor during the onset phase for the first 100 μs.In the first approximately nine half-cycles of the applied AC, a sinusoidal current leads to the voltage wave, which is typical for purely capacitative circuits.From the tenth half-cycle, short-lived current pulses appear in the current,one per half-cycle.The small number of charged particles in the first cycles of the simulation is insufficient to trigger a current during discharge,which begins only after avalanche multiplication of charged particles takes place.In figure 4(b), the current is split into conductive and displacement components.It is shown that only from the tenth half-cycle of the AC does the conduction current become notable.While the displacement component of the current is the same for the entire simulation, the current pulses are entirely due to the conduction component of the total current.

Figure 5.(a) Temporal variation of applied voltage and gas voltage of the DBD reactor at dielectric gap 0.9 mm, voltage 4.5 kV and frequency 80 kHz.(b) Temporal variation of displacement and conduction current plotted separately on the same graph.

Figure 6.Log-linear plot of the average value of the number density of the electrons inside the plasma reactor for five different values of AC voltage amplitude at a frequency of 80 kHz and dielectric gap(dg) of 0.9 mm.
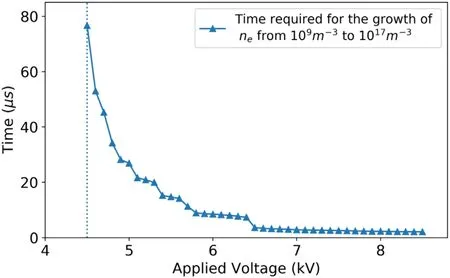
Figure 7.Time required for the growth of electron number density from 109 m−3 to 1017 m−3 plotted as a function of applied AC voltage amplitude at a frequency of 80 kHz and dielectric gap (dg)of 0.9 mm.
In figure 5, temporal variation of the gas voltage is plotted along with temporal variation of the applied interelectrode voltage.During the first nine half-cycles of the applied AC, the gas voltage is of sinusoidal shape.The peak values of the gas voltage are shown by dotted horizontal lines.From the tenth half-cycle of the applied AC voltage, the gas voltage is not perfectly sinusoidal and the value of the peak voltage also decreases.Earlier, we observed two important changes in the tenth half-cycle: (i) the surface charge started being deposited on the dielectric layers (see figure 3) and (ii)short-lived current pulses started to occur on the conduction current graph (see figure 4(b)).From these observations, it can be inferred that the change in the gas voltage from the tenth half-cycle of the applied AC voltage as observed in figure 5 is due to the memory charge on the dielectric surfaces.
The pre-breakdown phase depends upon several discharge parameters including discharge gap, voltage amplitude, frequency, the type of gas used and the operating pressure.The voltage amplitude of 4.5 kV presented in this section was obtained after performing a parametric scan for different values of voltage amplitude ensuring that the prebreakdown phase is only a few AC cycles long.
Figure 6 shows the logarithm of the average number densityneof electrons of the first 100 μs of five simulations for different external voltages.At 3.2 kV, the electric field causes few electron–gas collisions andnegrows only mildly.At 4.3 kV, electron density exponential growth is observed reaching half saturation at 100 μs.At just a slightly higher voltage of 4.8 kV,the electron density increases exponentially and becomes asymptotically near to saturation before 100 μs.At 7.75 kV, saturation is even reached in less than a cycle of the applied AC.The decrease in the number of cycles required to reach saturation is due to the growth of ionization reaction rate with voltage amplitude.It is worth mentioning that the ionization reaction rate is not calculated directly as the function of electric field in our numerical model.Instead, the ionization rate is obtained as a function of electron energy from the zero-dimensional Boltzmann equation solver BOLSIG+.When the value of voltage amplitude is increased, the electric field inside the reactor increases and that increases the electron energy.As a result, the ionization rate increases.
In figure 7 the time required for the electron number density to grow from 109m−3to 1017m−3is plotted as a function of the applied voltage.For voltage amplitudes lower thanVamp=4.5 kV (region toward the left of the dotted vertical line in figure 7),the electron number density does not hit the value of 1017m−3for the entire simulation time of 100 μs.For the voltage amplitude of 4.5 kV, it takes ∼77 μs for growth of an electron from 109m−3to 1017m−3, which shows that the time required for the charged particles to grow inside the DBD reactor decays exponentially as the value of voltage amplitude is increased.
Figure 8 shows the average electron density inside the DBD reactor at the end of the 100 μs simulation plotted as a function of voltage amplitude (Vamp).As presented earlier in figures 6 and 7, the charged particle number densities do not grow for lower values of applied voltage amplitude.In figure 8 the value of electron number density(ne)is constant at 109m−3for voltage amplitudes (Vpeak) below 3.4 kV.After that, a gradual increase in the value ofnecan be observed.The value ofneis ∼1014m−3forVpeak=4.3 kV and ∼1016m−3forVpeak=4.4 kV.This indicates that plasma could be generated at lower voltages after a very long pre-breakdown phase.
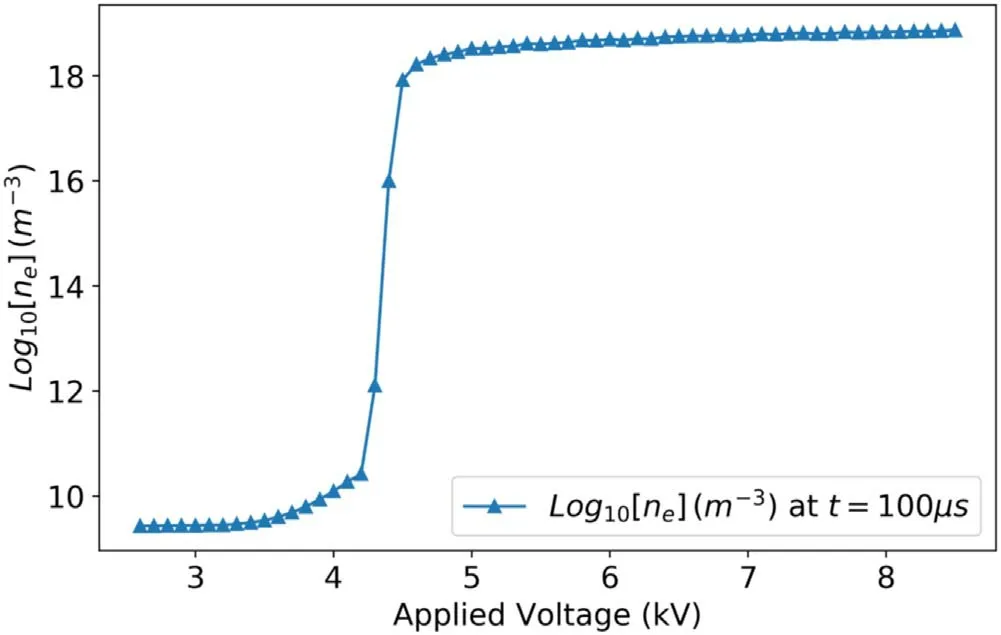
Figure 8.Average electron number density inside the DBD reactor at the end of 100 μs simulation plotted as a function of applied AC voltage amplitude.
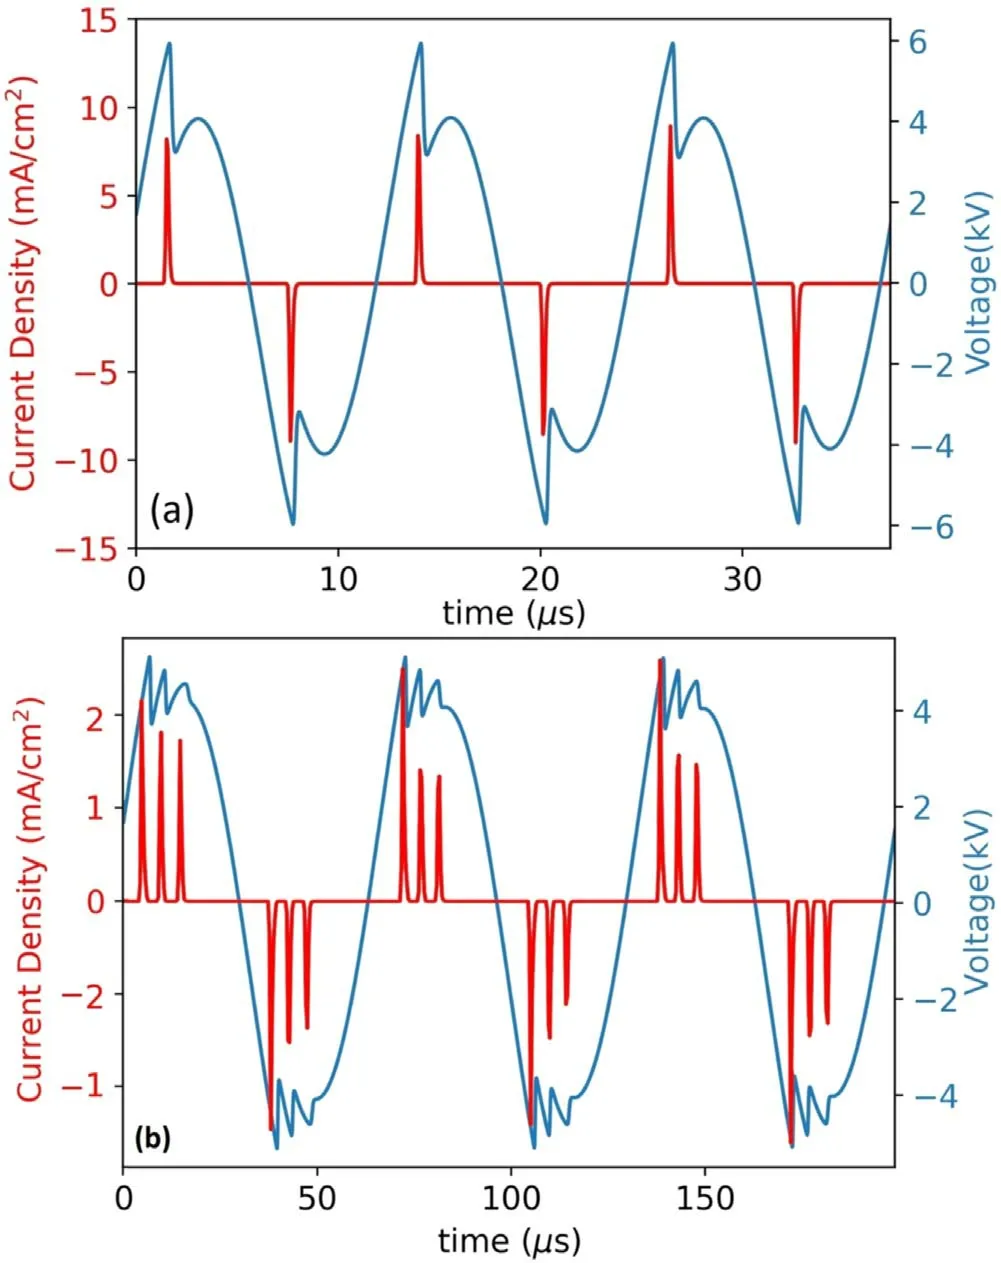
Figure 9.Current–voltage wave of the DBD reactor at(a)V=10 kV,f=80 kHz and dg=0.1 mm;(b) V=10 kV, f=15 kHz and dg=0.1 mm.

Figure 10.Comparison of the log-linear plot of the temporal variation of the electron production inside the DBD reactor at high and low frequencies.Multiple discharges appear at lower frequencies: (a) V=10 kV, f=80 kHz and dg=0.1 mm;(b) V=10 kV,f=15 kHz and dg=0.1 mm.
Experimental setups able to resolve the short timescale of the pre-breakdown phase are uncommon.In one case based on a different geometrical setup [65], the co-planar DBD in argon was observed by using high-speed camera imaging,which has limited resolution in time.This suggests that the numerical approach presented in this research might be used to resolve the details of the pre-breakdown state of a gaseous discharge, not presently detectable experimentally.
3.2.Steady state phase and MCPs
The steady state phase was modeled starting from a formed plasma composed by a homogeneous charged particle density of 1015m−3.The models quickly stabilize after a few cycles of the applied AC and show micro-discharges(current pulses)for a wide set of parameter values.
Figure 9(a)shows the current and the voltage of the DBD reactor with a gap width of 0.1 mm, peak voltage of 10 kV and 80 kHz frequency after the plasma reaches the steady state.With this parameter choice, the model predicts the appearance of one current pulse per half-cycle.Simultaneously to its formation, the value of gas voltage rapidly decreases, due to the deposition of charged particles on the plates.The current pulses are short-lived because when the voltage falls below the breakdown value, the ionization process stops temporarily until the voltage rises again.
In figure 9(b),the frequency of the applied AC is decreased to 15 kHz, keeping the voltage amplitude and dielectric gap constant at 10 kV and 0.1 mm respectively.MCPs appear(three in this case)per half-cycle of the AC.The occurrence of MCPs in DBD has been discussed in numerous recent experimental and numerical publications [14, 15, 38, 39].
Figure 10(a) shows the production of electrons for the experiment shown in figure 9(a) in which there is only one production peak per half-cycle.The surface charge accumulation on the boundary plates for this experiment is shown in figure 11(a).Multiple pulses appear when the frequency is lowered from 80 kHz to 15 kHz, maintaining a constant voltage and gap.This is shown in figures 10(b) (production)and 9(b) (current).
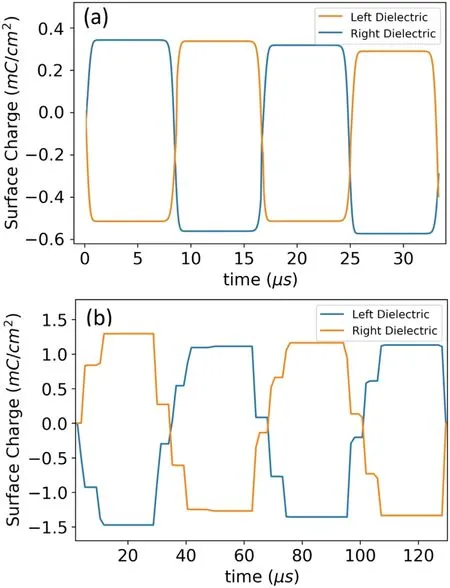
Figure 11.Value of surface charge density on left and right dielectrics for the experiment with (a) dg=0.1 mm, V=10 kV and f=80 kHz; (b) dg=0.1 mm, V=10 kV and f=15 kHz.
MCPs are formed when the charges deposited on the dielectric surface in the first pulse cannot prevent the formation of another discharge in the gas (figure 11(b)).In figure 9(b)the value of gas voltage decreases at the inception of each current pulse, due to the deposition of charged particles on the boundary.The gas voltage then bounces back to a sufficiently high value to form another current pulse of smaller amplitude,which again decreases the value of the gas voltage.This process repeats until the gas voltage does not bounce back anymore.
Figure 11(b) shows the surface charge accumulation on the left and right boundaries of the DBD reactor with a gap width of 0.1 mm at AC voltage amplitude of 10 kV and frequency 15 kHz.After each current pulse, the value of the surface charge density on the boundary suddenly increases,which shows that the charged particles produced at the time of formation of the current pulses are rapidly advected and deposited toward the boundary plates.After the final current pulse, the value of the surface charge remains constant until the polarity of the applied AC changes after which the value of surface charges becomes zero and reverses its sign.We assume that the charge is accumulated homogeneously on the boundary, independently from the roughness of the surface [66].

Figure 12.Conduction current density for three different voltage amplitudes (Vamp).The frequency and dielectric gap are fixed at f=15 kHz and dg=0.1 mm respectively.
In the following subsections, we show the separate effects of(i)peak voltage,(ii)frequency and(iii)gap between the dielectrics on the occurrence of MCPs in the DBD reactor during the steady state phase.
3.2.1.Effect of voltage amplitude(Vamp).Figure 12 shows the temporal variation of conduction current density for three different voltage amplitudes (Vamp), leaving other parameters unvaried.The frequency of the applied AC is constant at 15 kHz and the gap between the dielectrics is set to 0.1 mm.At 6.5 kV, only one peak is observed in the conduction current density per half-cycle.The number of peaks (Npeak)increases to 2 when the value of applied AC reaches to 7.5 kV and it becomes 4 for an applied AC amplitude of 10 kV.
The area enclosed inside the dotted circle in figure 12(c)represents the number of current pulses on a single half-cycle of the applied AC after the plasma reaches the steady state.Among the four pulses seen in that region, the first pulse has maximum amplitude and the amplitude of each consecutive pulse decreases gradually.
The number of pulses per half-cycle (Np) has been plotted as a function of applied voltage in figure 13.Npincreases linearly with a greater applied voltage.
Figure 13 also shows the phase(φpeak)and the amplitudeJpeakof the first current pulse plotted as a function of applied voltage, keeping all other parameters constant.φpeakdecreases with increasing applied voltage because the breakdown voltage is reached earlier when the peak amplitude of the applied voltage is increased.This phenomenon can be described as a series of capacitors [14]:
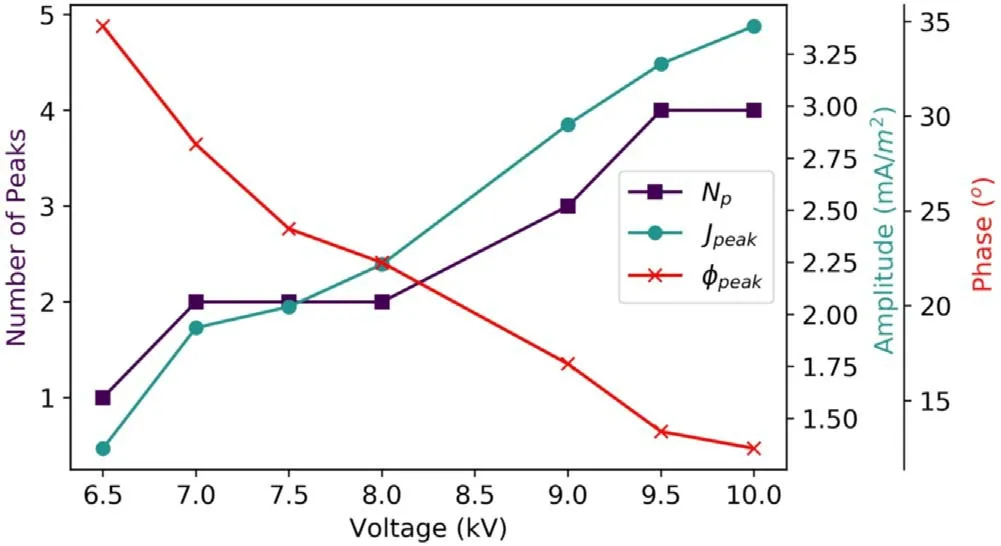
Figure 13.Graph of φpeak, Jpeak and Np as a function of voltage amplitude (V).The frequency and dielectric gap are fixed at f=15 kHz and dg=0.1 mm respectively.

whereVbris the breakdown voltage, φpeakis the phase of the first current pulse, ∊ris the relative permittivity of the dielectric,dgis the gap between the dielectrics anddbis the thickness of the dielectric plate.
When the value ofVampis increased, the breakdown voltage is reached even at lower values of φpeak.Therefore,there is sufficient time for the formation of other current pulses.As a result, more current pulses are formed at higher voltages.This is qualitatively explained by the formula [14]:

whereTmcpis the time interval between the first discharge and the peak of the applied voltage of frequencyfand φpeakis the phase of the first current pulse.For higher values ofTmcpthe chance of formation of MCPs increases.
As shown in figure 13, the value ofJpeakalso increases almost linearly with the applied voltage.This implies that the breakdown at smaller values of φpeakis characterized by higher conduction current densities (Jpeak).
3.2.2.Effect of dielectric gap(dg).Figure 14 shows the temporal variation of the conduction current of the DBD reactor for three different dielectric separations (dg), with prescribed applied voltage at 10 kV and frequency at 7 kHz.The number of pulses per half-cycle decreases with an increasing gap between the dielectrics.This is analogous to the effect of voltage reduction and can be understood based on equation (23) in which the value of breakdown voltage(Vbr) increases with an increase in the value of the dielectric gap (dg).
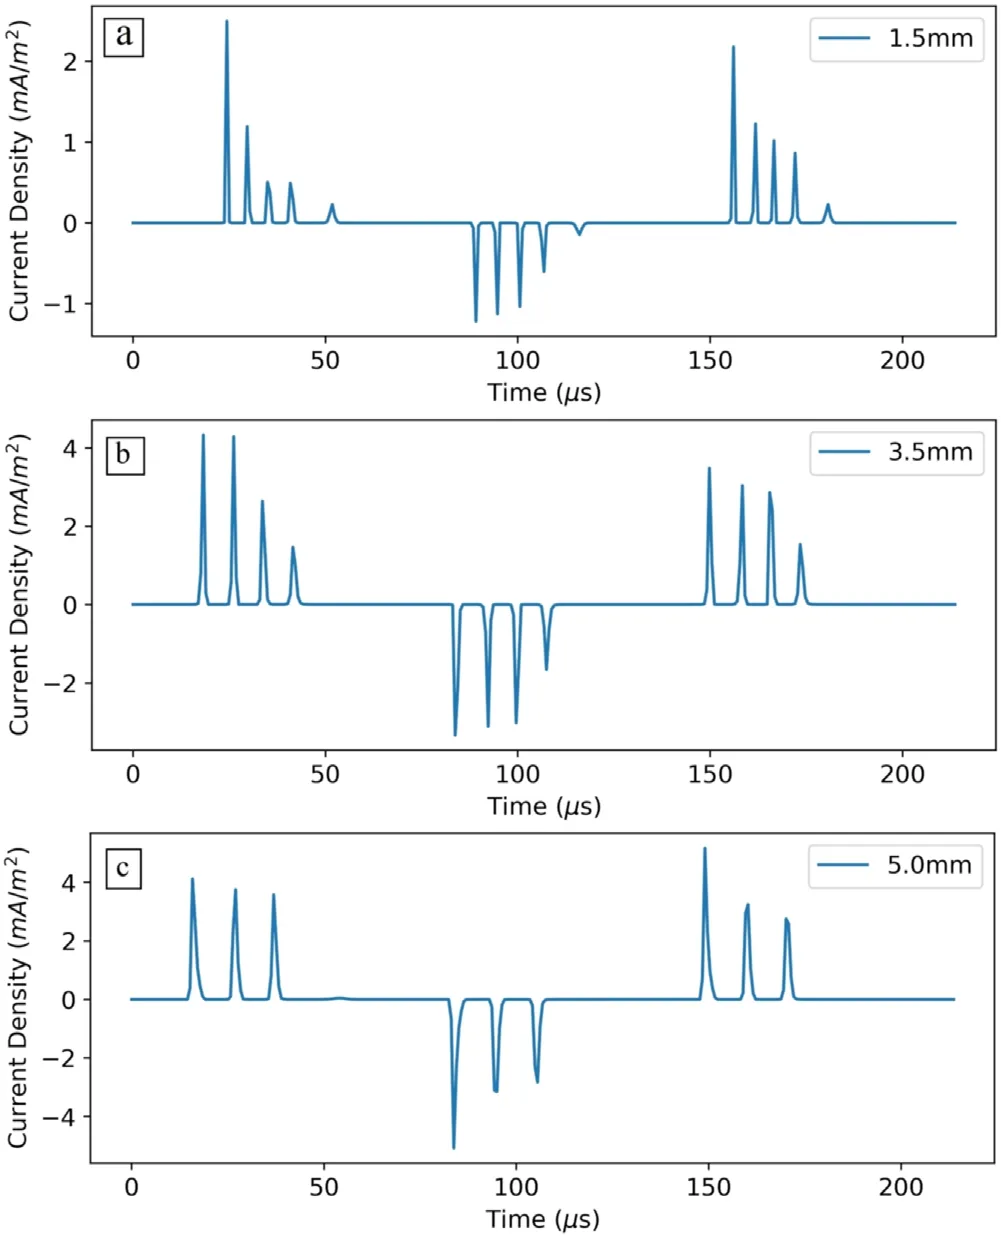
Figure 14.Conduction current density for three different dielectric gaps (dg).The voltage amplitude and frequency are fixed at Vamp=10 kV and f=7 kHz respectively.

Figure 15.Reaction rate for ionization reaction of argon (Ar +e−=2e−+ Ar+) plotted as a function of electric field.
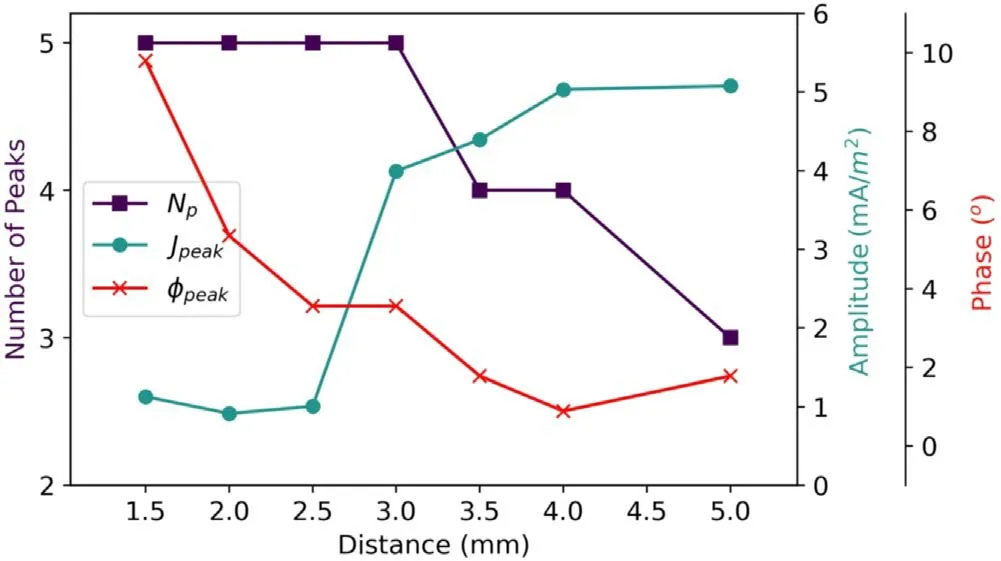
Figure 16.Graph of φpeak, Jpeak and Np as a function of the gap between dielectrics(dg).The frequency and applied voltage are fixed at f=20 kHz and Vamp=12.5 kV respectively.
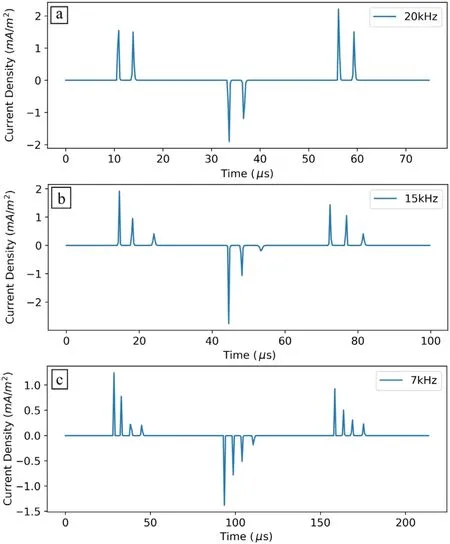
Figure 17.Conduction current density for three different frequencies(f).The voltage amplitude and dielectric gap are fixed at Vamp=10 kV and dg=0.1 mm respectively.
Assuming that the DBD reactor shown in figure 1 is a parallel plate capacitor, the value of the electric field can be roughly estimated with the formulaE=Vg/dgwhereVgis the gas voltage anddgis the dielectric gap.This relation shows that the dielectric gap and the electric field are inversely related.The growth of the value of the electric field causes a greater rate of ionization of the neutral argon molecules (see figure 15); hence, the breakdown of gas is obtained even at lower voltages.This effect is synthetically expressed in figure 16,whereNpand φpeakdiminish with the gap thickness(dg) whileJpeakfollows the opposite trend.
Similar to what is discussed in section 3.2.2, figure 16 shows that the breakdown occurring at higher voltages is associated with lower values of conduction current densities.
3.2.3.Effect of frequency.Figure 17 shows the temporal variation of conduction current density of the DBD reactor for three different frequencies, keeping the voltage and dielectric gap constant at 10 kV and 0.1 mm, respectively.At a lower frequency, the longer period allows multiple cycles of accumulations and pulses.Again, this is in agreement with equation(24)in which the value ofTmcpdepends inversely on the frequency (f) of the applied AC.As predicted, at greater frequencies, the number of pulses lessens.
Figure 18 shows the variations ofNpeak,Jpeakand φpeakas the function of the frequency of the applied AC.The value of φpeakincreases in the frequency range of 7–20 kHz, and then becomes constant.The increase in φpeakalong with the increase in frequency implies that at lower frequency the first micro-discharge should take place even at lower voltages.

Figure 18.Graph of φpeak, Jpeak and Np as a function of applied frequency (f).The voltage amplitude and dielectric gap are fixed at Vamp=10 kV and dg=0.1 mm respectively.
The time required(tr)for a sinusoidal AC signal to grow from 0 V to a certain voltageViwithin the same half-cycle can be calculated as:

where arcsin (VrV) ∊[0,π2],Vampis the voltage amplitude andfis the frequency.
The total number of electrons formed/lost in the reactor due to ionization/recombination reactions in the time interval(ti) can be estimated using the equation:

whereSj(t)is the source term of thejth corresponding reaction that causes the change in the number of electrons in the continuity equation (1).The value of valueSj(t) is calculated using equation (20).Equation (25) shows that at smaller frequencies (f) of the applied AC, the value oftrincreases,and equation (26) shows that when the value oftrincreases,the number of charged particles formed due to ionization inside the plasma reactor (ntot) also increases, which makes the gaseous discharge at lower voltages possible when the frequency is low.The correlation between φpeakandJpeakin figure 18 is opposite to that observed in figures 13 and 16.
4.Conclusions
In this work, a new plasma fluid modeling software package called PyDBD is used to model the features of both the (i)initial (onset) and (ii) steady state phases of APHDBD in argon.Discharge was formed on weakly ionized(ne=ni=109m−3)argon gas using an initial charged particle number density estimated from the interaction with cosmic background radiation and random thermal collisions.During the onset phase, models indicate that if a sufficient voltage is applied, the number of charges initially increases exponentially and then saturates.The time required to reach the steady state reduces rapidly from 80 μs at 4.5 kV down to less than an AC cycle (a few μs) above 6.5 kV, for voltage frequencyf=80 kHz and gap widthdg=0.9 mm.We validate our simulation by calculating the current waveform from a pure capacitative to mixed circuit, with current pulses corresponding to micro-discharges, and find results in agreement with recent works [15, 16, 38, 39].
In the second part of the paper,we study the steady state dynamics of the argon DBD focusing on the role that three external parameters (peak voltage, frequency and gap between the dielectrics)have on the formation of MCPs.The steady state is obtained by running the code for a sufficiently long time (∼1 μs).It is found that the number of current pulses per cycle decreases with increasing frequency, and is directly proportional to the electric field and inversely proportional to the dielectric gap.We find and verify an explicit formula forTmcp,the time between the first discharge and the peak of the applied voltage of frequency, as a function off,and φpeakis the phase of the first current pulse, which is directly correlated with the number of MCPs.
Non-thermal argon plasma has gained popularity in various applications such as surface treatment, plasma processing and water purification with extremely promising applications in the field of plasma medicine.The results presented here will be useful for these applications which require a stable discharge regime.Our results can be used to design DBD reactors as well as plasma jets.
Acknowledgments
This research was funded by the Louisiana Board of Regents,project LEQSF (2014-17)-RD-A-14.The models have been performed using the Louisiana Optical Network Infrastructure(LONI) Queen Bee II cluster.
Data availability
The data that support the findings of this study are available from the corresponding author upon reasonable request.
杂志排行
Plasma Science and Technology的其它文章
- Numerical simulation of nanosecond laser ablation and plasma characteristics considering a real gas equation of state
- The propagation dynamics and stability of an intense laser beam in a radial power-law plasma channel
- Effect of edge magnetic island on carbon screening in the J-TEXT tokamak
- Relativistic effect on synergy of electron cyclotron and lower hybrid waves on EAST
- Influence of the X-point location on edge plasma transport in the J-TEXT tokamak with a high-field-side single-null divertor
- A simulation study of protons heated by left/right-handed Alfvén waves generated by electromagnetic proton–proton instability
