New stem cell autophagy surrogate diagnostic biomarkers in earlystage hepatocellular carcinoma in Egypt: A pilot study
2022-01-05TarekYosefWesamAhmedIbrahimMarwaMatboliAminaAhmedSwilamSarahElNakeep
Tarek Yosef, Wesam Ahmed Ibrahim, Marwa Matboli, Amina Ahmed Swilam, Sarah El-Nakeep
Tarek Yosef, Wesam Ahmed Ibrahim, Sarah El-Nakeep, Gastroenterology and Hepatology Unit, Department of Internal Medicine, Faculty of Medicine, Ain Shams University, Cairo 11591, Egypt
Marwa Matboli, Department of Biochemistry, Faculty of Medicine, Ain Shams University, Cairo 11591, Egypt
Amina Ahmed Swilam, Department of Internal Medicine, Health Affair Directorate, Ministry of Health and Population, Cairo 11591, Egypt
Abstract BACKGROUND Stem cell autophagy disruption is responsible for the development of hepatocellular carcinoma (HCC).Many non-coding RNAs are linked to the activation and inhibition of certain genes.The SQSTM1 gene controls stem cell autophagy as shown in previous studies.The upregulation of SQSTM1 is associated with the inhibition of autophagy in cancerous stem cells in patients with HCC.AIM To determine whether serum microRNA, hsa-miR-519d, is linked to SQSTM1 gene and whether they could be used as diagnostic biomarkers for early-stage HCC.METHODS In silico analysis was performed to determine the most correlated genes of autophagy with microRNAs.SQSTM1 and hsa-miR-519d were validated through this pilot clinical study.This study included 50 Egyptian participants, who were classified into three subgroups: Group 1 included 34 patients with early-stage HCC, Group 2 included 11 patients with chronic liver disease, and Group 3 (control) included 5 healthy subjects.All patients were subjected to full laboratory investigations, including viral markers and alpha-fetoprotein (AFP), abdominal ultrasound, and clinical assessment with the Child–Pugh score calculation.Besides, the patients with HCC underwent triphasic computed tomography with contrast to diagnose and determine the tumor site, size, and number.Quantitative real-time polymerase chain reaction was used to assess hsa-miR-519d-3p and SQSTM1 in the serum of all the study participants.RESULTS Hsa-miR-519d-3p was significantly upregulated in patients with HCC compared with those with chronic liver disease and healthy subjects with an area under the curve (AUC) of 0.939, with cutoff value 8.34, sensitivity of 91.2%, and specificity of 81.8%.SQSTM1 was upregulated with an AUC of 0.995, with cutoff value 7.89, sensitivity of 97.1%, and specificity of 100%.AFP significantly increased in patients with HCC with an AUC of 0.794, with cutoff value 7.30 ng/mL, sensitivity of 76.5%, and specificity of 72.7%.CONCLUSION This study is the first to show a direct relation between SQSTM1 and hsa-miR-519d-3p; they are both upregulated in HCC.Thus, they could be used as surrogate diagnostic markers for stem cell autophagy disturbance in early-stage HCC.
Key Words: Autophagy; Hepatocellular carcinoma; miRNA; miR-519d; Stem cell; SQSTM1
INTRODUCTION
The scientists who discovered the mechanism of autophagy were awarded a Nobel Prize, and autophagy subsequently became a topic of great scientific interest for researchers.Autophagy is defined as cellular “self-eating,” where lysosomal degradation of cellular elements occurs[1-3].This process has three types: Chaperonemediated autophagy, microautophagy, and macroautophagy.Autophagy is considered a “dynamic cellular recycling”[4] and provides cancerous cell preservation through the production of amino acids from degraded proteins[5].The activation of autophagy increases resistance to cisplatin and sorafenib in patients with hepatocellular carcinoma (HCC); this could be reversed upon deactivation[6].
The discovery of “epigenetic–genetic” links is an important area of research.Studies on the regulation of targeted genes by microRNAs (miRNAs) must answer two questions: The mechanism of regulation and the effect of dysfunction on specific cancerous molecular pathways[7].
MiR-519d dysregulation is not only linked to the initiation and progression of many cancers as breast[8], skin[9], and gastrointestinal cancers[10,11] but also associated with obesity[12].
SQSTM1, also known as p62 protein, is a multifunctional protein responsible for various stress-induced cellular functions, including apoptosis and autophagy; its coding gene is theSQSTM1gene located on chromosome 5[13].The impairment of autophagy causes the accumulation of p62 proteins in the hepatoma cells of mice[14].Meanwhile, its upregulation significantly contributes to the resistance of hepatoma cells to sorafenib[15].SQSTM1was initially believed to only control several cellular metabolic pathways, including the mechanistic target of rapamycin, nuclear factor kappa-light-chain-enhancer of activated B cells (NF-κB), and mitogen-activated protein kinase signaling pathways, but later was also linked to the control of selective autophagy[16].
Here, in this study, we usedin silicoanalysis to search for a new link among epigenetic–genetic biomarkers to identify and detect their relationship with early-stage HCC.We found significantin silicodata relation between hsa-miR-519d-3p andSQSTM1and their link to HCC pathophysiology.We clinically validated the data by examining serum samples to assess their ability to be used in the diagnosis of HCC.
MATERIALS AND METHODS
This was a cross-sectional study conducted on randomly selected 50 Egyptian participants from outpatient clinics and inpatients attending the Gastroenterology and Hepatology Unit of the Internal Medicine Department at Ainshams University Hospitals, Faculty of Medicine, Ain Shams University, Cairo, Egypt.
The participants were divided into three groups
Group 1:Consisted of 34 patients with HCC that were diagnosed according to the American Association for the Study of Liver Diseases practice guidelines and staged according to the Barcelona Clinic Liver Cancer as stages A to D[17].
Group 2:Consisted of 11 patients with chronic liver disease.
Group 3: Consisted of 5 healthy subjects (control), who were enlisted during routine checkups and as volunteers.
Inclusion criteria for the study
Age more than 18 years.
The ability to provide informed consent.
Proven diagnosis of HCC according to the American Association for the Study of Liver Diseases practice guidelines for group 1[17].
Exclusion criteria for the study
Patients actively undergoing chemotherapy or radiation therapy for HCC.
Patients with other malignancies or treated within the last 5 years.
The Internal Medicine Department, Faculty of Medicine, Ain Shams University, approved this study’s protocol in 2016 for ethics of conducting the study and in accordance with the ethical standards of the Declaration of Helsinki.Informed consent was obtained from each participant.Both the patients and controls were randomly selected.This study was not funded.
Data of samples
The following parameters were documented for the participants:Full personal history and thorough clinical examination.
Laboratory investigations included the following: (1) Liver function: Serum albumin, prothrombin time and international normalized ratio, and total and direct bilirubin; (2) Liver enzymes: Serum aspartate transaminase, alanine transaminase, alpha-fetoprotein (AFP), hepatitis C virus antibody, and hepatitis B virus surface antigen (HBsAg); and (3) Abdominal ultrasound: Tumor size, the number of nodules, local spread, lymph node metastasis, cirrhosis, and the presence of ascites.
Triphasic spiral contrast-enhanced computed tomography in the HCC group.
Biomarker identification and bioinformatics analysis
Bioinformatics analysis was performed to retrieve biomarkers relevant to HCC based on previous microarray studies.This step included the following.
Biomarker retrieval and verification:In this concern, we used the public databases, including miRDB, miRTargetLink Human, GeneCards, and Human Protein Atlas, to choose a set of miRNAs and its targeted messenger RNA (mRNA) that is related to HCC.According to the data retrieved, we chose the microRNA-519d, hsa-miR-519d-3p, and the targeted mRNA,SQSTM1, as a point to be studied in relation to HCC.In silicoanalysis is shown in detail in Figure 1.

Figure 1 Bioinformatic search and validation of the newly diagnostic biomarkers.
Sample collection:Blood was collected from all participants in a plain test tube.These blood samples were left at room temperature for a minimum of 30 min to allow complete blood clotting.
The clotted blood samples were centrifuged for 20 min.
The serum was carefully separated and transferred to 1.5 mL aliquots and stored at 80 °C until assayed.
An identifier was used to label each serum sample to protect the confidentiality of the participants.
Laboratory work
Extraction of total RNA:An miRNEasy RNA isolation kit (Qiagen, Hilden, Germany) was used to extract total RNA from the serum samples according to the manufacturer’s instructions.The RNA concentration and integrity were assessed using an Ultraspec 1000 UV/visible spectrophotometer (Amersham Pharmacia Biotech, Cambridge, United Kingdom).Then, 72 μL diethyl pyrocarbonate–water was added to 3 μL RNA solution (dilution 1:25).The sample was read at 260 nm for RNA detection and 280 nm for protein detection using a spectrophotometer.Next, 40 μg RNA/mL is equivalent to 1 absorbance, so the concentration of RNA in a sample (μg/mL) = sample absorbance at 260 nm × 40/1 × dilution factor (25).The samples were considered to have high RNA quality if the RNA–protein ratio (260:280 ratio) was more than 1.8–2.
Reverse transcription-polymerase chain reaction:The extracted total RNA underwent reverse transcription into cDNA using a miScript II RT Kit (Qiagen) according to the manufacturer’s protocol using a Hybaid thermal cycler (Thermo Electron, Waltham, MA, United States).
Quantitative reverse transcription-polymerase chain reaction:RNA levels were examined by quantitative reverse transcription-polymerase chain reaction (qRT-PCR) to ensure sensitive and specific RNA detection and quantification with high amplification efficacy.All PCR primers were obtained from Qiagen.All steps followed the manufacturer’s suggested protocol.
Quantitative PCR for the detection of SQSTM1 mRNA: The relative expression ofSQSTM1mRNA was assessed using a QuantiTect SYBR Green PCR Kit (Qiagen) on a Rotor-Gene real-time PCR detection system (Qiagen) with specific primers provided by Qiagen.Beta-actin (ACTB) was used as a housekeeping gene.
The QuantiTect SYBR Green PCR Kit provides accurate real-time quantification of cDNA targets in an easy-to-handle format.The kit can be used in real-time two-step RT-PCR of RNA targets following reverse transcription with the fluorescent dye SYBR Green I in the master mix, which enables the analysis of many targets without having to synthesize target-specific labeled probes.It uses the SYBR Green I dye to detect PCR products by binding to double-stranded DNA formed during the PCR.It binds to each new copy of double-stranded DNA generated during each PCR cycle.The result is an increase in fluorescence intensity proportional to the number of double-stranded PCR products produced.
High specificity and sensitivity in PCR are achieved using the hot-start enzyme HotStarTaq DNA Polymerase together with a specialized PCR buffer.In addition, the buffer contains ROX dye, allowing fluorescence normalization on certain cyclers.The kit has been optimized for use with any real-time cycler, including Rotor-Gene®cyclers.A melting point analysis was performed to monitor the homogeneity and specificity of the quantitative PCR (qPCR) products.
qPCR for the detection of hsa-miR-519d-3p:A relative miRNA expression level for hsa-miR-519d-3p was analyzed by mixing the total cDNA with the reagent provided in the miScript SYBR Green PCR Kit (Qiagen) according to the manufacturer’s suggested protocol, in addition to the manufacturer-provided miScript universal primer.RNU-6 was used as a housekeeping gene.
For detecting mature miRNA, cDNA prepared in a reverse transcription reaction using miScript HiSpec Buffer or miScript HiFlex Buffer serves as the template for realtime PCR analysis using a miRNA-specific miScript Primer Assay (forward primer) and the miScript SYBR Green PCR Kit, which contains the miScript Universal Primer (reverse primer) and QuantiTect SYBR Green PCR Master Mix.
PCR result analysis:The PCR program for the SYBR Green-based qPCR was as follows: Denaturation at 95 °C for 15 min; 40 cycles of denaturation for 10 s at 94 °C; annealing for 30 s at 55 °C; and extension for 34 s at 70 °C.Each reaction was performed in duplicate.A Rotor-Gene manual was used to calculate the threshold cycle (Ct) value of each sample.Any Ct value greater than 36 was considered negative.We used the melting curve analysis software of Applied Biosystems to analyze our results.The melting curves were analyzed to affirm the specificities of the amplicons for the SYBR Green-based PCR amplification.The (2–∆∆Ct) relative quantification RQ technique was used to measure the expression of the RNA-based biomarker panel.
The housekeeping genes, ACTB and RNU-6, were used as an invariant internal control to normalize the raw data of the samples and compare these results with a reference sample.
Statistical analysis
Statistical analyses of the obtained data were performed using SPSS, version 23 (IBM Corp., Armonk, NY, United States).
To describe the studied sample, quantitative data are presented as minimum, maximum, mean, and standard deviation for parametric data and median and interquartile range (IQR) for nonparametric data.Qualitative data are presented as count and percentage.
Student’s t-test was used to compare quantitative data between two independent groups, and the Mann–Whitney U-test was used for nonparametric data.
One-way analysis of variance was performed to compare quantitative data when more than two groups were to be compared; then, a post-hoc test was used to detect the difference between individual groups for parametric data, and the Kruskal–Wallis test was used for nonparametric data.
The chi-square test and Fisher’s exact test were used to compare qualitative data between different groups.
The receiver operating characteristic (ROC) curve was used to measure diagnostic validity and determine the best cutoff value for some variables.
Pvalues less than 0.05 denote statistical significance.In addition, concerning the level of significance:Pvalues represent the level of significance,Pvalues more than 0.05 are non-significant,Pvalues less than 0.05 are significant, andPvalues less than 0.01 are highly significant.
RESULTS
We conducted this study on 50 Egyptian participants divided into three groups: 34 patients in the HCC group, 11 patients in the chronic liver infection group, and 5 healthy participants as the control group.
The age of all participants was more than 18 years with a mean of 58.88 ± 8.08 years, 56.18 ± 16.26 years, and 55.40 ± 22.09 years in the HCC, chronic liver infection, and control groups, respectively, with a non-statistically significantPvalue (0.72).In addition, a non-significant difference was observed between the malignant and nonmalignant groups (i.e.patients in the chronic liver infection group added to the control group) with aPvalue of 0.53.
Gender differences were observed among the study groups—HCC group: Male = 67.6% and female = 32.4%; chronic liver infection group: Male = 81.8% and female = 18.2%); and healthy group: Male = 60% and female = 40%.The difference between the three study groups was statistically non-significant with aPvalue of 0.63 (Table 1).Liver function and laboratory data are shown in Table 2.
Hepatitis C antibody was prevalent in 88.2% of the patients with HCC, whereas all patients with chronic liver disease were positive, and no subjects in the control group were positive for hepatitis C virus antibody.HBsAg was prevalent in 5.9% of the patients with HCC, whereas none of the subjects in the chronic liver disease and control groups were positive for HBsAg.These data are shown in Table 3.
Our results concerning hsa-miR-519d-3p showed data from the qRT-PCR.These data were reported in delta–delta Ct [DDCT or -(∆∆CT)] and RQ calculated as follows: RQ = 2-ddCT= 2-∆∆CT(Table 4 and Figure 2A).
The results of serum miRNA (miR-519d) in the three study groups, reported in RQ, showed that in the HCC group, serum miRNA was 41.94 (IQR: 18.25–139.10); in the chronic liver infection group, serum miRNA was 5.98 (IQR: 3.14–8.28), and in the control group, serum miRNA was 1.17 (IQR: 1.16–1.21), with a highly significantPvalue (< 0.001) (Table 4).These data suggest that hsa-miR-519d-3p is significantly upregulated in the HCC group compared with the chronic liver infection and control groups.The ROC curve to assess the validity of the results of qRT-PCR of hsa-miR-519d in the serum in differentiating the HCC and chronic liver infection groups with the best cutoff value of ≥ 8.34, sensitivity of 91.2%, and specificity of 81.8% is shown in Figure 3A.
The second part of this study focused on the serum level ofSQSTM1in HCC and whether it can be used as a significant biomarker.The data we obtained from qRTPCR using the RQ of the serumSQSTM1gene in comparing the three study groups from Table 4 and Figure 2B showed thatSQSTM1was 33.91 (IQR: 14.83–132.51) in the HCC group, 3.68 (IQR: 2.28–5.50) in the chronic liver infection group, and 0.84 (IQR: 0.76–0.99) in the control group with a highly significantPvalue (< 0.001).The ROC curve to assess the validity of the results of qRT-PCR ofSQSTM1in the serum to differentiate the HCC and chronic liver infection groups with the best cutoff value of ≥ 7.89, sensitivity of 97.1%, and specificity of 100% is shown in Figure 3B.

Table 1 The ages in the different groups of the study (mean ± SD)

Table 2 Significance of the differences in laboratory data between the three study groups (mean ± SD)

Table 3 Hepatitis virus B and C infections in the three study groups
When we divided the groups into the malignant and non-malignant groups, we found similar results (Figure 4).
The ROC curve to assess the validity of the RQ results of qRT-PCR of hsa-miR-519d in the serum among the malignant and non-malignant groups with the best cutoff value of ≥ 8.34, sensitivity of 91.2% and specificity of 87.5% is shown in Figure 4A.TheROC curve to assess the validity of the RQ results of qRT-PCR ofSQSTM1in the serum among the malignant and non-malignant groups with the best cutoff value of ≥ 7.89, sensitivity of 97.1%, and specificity of 100% is shown in Figure 4B.
Furthermore, in this study, AFP was 62.60 (IQR: 8.20–600.80) in the HCC group, 3.50 (IQR: 2.50–20.00) in the chronic liver infection group, and 0.70 (IQR: 0.50–1.00) in the control group (Table 5).These results show that AFP is elevated with high statistical significance in patients with HCC as compared to other groups, with aPvalue of < 0.001.The constructed ROC curve to compare AFP results between the HCC and chronic liver infection groups showed an area under the curve (AUC) of 0.794, with the best cutoff value of > 7.30 ng/mL, sensitivity of 76.5%, and specificity of 72.7% (Figure 5A).Meanwhile, the ROC curve assessing the validity of AFP for differentiating between the malignant and non-malignant groups showed an AUC of 0.854, with the best cutoff value of > 7.30, sensitivity of 76.5%, and specificity of 81.2% (Figure 5B).
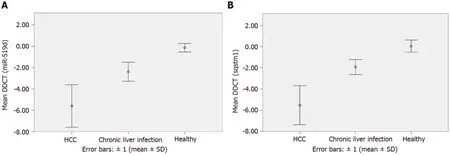
Figure 2 Box-plot figures showing the mean delta–delta threshold cycle in the new diagnostic biomarkers in different groups.
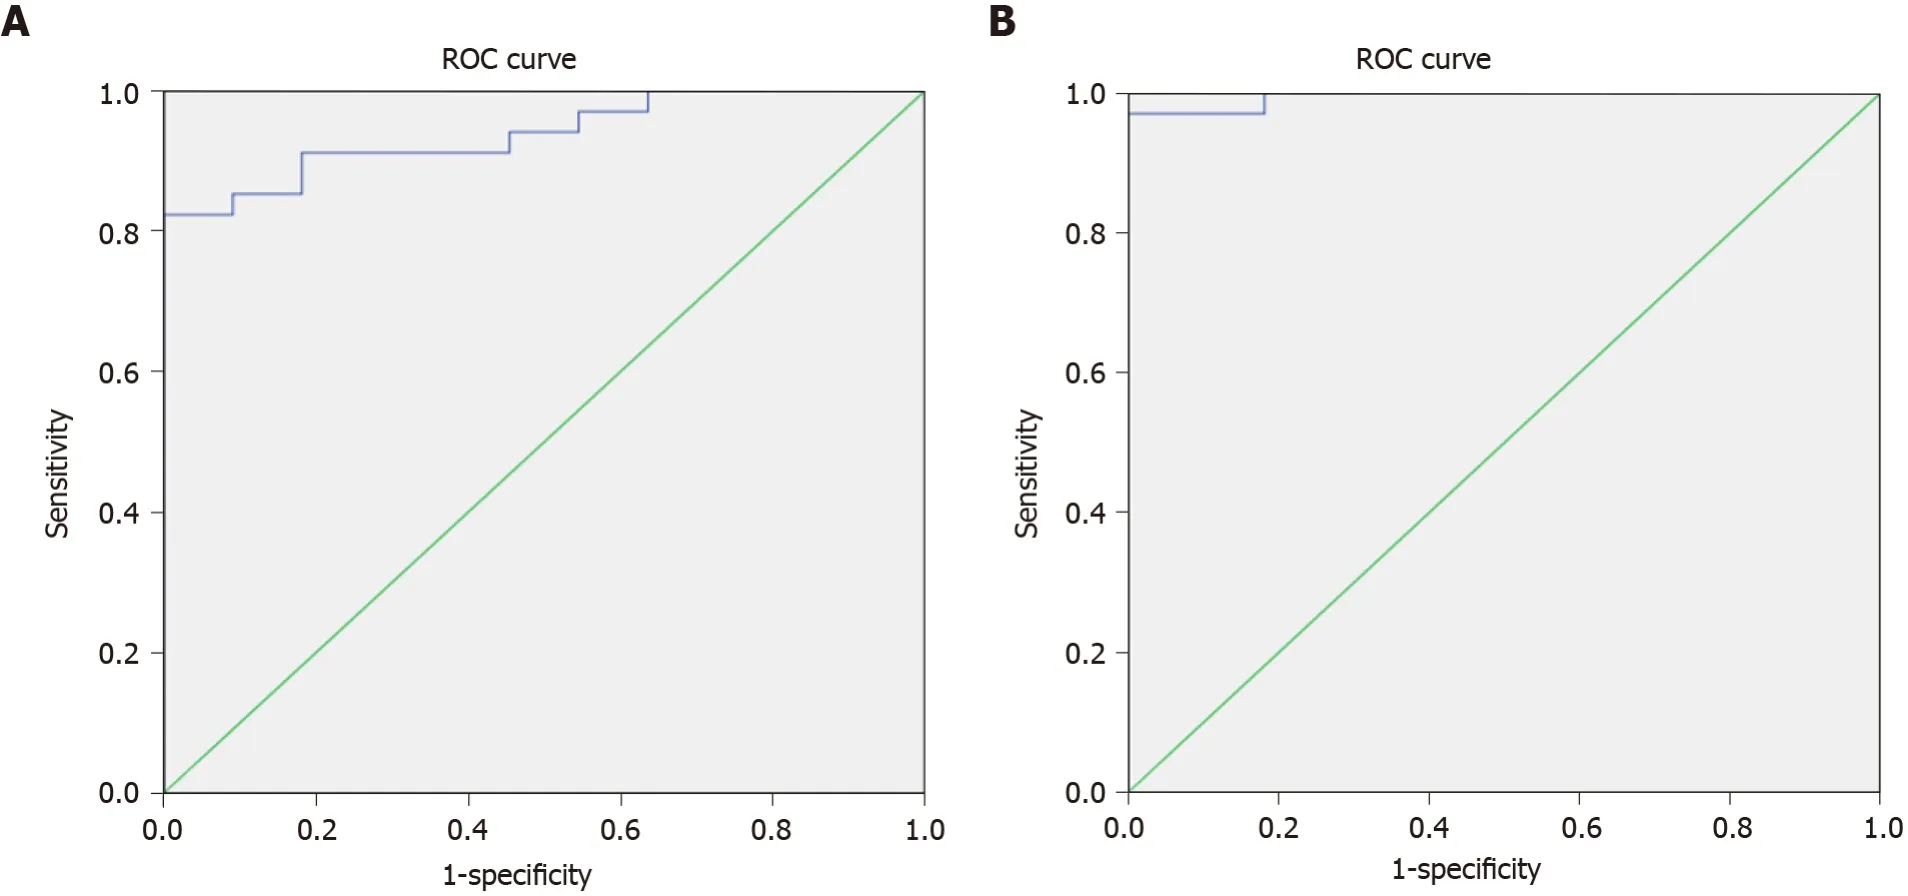
Figure 3 Receiver operating characteristic curves of the new diagnostic biomarkers studied to differentiate between hepatocellular carcinoma and chronic liver infection groups.
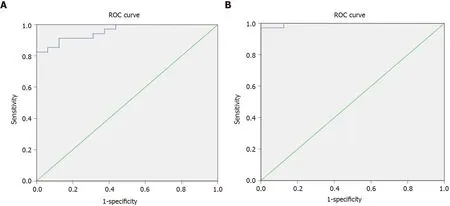
Figure 4 Receiver operating characteristic curves of the new diagnostic biomarkers studied to differentiate between the malignant and non-malignant groups.
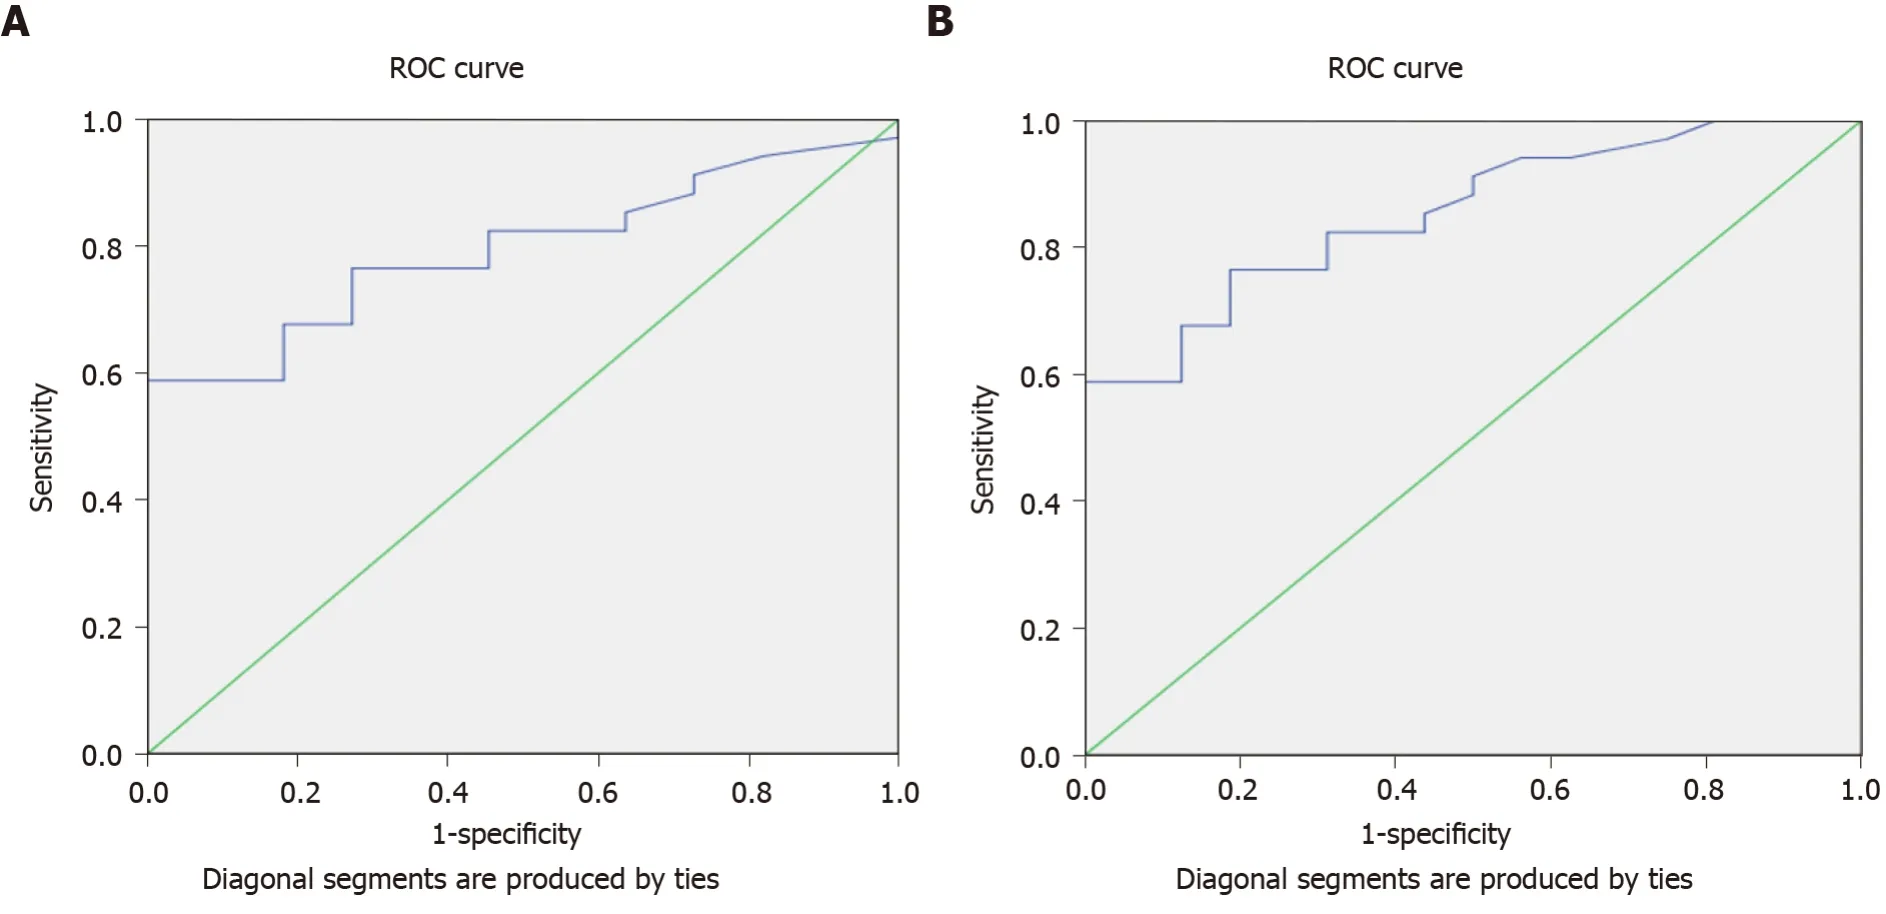
Figure 5 Receiver operating characteristic curves of the alpha-fetoprotein studied to differentiate between the hepatocellular carcinoma and chronic liver disease groups/malignant and non-malignant groups.
Most patients had early-stage HCC, except for three patients.The full details of the radiological findings are presented in Table 6.

Table 4 Expression level of hsa-miR-519d-3p, ACTB, RNU6, and SQSTM1 between the three study groups (mean ± SD)

Table 5 Alpha-fetoprotein laboratory results in the three subgroups

Table 6 Clinical and radiological characteristics of hepatocellular carcinoma lesions.
DISCUSSION
Our results suggest that hsa-miR-519d-3p is upregulated in the serum of the HCC group compared with the chronic liver disease and healthy control groups, with high sensitivity and specificity as a diagnostic marker.Similar results were observed by Fornariet al[18], where the miRNA was upregulated and considered an HCC oncogene.The study linked our target miRNA to DNA hypomethylation and p53, both of which are responsible for cell death and apoptosis.However, a recent study by Zhanget al[19] has linked miR-519d to the adenosine monophosphate-activated protein kinase pathway in HCC cells, regulating cellular energy metabolism by controlling the Ras-related protein (Rab10)[19].A recent study has raised the hope of inducing autophagy in hepatoma cells by the administration of metformin through the activation of the mechanistic target of rapamycin pathway[20].Alternatively, patients with colorectal cancer had improved survival and lower metastasis with upregulated miR-519d-3p by regulating trophinin-associated protein[11].
This study on serum mRNA ofSQSTM1revealed significant upregulation of its serum level in the HCC group as compared to the levels in the chronic liver disease and healthy control groups.Thus, our results mean that mRNA ofSQSTM1is upregulated in the serum of patients with HCC.This is compared to the findings of Xianget al[21] who have found higher expression levels of the encoded protein p62 in hepatoma cells of patients with hepatitis B infection or those exposed to aflatoxin B1[21], whereas our study population was mostly infected with hepatitis C virus.
TheSQSTM1gene is responsible for coding p62.This protein plays an important role as a receptor in selective autophagy, where specific cell organelles or proteins are degraded selectively by autophagosomes[22,23].This ubiquitin-binding receptor protein is upregulated in early-stage HCC, as it is responsible for the maintenance of cancerous cells and their survival during stress[24].
In addition, our results show that hsa-miR-519d-3p is upregulated, synchronously with the upregulation of the mRNA ofSQSTM1; this made us deduce that miRNA 519d stimulates theSQSTM1gene and increases the expression of its transcribed mRNA, not just increasing its translated protein level (p62) as previous studies have detected.In this study, we could not define the mechanism by which miR-519d-3p upregulatesSQSTM1, but we have identified that the gene is upregulated at the transcriptional level,notat the post-transcriptional level.Besides, we can conclude that miR-519d-3p can affect autophagy and induce the progression of HCC through the targeted upregulation ofSQSTM1.
In addition to these results, the sensitivity and specificity of hsa-miR-519d-3p, the mRNA ofSQSTM1, and AFP were 91.2%–81.8%, 97.1%–100%, and 76.5%–72.7%, respectively.Also, the best cutoff values of the three parameters were ≥ 8.34 for miR-519d, ≥ 7.89 for the mRNA ofSQSTM1, and ≥ 7.30 for AFP.Our results showed that miR-519d and the mRNA ofSQSTM1showed higher sensitivity and specificity than AFP, with better detection of early-stage HCC cases; thus can be used as diagnostic biomarkers for early HCC, improving the HCC outcome and prognosis.Moreover, when we compared the HCC group with the chronic liver disease group only or with the combined group of both patients with chronic liver disease and healthy subjects (malignant and non-malignant groups), we found similar results in both categories regarding hsa-miR-519d-3p, the mRNA ofSQSTM1, and AFP.
CONCLUSION
We are the first to establish a link between hsa-miR-519d-3p and the mRNA ofSQSTM1in HCC.Hsa-miR-519d-3p and the mRNA ofSQSTM1could be used in the diagnosis of HCC in its early stages.Further studies are needed to detect levels of miR-519d-3p and the mRNA ofSQSTM1before and after various modalities of treatment to assess their ability to monitor treatment responses and detect recurrences.Multicentric studies with more variability to validate the use of miR-519d-3P and the mRNA ofSQSTM1as diagnostic biomarkers of HCC on a wide scale are needed.
ARTICLE HIGHLIGHTS
Research background
Autophagy is one of the pathways affected in hepatocellular carcinoma (HCC).Genetic regulation of this pathway through the SQSTM1 gene was established.Autophagy is responsible for the destruction of cellular components through lysosomal degradation.This process is responsible for cellular recycling and preservation.It protects from cancerous transformation, thus any imbalance in this mechanism will increase the risk of cancer.
Research motivation
We aimed to establish the genetic-epigenetic-phenotypic pathway related to the autophagic process in the pathogenesis of HCC and whether these studied biomarkers could be used as surrogate diagnostic markers for autophagy pathway in HCC.
Research objectives
We examined hsa-miR-519d microRNA effect on HCC and its association with the SQSTM1 genetic marker.We also examined the sensitivity and specificity of those biomarkers in the diagnosis of early-stage HCC cases.
Research methods
This is an observational study.We evaluated the candidate biomarkers through bioinformatics, and after establishing a computational statistical relation, we proceeded with their clinical association through laboratory validation.We measured the genetic and epigenetic biomarkers in the serum samples taken from HCC patients,chronic liver disease patients, and healthy participants.We used reverse transcription polymerase chain reaction and quantitative reverse transcription-polymerase chain reaction.
Research results
We determined the sensitivity and specificity of each biomarker separately and combined as compared to the established alpha-fetoprotein (AFP) biomarker.We found that all the studied biomarkers in our study have better sensitivity and specificity than AFP, when used separately or combined, at the diagnosis of earlystage HCC.
Research conclusions
We could use the autophagy pathway biomarkers in the early-stage HCC diagnosis.
Research perspectives
More autophagy biomarkers could be examined using firstin silicoanalysis then clinical laboratory confirmation.Combining computational and clinical validations in clinical studies could benefit the research process immensely.
杂志排行
World Journal of Hepatology的其它文章
- Non-alcoholic fatty liver disease in irritable bowel syndrome: More than a coincidence?
- Liver-side of inflammatory bowel diseases: Hepatobiliary and druginduced disorders
- Gastrointestinal and hepatic side effects of potential treatment for COVID-19 and vaccination in patients with chronic liver diseases
- Genotype E: The neglected genotype of hepatitis B virus
- One stop shop approach for the diagnosis of liver hemangioma
- Liver function in COVID-19 infection
