Dispersion of neutron spin resonance mode in Ba0.67K0.33Fe2As2∗
2021-12-22TaoXie谢涛ChangLiu刘畅TomFennellUweStuhrShiLiangLi李世亮andHuiQianLuo罗会仟
Tao Xie(谢涛) Chang Liu(刘畅) Tom Fennell Uwe StuhrShi-Liang Li(李世亮) and Hui-Qian Luo(罗会仟)
1Beijing National Laboratory for Condensed Matter Physics,Institute of Physics,Chinese Academy of Sciences,Beijing 100190,China
2School of Physical Sciences,University of Chinese Academy of Sciences,Beijing 100190,China
3Laboratory for Neutron Scattering and Imaging,Paul Scherrer Institut,CH-5232 Villigen PSI,Switzerland
4Songshan Lake Materials Laboratory,Dongguan 523808,China
Keywords: iron-based superconductor,neutron spin resonance,magnetic excitations
1. Introduction
The neutron spin resonance mode is a prominent clue to understand the magnetically driven superconductivity in unconventional superconductors.[1,2]Experimentally, it is a sharp peak emerging in the low-energy spin excitations with intensity behaving like a superconducting order parameter,which has been extensively observed in copper-oxide,[3,4]heavy-fermion,[5,6]iron-pnictide,[7]and iron-chalcogenide superconductors.[8]The resonance energyERdefined at the peak point is generally proportional to the superconducting transition temperature(Tc)with a universal ratioER/kBTc=4–6.[1,2,9–12]Theoretically, the neutron spin resonance mode is commonly regarded as a spin exciton arising from the collective particle–hole excitations of gapped Cooper pairs. In this picture,the entire spin resonance should be below a spinflip continuum energy ¯hωcjust beneath the pair-breaking gap 2∆(∆is the superconducting gap),[1,2]and usually the mode energy follows another linear scalingER/2∆≈0.6 for most of unconventional superconductors.[13,14]When the spin resonance disperses to high energy approaching ¯hωc, it will become weaker and weaker,then finally damps out after entering the particle–hole continuum.[1,2]Therefore,the superconducting gap determines not only the upper limit of the resonance energy, but also the shape of the resonance dispersion.[12,15]In cuprates with d-wave pairing, ¯hωcseems like a complete dome with a strong momentum dependence from antinodal(∆max=∆0) to nodal region (∆min=0), resulting in a downward dispersion of spin resonance withER<2∆0.[1]In ironbased superconductors, the superconducting pairing symmetry is generally believed as a sign-reversed s±-wave between the hole and electron Fermi pockets.[16,17]The spin resonance arises from quasiparticle excitations with a finite wavevectorQthat connects those sign-changed pairs of Fermi pockets,thus ¯hωcis defined by the total superconducting gap summed on them: ¯hωc=∆tot=|∆k|+|∆k+Q|.∆totis momentum independent when only two similar sized Fermi pockets nest with each other.[18–20]In this case,a magnon-like upward dispersion of spin resonance is expected to be beneath the near constant ceiling of∆tot. This upward dispersion of spin resonance in the superconducting state is closely related to the anisotropic spin–spin correlation length in the normal state,but has a much lower velocity than the antiferromagnetic(AF)spin waves in parent compounds.[21–23]In most cases, the size mismatch of Fermi pockets together with the distribution of multiple gaps may further affect the dispersion of the resonance.[23,24]
Although the spin resonance mode has been observed in almost all of iron-based superconductors and generally follows both linear relations:ER/kBTc≈4.9 andER/∆tot≈0.64,[11–14]the resonance energy may exceed∆totin several particular compounds such as KxFe2−y(Se1−zSz)2,[25](CaFe1−xPtxAs)10Pt3As8,[26](Li0.8Fe0.2)ODFeSe[27]andACa2Fe4As4F2(A= K, Cs).[12,28]Instead of the excitonic scenario under s±-pairing, some of them may be alternatively explained as the self-energy effect induced redistribution of spin excitations under sign-preserved (s++)pairing.[29,30]In addition to the mode energyERat antiferromagnetic wavevectorQAF, the dispersion of the spin resonance seems to highly depend on the magnetic interactions in different compounds.[9]Weak out-of-plane dispersion of the spin resonance mode alongLdirection has been found in those superconducting compounds proximate to the three-dimensional (3D) stripe-type AF order [e.g.,BaFe2−x(Ni,Co,Ru)xAs2,BaFe2(As1−xPx)2,NaFe1−xCoxAs,Ba1−xNaxFe2As2,etc.],[31–37]while in those compounds with weak spin–orbital coupling (such as Ca1−yLayFe1−xNixAs2)or stoichiometric superconductivity(such as KCa2Fe4As4F2),the spin resonance is two-dimensional (2D) in reciprocal space.[11,12]In the bilayer CaKFe4As4system, the resonance intensity splits into two opposite harmonic modulations showing odd and even symmetries alongLdirection with respect to the distance of Fe–Fe planes within the Fe–As bilayer unit,but the resonance energies for both odd and even modes areLindependent.[14]So far,the investigations on the in-plane dispersion (alongHorKdirection) of spin resonance are quite limited in iron-based superconductors,since it is a great challenge to map the weak resonant signals away from the zone centerQAFand peak energyER. Previous inelastic neutron scattering measurements on BaFe2−xNixAs2reveal an upward in-plane dispersion of the resonance mode, thus it supports the spin excitonic picture and also explains the weakLdispersion as a consequence of the residual weak interlayer spin correlations.[21,24]However, an unusual downward in-plane dispersion of the resonance was recently discovered in the quasi-2D KCa2Fe4As4F2, which apparently exceeds∆totand deeply challenges the spin excitonic picture.[12]Therefore,it is essential to fully compare the in-plane dispersion of spin resonance mode with the superconducting gaps in each system of iron-based superconductors.
It was noted that the ringlike upward in-plane dispersion of spin resonance in Ba0.67K0.33(Fe1−xCox)2As2probably arises from particle–hole excitations on the imperfectly nested electron–hole Fermi surfaces.[23]However, their measurements were undertaken by time-of-flight neutron scattering experiments with fixedki ‖c∗, which means the energy transfer is always coupled with the momentum transfer alongLdirection. Previous reports on the band structure and superconducting gaps of Ba1−xKxFe2As2are controversial,thus the random phase approximation(RPA)calculation of the spin exciton model is inadequate to capture the details of the resonance dispersion.[22,23]Here, we measure the in-plane dispersion of spin resonance mode in Ba0.67K0.33Fe2As2in fixedLplanes in more detail using a triple-axis neutron scattering spectrometer,and compare with the gap distributions recently measured by high resolution angle resolved photoemission spectroscopy (ARPES). Our results show that the spin resonance quickly becomes incommensurate forE≥11 meV and disperses upwards at least up toE=26 meV, much higher than∆totfor all kinds of combination of hole–electron pockets. Therefore,the dispersion of the spin resonance cannot be fully accounted by particle–hole excitons under s±-pairing,as it may not be restricted by superconducting gaps in such multiband systems.
2. Experimental setup
High quality single crystals of Ba0.67K0.33Fe2As2were grown by self-flux method using FeAs as flux.[38,39]The largest sizes of our crystals are near 20 mm with homogenous composition. For neutron scattering experiments, about 11 g of crystals were co-aligned on rectangular aluminum plates by x-ray Laue camera using CYTOP hydrogen-free glue[Fig.1(a)]. Resistivity measurements on typical samples show a very sharp superconducting transition atTc=38.2 K within ∆T ≈1 K [Fig. 1(b)]. Magnetization measurements also show a sharp superconducting transition and a nearly full diamagnetic susceptibility 4πχ ≈−1 [Fig. 1(c)]. For easy comparison, we summarized the superconducting gap values measured by ARPES on optimally doped Ba1−xKxFe2As2in Fig. 1(d).[40–46]Since all measurements suggested isotropic(s-wave) gaps on each Fermi pockets at fixedkz, here∆totis the sum of the absolute gap value on a pair of hole–electron pockets connected by momentum transferQ,as shown in the inset of Fig. 1(d), where the deviations from the center point[Q=(1,0)]are due to the mismatch of the connected hole and electron pockets, and the horizontal bars on the data points mark their distribution in the reciprocal space. The early ARPES measurements seemed to overestimate the gap value,giving∆tot=16–24 meV[upper arc in Fig.1(d)].[40–42]From high resolution ARPES measurements based on high quality crystals,[43–45]especially the most recently published results based on laser-ARPES,[46]we estimated∆tot=11–17 meV,which forms a lower downward arc shape along the longitudinal direction [Fig. 1(d)]. Neutron scattering experiments were performed using thermal neutron triple-axis spectrometers EIGER at the Swiss Spallation Neutron Source (SINQ),Paul Scherrer Institut, Switzerland, with fixed final energyEf= 14.7 meV.[47]The scattering plane [H,0,0]×[0,0,L]is defined by a pseudo-orthorhombic magnetic unit cell witha ≈b ≈5.52 ˚A,c=13.22 ˚A,and the vectorQin reciprocal space is defined asQ=Ha∗+Kb∗+Lc∗,whereH,K,andLare Miller indices anda∗= ˆa2π/a,b∗= ˆb2π/b,c∗= ˆc2π/care reciprocal lattice basis vectors. In this case, the AF wave vector isQAF=[1,0,L](L=±1,±3,±5),andq=Q−QAFis the vector away from the zone center to describe the dispersion. The total sample mosaic, defined by the full-widthat-half-maximum (FWHM) of the rocking curve, was about 2.6◦for peak (2, 0, 0) and 2.8◦for peak (0, 0, 4). In Fig.1(e), we schematically depict the low-energy spin waves of the parent compound BaFe2As2,[48]together with the dispersion of spin resonance in a doped compound. If the spin resonance is indeed from particle–hole excitons under s±-pairing, it should be entirely below∆totwith upward dispersions but much slower velocity than the spin waves in the parent compound.[21–24]

Fig. 1. (a) Photo of Ba0.67K0.33Fe2As2 crystals used in our neutron scattering experiments. (b) Resistivity transition of superconductivity at Tc =38.2 K.(c)Magnetization transition of superconductivity under fieldcooling (FC) and zero-field-cooling (ZFC). (d) The total superconducting gaps ∆tot =|∆k|+|∆k+Q| on the hole and electron Fermi pockets linked by wavevector Q obtained from ARPES results. (e) Comparison between the dispersion of spin resonance mode in the superconducting compound and the spin wave in the parent compound (BaFe2As2) as predicted by the magnetic exciton scenario under s±-pairing symmetry, here assuming∆tot is momentum independent. (f) The neutron spin resonance peaks at Q = (1,0,L) (L = 2,3,4) deduced by subtracting the spin excitations at normal state (T =45 K) from those at superconducting state (T =1.5 K).(g)The neutron spin resonance peaks normalized by the magnetic form factor of Fe2+.
3. Results and discussion
We firstly identify the spin resonance peak by constant-Qscans(energy scans)atQ=(1,0,L)(L=2,3,4). By subtracting the spin excitations at normal state(T=45 K)from those at superconducting state (T=1.5 K), we find a strong peak with clear intensity gain from 8 meV to 20 meV in superconducting state,the peak position forL=2 and 4 is 15 meV,and forL=3 is slightly lower at 14 meV [Fig. 1(f)]. By further normalizing the intensity using the square of magnetic form factor of Fe2+(|F(Q)|2), it seems that all three peaks have similar shape except for a small shift to low energy side forL=3. Such results suggest that the spin resonance intensity does not have anyLmodulation,and theLdispersion ofERis very weak,namely,the resonance mode is nearly 2D in reciprocal space. These results are consistent with previous reports on the spin resonance energy and the weakkzmodulation in most of superconducting gaps.[23,39,45]
To determine the in-plane dispersion of the spin resonance, we have performed constant-energy scans (Q-scans)alongQ=[H,0,3]fromE=3 meV to 24 meV both atT=1.5 K (superconducting state) andT=45 K (normal state).Due to the limitation from spectrometer itself and the scattering rule,the scattering triangle cannot be closed for lowQside ofE=22 meV and 24 meV with fixedL=3, we thus measured theE=26 meV alongQ=[H,0,4]. The raw data are shown in Fig. 2, the flat backgrounds are already subtracted.To confirm the 2D behavior, additional scans atE=3 meV,9 meV and 18 meV were also measured alongQ=[H,0,4](data not shown). The signals at high energy are contaminated by spurious scattering possibly from the phonons of the sample holder or multiple scattering of Bragg peaks,which should be almost temperature independent within the measured range 1.5–45 K but only broaden the peak width. We find clear enhancements of the intensity aboveE=9 meV atT=1.5 K from the spin resonance. Due to the opening of full superconducting gaps belowTc,the spin excitations atE=3 meV are nearly fully gapped[Fig.2(a)],and there are still intensity loss and peak sharpening atT=1.5 K for low energies 3–8 meV,which can be explained as a strengthened spin–spin correlation length responding to the superconducting order.[39]From the raw data,we cannot identify any incommensurate spin excitations even in the superconducting state. Thus we have simply performed the single Gaussian fitting for all raw data peaks both atT=1.5 K andT=45 K, as shown by solid lines in Fig. 2. The FWHM of such fitting roughly reflects the energy and temperature dependence of the spin–spin correlation length[Fig.4(c)].
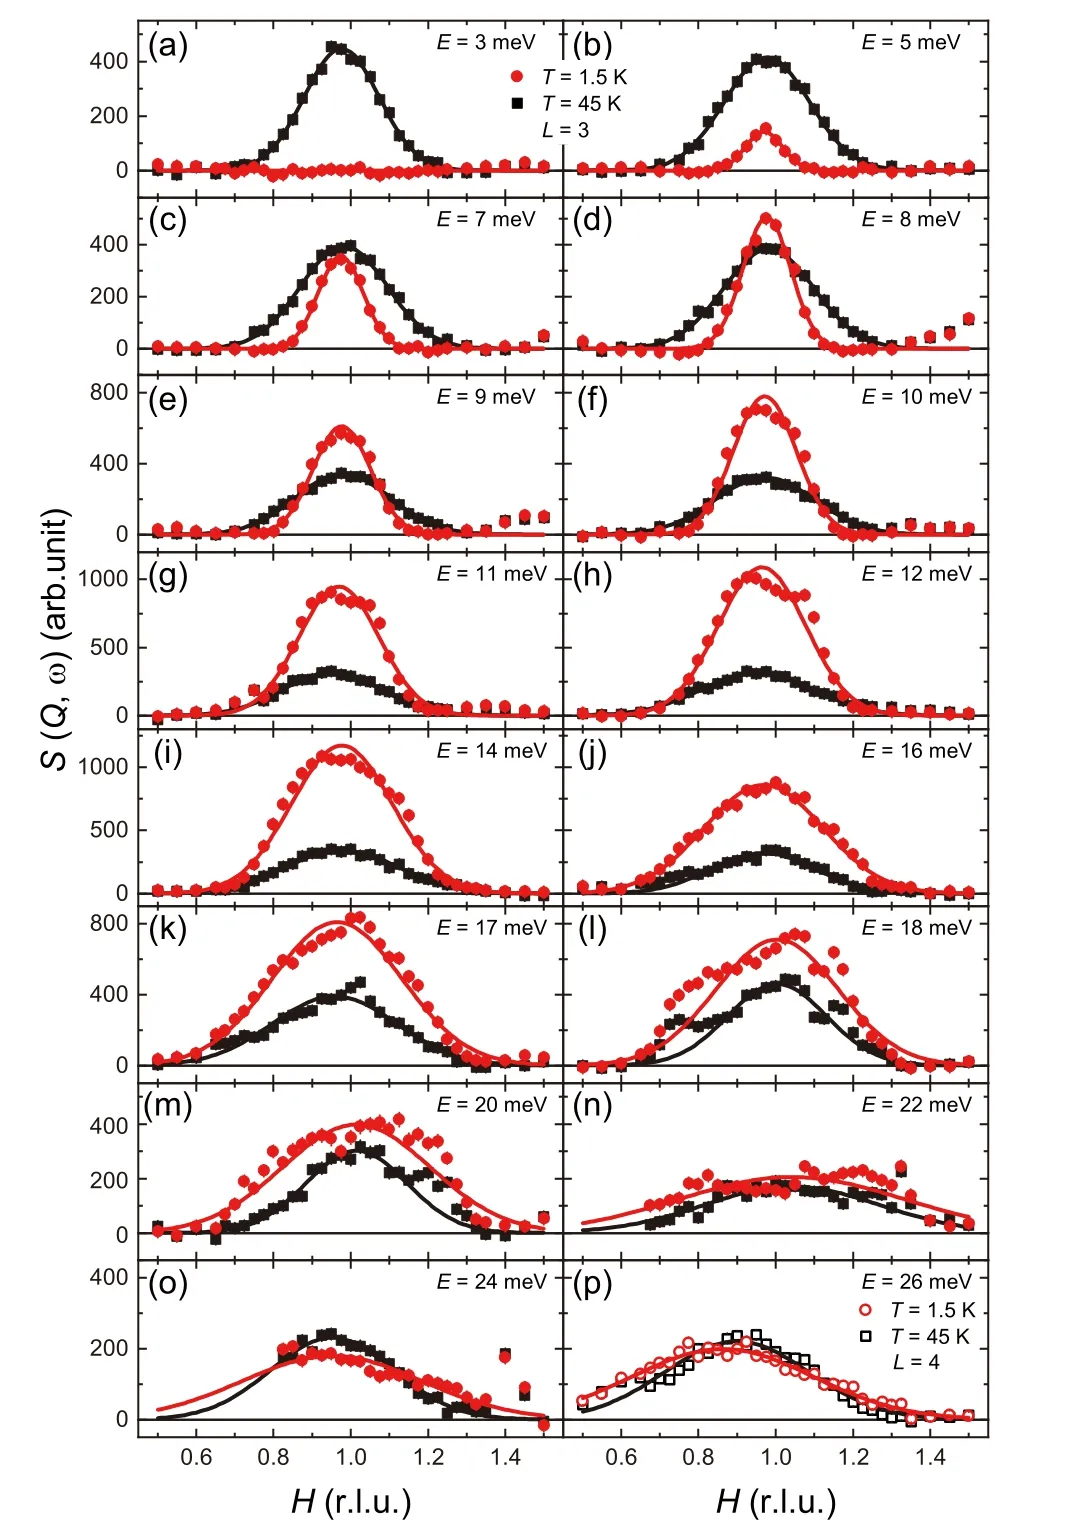
Fig. 2. Constant-energy scans along Q = [H,0,3] from E = 3 meV to 24 meV and along Q=[H,0,4] for E =3 meV , 18 meV and 26 meV measured both at T =1.5 K(red)and T =45 K(black). The solid lines are fitting curves by single Gaussian functions.

Fig. 3. The difference between T =1.5 K and 45 K of constant-energy scans in Fig.2(∆Int.=Int.(T =1.5 K)−Int.(T =45 K)). The solid lines for E=3 meV,5 meV,7 meV,8 meV,9 meV are obtained by the difference(1.5 K−45 K)of single Gaussian fitting in Fig.2,and other solid lines for E =10–26 meV are fitting curves by two symmetric Gaussian functions.For comparison,the results along Q=[H,0,4]at E =3 meV,18 meV and 26 meV are also presented by open symbols.
From thoseQ-scans in Fig. 2, we obtain cleanQdistribution of the spin resonance by doing subtraction∆Int.=Int.(T=1.5 K)−Int.(T=45 K),as shown in Fig.3.The spin gap atE=3 meV has similar peak width forL=3(FWHM=0.259 r.l.u.) andL= 4 (FWHM=0.245 r.l.u.)[Fig. 3(a)]. At the commensurate position ofQAF=(1,0,3)(Brillouin zone center withq= 0), the change of correlation length firstly induces a small tip in the center of ∆Int atE= 5 meV [Fig. 3(b)], and evolves to two negative peaks atE= 7 meV [Fig. 3(c)] and a partially positive peak atE= 8 meV [Fig. 3(d)]. To identify the starting energy of resonance intensity, we integrate ∆Int. and then find that it becomes positive whenE> 9 meV [Fig. 3(e)], as there is certainly a positive peak atE=10 meV [Fig. 3(f)]. Therefore,the spin resonance actually emerges between 9 meV and 10 meV, or even lower energy∼8 meV if only considering the excitations nearq=0. The resonance peak quickly disperses to incommensurate positions as shown by the data aboveE=11 meV[Figs.3(g)–3(p)],because all of them can be well fitted by two symmetric gaussian functions. The incommensurabilityδalongHdoes not haveLdependence,as manifested by the nearly overlapped data points forL=3 andL=4 atE=18 meV within the experimental errors[Fig.3(i)].Thus we could track the in-plane dispersion of spin resonance by combining the results both fromL=3 andL=4 due to its 2D nature.
The peak positions determined by the incommensurability are present in Fig. 4(a). ForE=9 meV, we simply show the commensurate position with a horizontal error bar to represent the estimated peak width of the positive part. The lower arc shape of∆totfrom high resolution ARPES measurements shown in Fig.1(d)is also present in Fig.4(a)for direct comparison,and the gradient colors represent the intensity of ∆Int.obtained from Fig. 3. Apparently,∆totjust cuts through the waist of the resonance mode. Although the most intensity of ∆Int. locates belowE= 17 meV, the dispersion of the resonance mode can break though∆totand persist to at leastE=26 meV [Figs. 3(p) and 4(a)]. We replot the resonance peak in Fig. 4(b) by using the integrated intensity of ∆Int.from constant-energy scans alongQ=[H,0,3]in Fig.3. The peak energy still locates atE=14 meV, but the peak shape slightly shifts to high energy in comparison to theE-scan atQ=(1,0,3) shown in Fig. 1(f). The peak widths from single Gaussian fitting in Fig. 2 are plotted in Fig. 4(c), both results atT= 1.5 K andT= 45 K linearly increase upon energy, but the two lines cross around the resonance energyER= 14 meV. Namely, the correlation length in superconducting state is elongated below the mode center energyER,but shorten aboveERdue to the effect from dispersion of the resonance.

Fig.4. (a)Dispersion along H of the spin resonance. Here the solid squares mark the incommensurate peak positions from two-Gaussian-fitting of the resonance peaks,the horizontal bar at E=9 meV is the estimated width for positive part of ∆Int.,and the contour colors represent the intensity obtained from the solid lines in Fig. 3. The distribution of ∆tot is also shown as the white arc[same as the lower arc in Fig.1(d)].(b)Integrated intensity of ∆Int.obtained from constant-energy scans along Q=[H,0,3]in Fig.3.The solid line is guide to eyes,and the dashed line is normalized intensity from the Escan at Q=(H,0,3)in Fig.1(f). (c)Comparison of the peak width between T =1.5 K and T =45 K along Q=[H,0,3] from single-Gaussian-fitting curves in Fig.2.


4. Conclusion
To summarize, we have carefully examined the in-plane dispersion of spin resonance mode in Ba0.67K0.33Fe2As2. The mode energy with maximum intensity locates atE=14 meV forQ=(1,0,3), but the resonance may emerge at lower energy(E=9–10 meV)and quickly disperse to incommensurate positions(q/=0)persisting up toE=26 meV.While the estimated resonance velocity by the spin exciton model agrees reasonably well with experimental observation,the dispersion of spin resonance breaks through the limit of the total superconducting gaps∆tot. Our results suggest that the detailed behaviors of spin resonance in iron-based superconductors may be closely related to its multi-band nature.By comparing them among different systems would inspire new mechanisms of magnetically driven superconductivity.
Acknowledgments
The authors thanks the helpful discussion with Prof.Jiangping Hu and Prof. Jianxin Li. This work is based on neutron scattering experiments performed at the Swiss Spallation Neutron Source (SINQ), Paul Scherrer Institut, Villigen,Switzerland(Proposal No.20180227).
猜你喜欢
杂志排行
Chinese Physics B的其它文章
- Modeling the dynamics of firms’technological impact∗
- Sensitivity to external optical feedback of circular-side hexagonal resonator microcavity laser∗
- Controlling chaos and supressing chimeras in a fractional-order discrete phase-locked loop using impulse control∗
- Proton loss of inner radiation belt during geomagnetic storm of 2018 based on CSES satellite observation∗
- Embedding any desired number of coexisting attractors in memristive system∗
- Thermal and mechanical properties and micro-mechanism of SiO2/epoxy nanodielectrics∗