Soil chronosequence and biosequence on old lake sediments of the Burdur Lake in Turkey
2021-12-22GafurGOZUKARAYakunZHANGAlfredHARTEMINKSevdaALTUNBASandMustafaSARI
Gafur GOZUKARAYakun ZHANGAlfred E.HARTEMINKSevda ALTUNBAS and Mustafa SARI
1Department of Soil Science and Plant Nutrition,Eskisehir Osmangazi University,Eskisehir 26160(Turkey)
2Department of Soil Science,FD Hole Soils Lab,1525 ObservatoryDrive,Universityof Wisconsin-Madison,Madison 53706(USA)
3Department of Soil Science and Plant Nutrition,AkdenizUniversity,Antalya 07059(Turkey)
(Received December 11,2019;revised March 21,2020)
ABSTRACT The Burdur Lake is located in the southwest of Turkey,and its area has decreased by 40%from 211 km2 in 1975 to 126km2 in 2019.In this study,we investigated how the soil has changed in the lacustrine material.Three soil profiles were sampled from the former lakebed(chronosequence profiles:P1,2007;P2,1994;and P3,1975),and three soil profiles under different land use types(biosequence profiles:P4,native forest vegetation;P5,agriculture;and P6,lakebed)were sampled.The chronosequence and biosequence soil profiles represented various distances from the Burdur Lake and showed different stages of lacustrine evolution.Soil electrical conductivity(EC;18.1 to 0.4 dS m-1),exchangeable Na+ (34.7 to 1.4 cmol kg-1)and K+ (0.61 to 0.56cmol kg-1),and water-soluble Cl- (70.3 to 2.1 cmol L-1)and (275.9 to 25.0 cmol L-1)decreased with increasing distance from the Burdur Lake,whereas the A horizon thickness(10 to 48 cm),structure formation(0 to 48 cm),gleization-oxidation depth(0 to 79 cm),and montmorillonite and organic matter(OM;25.9 to 46.0 g kg-1)contents increased in the chronosequence soil profiles.The formation of P3 in the chronosequence and P5 in the biosequence soil profiles increased due to longer exposure to pedogenic processes(time,land use,vegetation,etc.).Changes in EC,exchangeable cation(Na+ and K+)and water-soluble anion(Cl- and SO2-4 )concentrations of the salt-enriched horizon,OM,gleization-oxidation depth,A horizon thickness,and structure formation of the chronosequence and biosequence soil profiles(especially the topsoil horizon)were highly related to the distance from the Burdur Lake,time,and land use.
KeyWords: biosequence soil profile,chronosequence soil profile,lacustrine material,lakebed,soil formation
INTRODUCTION
Lakes often occur in closed depression areas, and the materials transported by the surface flow from the surrounding highlands accumulate as periodic and/or annual layers on both the bottom and in the vicinity of the lakes(Gozukara and Altunbas,2016).These materials,accumulated over time by water and wave movements in the lake basin, become a flat landscape and are known as lacustrine deposits(Soil Survey Staff,1993;Schnurrenbergeret al.,2003).
Increased use of water for drinking and agricultural practices(farming,irrigation,fisheries,and stockbreeding),pollution,urbanization,climate change,and reduced water flow into the lake have severely reduced the water levels of the lake(Hartiget al.,1997;Zedler,2003;Bassiet al.,2014;Fickaset al.,2016).Thus,sediments accumulated in the lake reservoir were exposed as a result of reduction of water level and these deposits are known as the lacustrine material(Soil Survey Staff,1993).The lacustrine deposits,serving as the main parent material in the process of soil formation(i.e.,pedological processes),begin to form soil under the effects of climate,topography,and vegetation over time.Substantial variations occur spatially and temporally in the soils,developed on the lacustrine parent materials with different physical,chemical,and mineralogical properties that affect land use and productivity (Moustakas, 2012;Ozaytekinet al.,2012;Furquim,2017;Hamzehpouret al.,2018).Some studies have investigated the underlying factors affecting water level change in lakes and wetlands over time and identified the areas that have emerged(Munyati,2000;Kent and Mast,2005;Cuiet al.,2016;Gozukaraet al.,2019a,b),while others have investigated the physical,chemical,and mineralogy properties of the soil developing in these areas(Ozaytekinet al.,2012;Altunbaset al.,2019;Lizagaet al.,2019;Tunçayet al.,2019).
There are many wetlands in southwestern Turkey,which is known as the Lakes Region(Kazancıand Roberts,2019).One of the most important wetlands in the Lakes Region is the Burdur Lake. The water level of the Burdur Lake increased approximately 150 m during the Last Glacial Age(20 000 years ago)due to the cold climatic condition and low evaporation,but started to decline at the beginning of the Holocene period due to increasing precipitation and temperature (Yiğitbaşıoğlu, 2003; Robertset al., 2004;Atalay,2012,2017;Tudrynet al.,2013).In recent years,the water level of the lake has decreased dramatically(Gozukaraet al.,2019a,b,2020).Pedogenesis occurs at various levels and over different periods and locations on the lacustrine materials exposed after water withdrawal. Today, spatial and temporal variations in soil formation and development have been observed in this region. Some soils have been used for agricultural production,whereas the younger soils(with water withdrawal from 1975 to 2019)are still to be determined for possible land uses and applications(Gozukaraet al., 2019a, b, 2020). However, the developments and changes in soil properties affect the potential productivity of the land and the ways in which it is used(Ozaytekinet al., 2012; Vilmundardóttiret al., 2014; Mankasingh and Gísladóttir,2019).
The study aimed to 1)evaluate the temporal size changes in the Burdur Lake between 1975 and 2019,2)investigate the pedogenesis of the soils formed during different periods as the water levels decreased(chronosequence),and 3)investigate the variations in soils formed under different vegetation types around the lake(biosequence).
MATERIALS AND METHODS
Studyarea
This study was conducted in a Ramsar wetland in the Lakes Region of Turkey. The study area is located on the borders of Isparta and Burdur cities(37°32′32′′—37°54′35′′N,30°00′06′′—30°28′12′′E),covering an area of 740.22 km2(Fig. 1). This area has a transitional climate between the continental climate of central Anatolia and the Mediterranean climate, characterized by cool rainy winters and hot dry summers (Atalay, 2012). The mean annual temperature,precipitation, and surface evaporation between 1975 and 2018 were 13.3°C,419.01 mm,and 1 202.3 mm,respectively(Fig. 2). The elevation of the study area varied from 841(Burdur Lake)to 1 000 m(boundary of the study area).
Temporal changes of the lake area
The Burdur Lake is shrinking with time as a result of constructed dams around the lake area that restrict water flow into the lake, tectonic fissures, separation of water from the environment, erroneous agricultural production patterns,irrigation,public water consumption,and climate change(1975—2018).Four satellite images of different years were downloaded from the United States Geological Survey(USGS)website(http://glovis.usgs.gov/)to demonstrate the changes in the lake area (Table I). The boundaries of the Burdur Lake and the temporal changes of the lake area were determined using ArcGIS 10.3 with polygon digitalization.
Sample collection and analysis
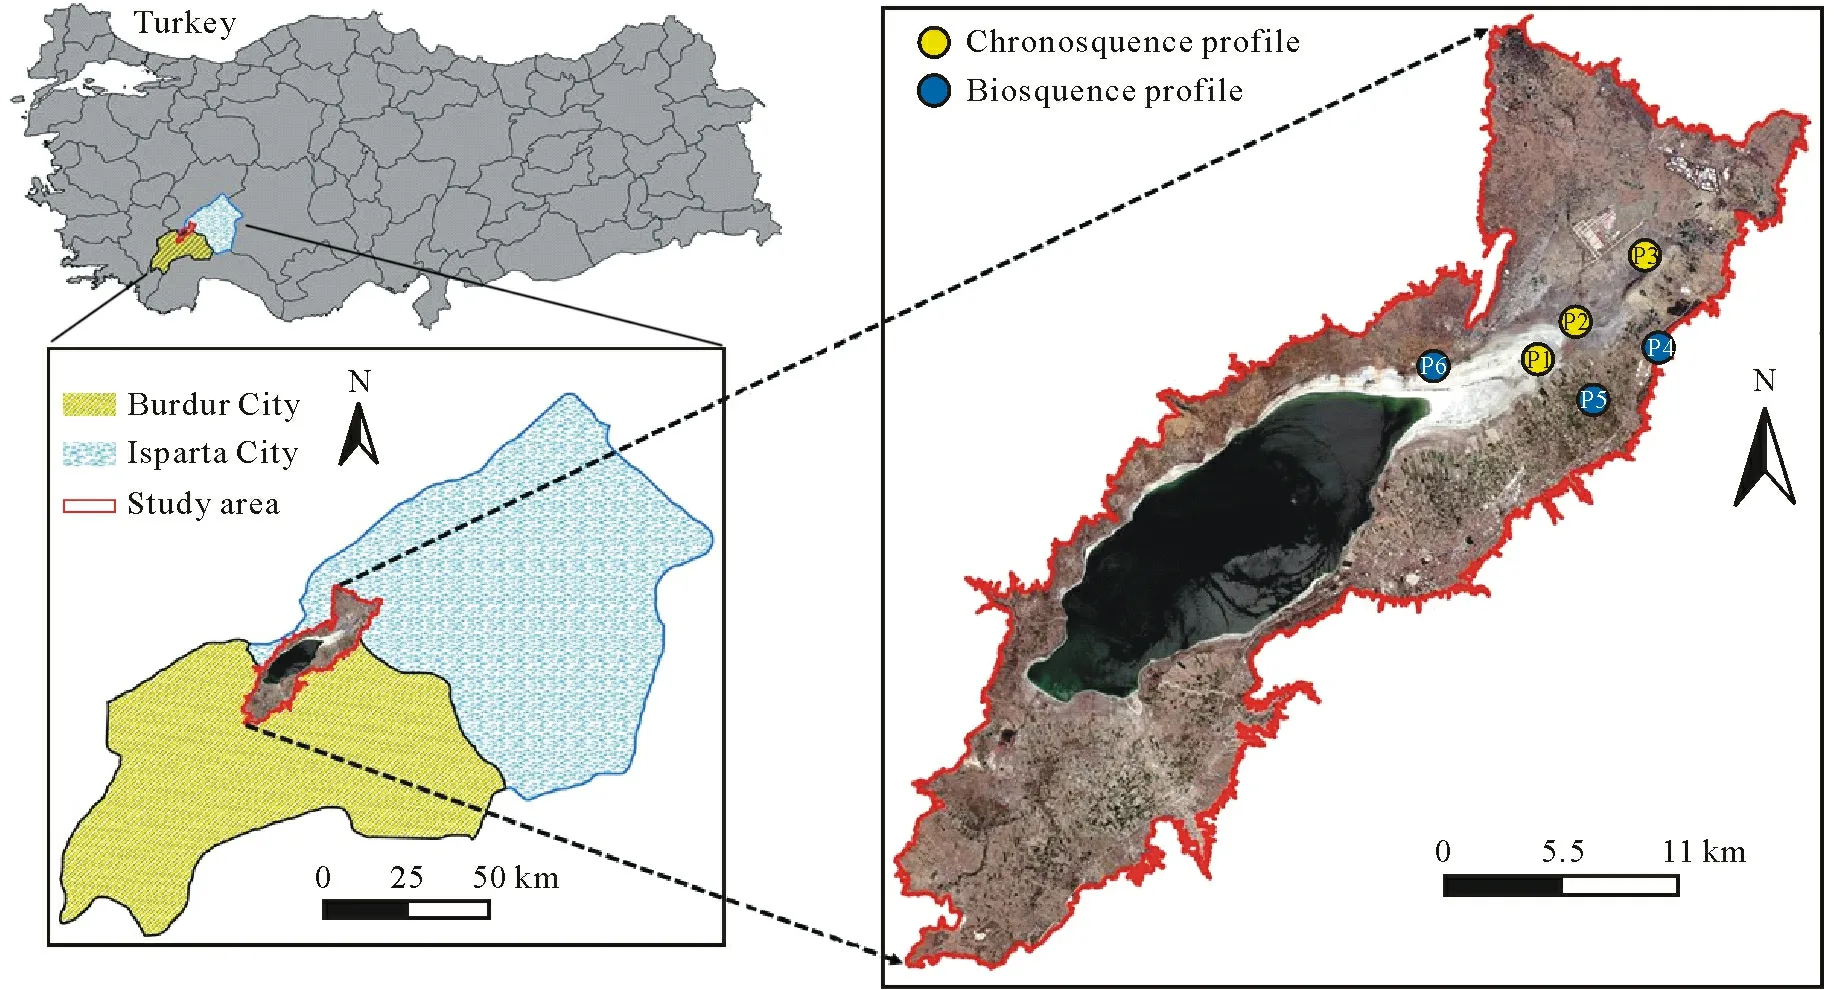
Fig.1 Location of the study area on the borders of Isparta and Burdur cities,Turkey.Three soil profiles developed from different years on the former lakebed(P1,2007;P2,1994;and P3,1975)were used as a chronosequence and three profiles under different Land use types(P4,native forest vegetation;P5,agriculture;and P6,lakebed)as a biosequence.

TABLE I Satellite images of the study area between 1976and 2019

Fig.2 Annual average temperature,total precipitation,and surface evaporation of the study area between 1975 and 2018.
Three soil profiles(Profiles 1—3)were sampled for the chronosequence study,and another three profiles(Profiles 4—6)were sampled for the biosequence study(Fig.1).As the lake shrank, the lakebed was gradually exposed to the air and the soils developed.The three chronosequence profiles were sampled from newly developed soils. Profile 1 (P1)was the newest profile,developed from 2007,and salt was accumulated on the surface of P1(Fig.3).Profile 2(P2)was developed from 1987,and the surface was covered by grass.Profile 3(P3)was the oldest,developed from 1975,and the surface was covered by grass.The three biosequence profiles were sampled from the soils under different land use types.Profile 4 (P4) was developed on native forest vegetation,profile 5(P5)on agricultural land,and profile 6(P6)on a lakebed(Fig.3).The topography of the profiles was mostly flat.
For each profile, the soil horizons were described in the field, and three soil samples were taken from each horizon. The three soil samples were mixed (creating a composite sample per horizon)and stored in a plastic bag.The soil samples from each horizon were air-dried and sieved for laboratory analyses of texture, organic matter (OM),electrical conductivity (EC), exchangeable K+and Na+,and water-soluble Cl-and.Soil OM was measured by the Walkley-Black method(Black,1965).Soil EC was measured potentiometrically in a 1:2.5 (weight/volume)soil/water suspension with a glass electrode(U.S.Salinity Laboratory Staff,1954).Exchangeable K+and Na+of soil samples were extracted by 1 mol L-1CH3COONH4at pH 7 and measured by an inductively coupled plasma-optical emission spectrometer(PE-Optima 7000DV,PerkinElmer,USA)(U.S.Salinity Laboratory Staff,1954).Water-soluble Cl-(Johnson and Ulrich,1959)and(Foxet al.,1964)were measured with the titrimetric method.
The mineralogical analyses aimed to identify the clay minerals in the clay fraction. Clay mineralogy was also measured for the soil samples from the three chronosequence soil profiles. The clay fraction (<2 μm) was extracted from the soil after removal of organic matter using diluted CH3COONa-buffered H2O2(pH=5),followed by dispersal using Calgon and sedimentation in water.Oriented specimens on glass slides were analyzed with X-ray diffraction(XRD),using CuKαradiation from 2°to 15°2θ,with steps of 0.02°2θat 2 per step.The following treatments were performed:Mg saturation,ethylene glycol solvation,and K saturation,followed by heating for 2 h at 550°C.The clay minerals were identified,and their relative abundances were determined by their diagnostic XRD spacing.The minerals were evaluated by their relative peak intensities in the XRD patterns(Whittig and Allardice,1986).
Data analysis
Soil physical and chemical properties and the ion concentrations of each horizon were interpolated into 1-cm intervals from 0 to the maximum profile depth using the equal-area quadratic spline function with the interval of depth functions(λ)=1(Bishopet al.,1999)in Matlab R2019a.
RESULTS
Climate and temporal changes in the Burdur Lake
Total evaporation and average temperature tended to increase from 1975 to 2018. However, total precipitation tended to decrease from 1975 to 2018(Fig.2).The temporal changes in the Burdur Lake between 1975 and 2019 are shown in Fig.4.The area of the Burdur Lake decreased from 211.01 to 125.76km2between 1975 and 2019,corresponding to an area loss of 40.40%.As a result,approximately 85.25 km2of lacustrine material was exposed to the air.There were 9.59 km2of lacustrine material that emerged between 1975 and 1987,47.63 km2emerged between 1987 and 2002,and 28 km2emerged between 2002 and 2019.
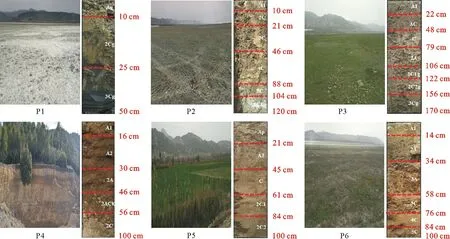
Fig. 3 Characteristics of chronosequence soil profiles developed from different years on the former lakebed (P1, 2007; P2, 1994; and P3, 1975) and biosequence soil profiles under different land use types(P4,native forest vegetation;P5,agriculture;and P6,lakebed).
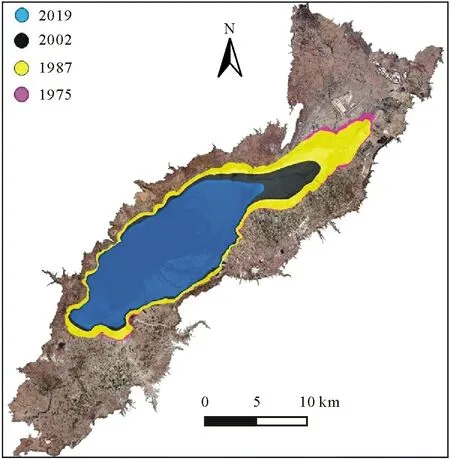
Fig.4 Changes in the area of the Burdur Lake between 1975 and 2019.
Pedogenesis of chronosequence soil profiles
Soil morphological,physical,and chemical properties of the chronosequence soil profiles are presented in Table II.Soil structure was described for each horizon of the three chronosequence profiles.For A horizons,P1(0—10 cm)was massive,P2(0—10 cm)was weak fine subangular,and P3(0—22 cm)was moderate medium subangular.The C horizons of the three profiles possessed massive structures,indicating that the deposits have not yet suffered extensive pedogenesis.The Munsell color was 2.5Y(moist)for all horizons in P2 and P3,2.5Y(moist)for A1 horizon,and Gley1(moist)for 2C and 3C horizons in P1.
The temporal changes in the topsoil (A horizon) properties of the chronosequence profiles are shown in Fig.5.The EC,exchangeable Na+,and water-solubleshowed similar trends in the topsoil.As the soil developed and became older,these properties decreased greatly,and greater decreases were observed in the first 20 years(from 1994 to 2007).Water-soluble Cl-decreased from 1994 to 2007,but was constant between 1975 and 1994. Exchangeable K+gradually decreased with time at a relatively constant rate.The OM and clay contents of the topsoil increased gradually from 25.9 to 46.0 g kg-1and from 25.94% to 57.45%,respectively.
The temporal changes in the selected soil properties of the whole soil profiles are shown in Fig.6. P1(0—50 cm)was much shallower than P2(0—120 cm)and P3(0—170 cm).The values of EC,Na+,K+,Cl-,andat all depths were greater in P1 (youngest profile) than in P2 and P3.There were little differences in Cl-andbetween P2 and P3.The OM content in the topsoil increased in the order of P1,P2,and P3(younger to older soils),but increased in the order of P2,P3,and P1 in the subsoil and deeper soils.Greater values of EC,Na+,Cl-,andwere observedin the topsoil than in deeper soils of P1.In P2 and P3,EC,Na+,Cl-,andincreased from the topsoil to subsoil and then decreased with soil depth.The OM content varied from 46.0 to 25.9 g kg-1in the topsoil and from 38.8 to 3.8 g kg-1in the subsoil.Generally,OM increased slightly with soil depth in P1,but decreased in P2 and P3.The K+content increased with soil depth in P1,but decreased in P2 and P3.
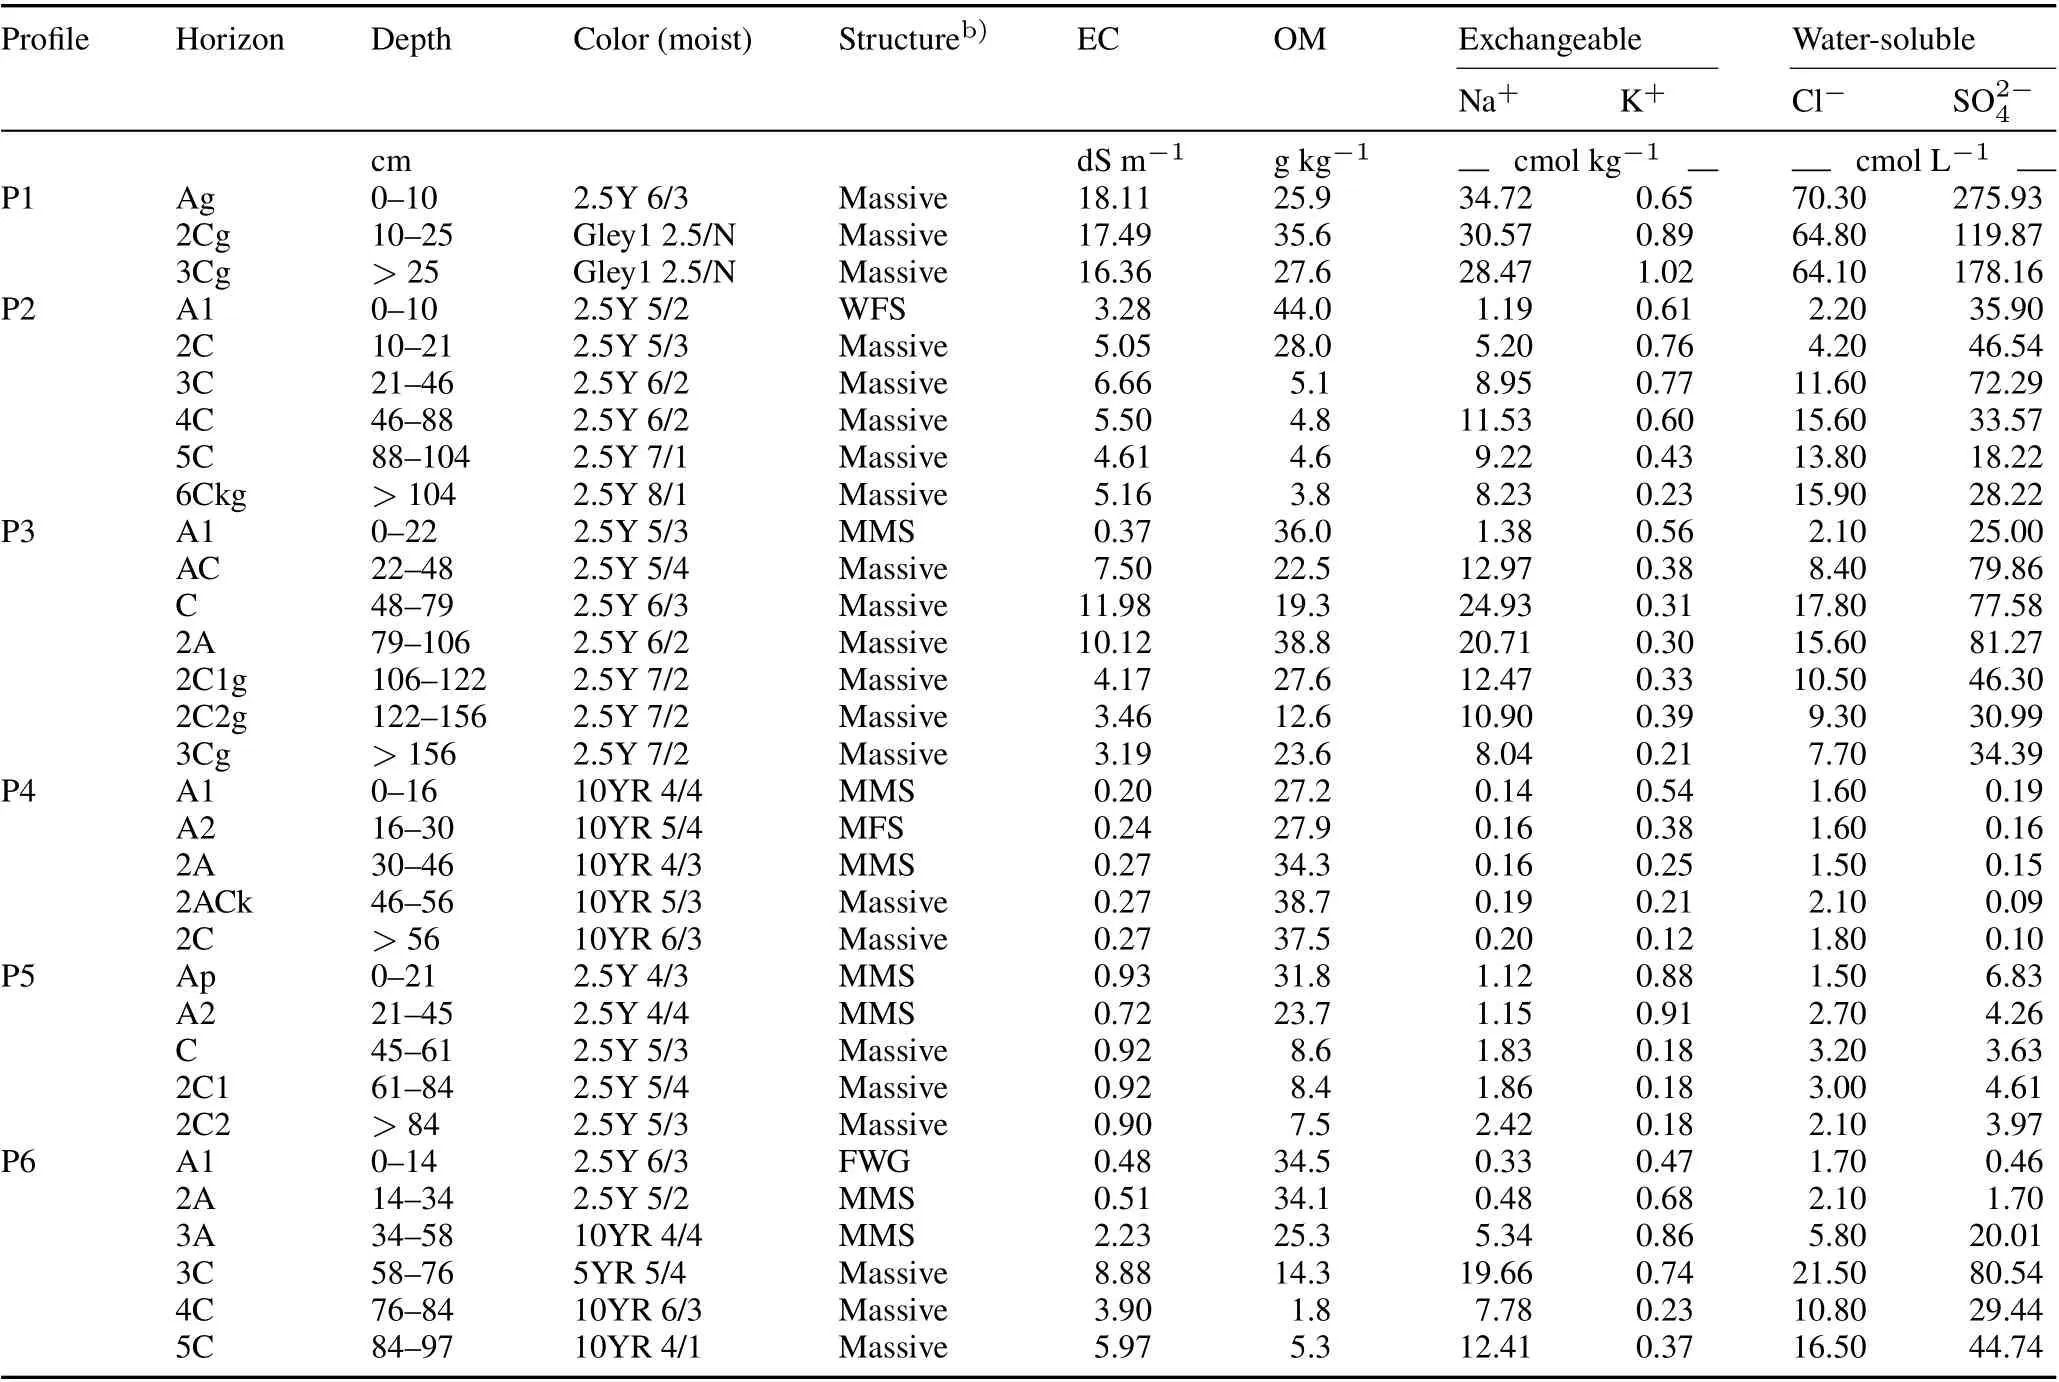
TABLE II Soil morphological,physical,and chemical propertiesa) of the chronosequence soil profiles developed from different years on the former lakebed(P1,2007;P2,1994;and P3,1975)and biosequence soil profiles under different land use types(P4,native forest vegetation;P5,agriculture;and P6,lakebed)

Fig.5 Changes in the selected soil properties of A horizons of the three chronosequence soil profiles developed from different years on the former lakebed(P1,2007;P2,1994;and P3,1975).EC=electrical conductivity;OM=organic matter.
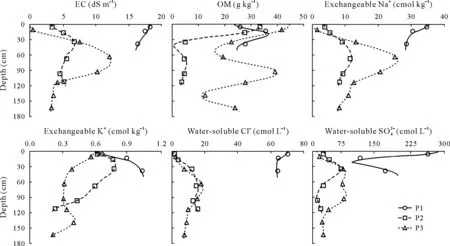
Fig.6 Changes in the selected soil properties with increasing depth in the three chronosequence soil profiles developed from different years on the former lakebed(P1,2007;P2,1994;and P3,1975).Depth functions were fitted using equal-area quadratic spline functions with the interval of depth functions(λ)=1.EC=electrical conductivity;OM=organic matter.
The X-ray diffractograms of the topsoil (A horizon)samples of the three chronosequence profiles are shown in Fig.7.Different amounts and crystallization degrees of clay mineralogy were found in the chronosequence profiles.Chlorite,illite,and kaolinite were the dominant clay minerals observed in all the three profiles,and P3(the oldest profile)had the highest amounts of these minerals.P3 had a higher amount of chlorite than illite and the least amount of kaolinite.Montmorillonite was only observed in P3 and occurred in higher amounts than the other minerals.The intensities of reflection of montmorillonite,chlorite,illite,and kaolinite tended to increase as the soils developed.
Pedogenesis of biosequence soil profiles
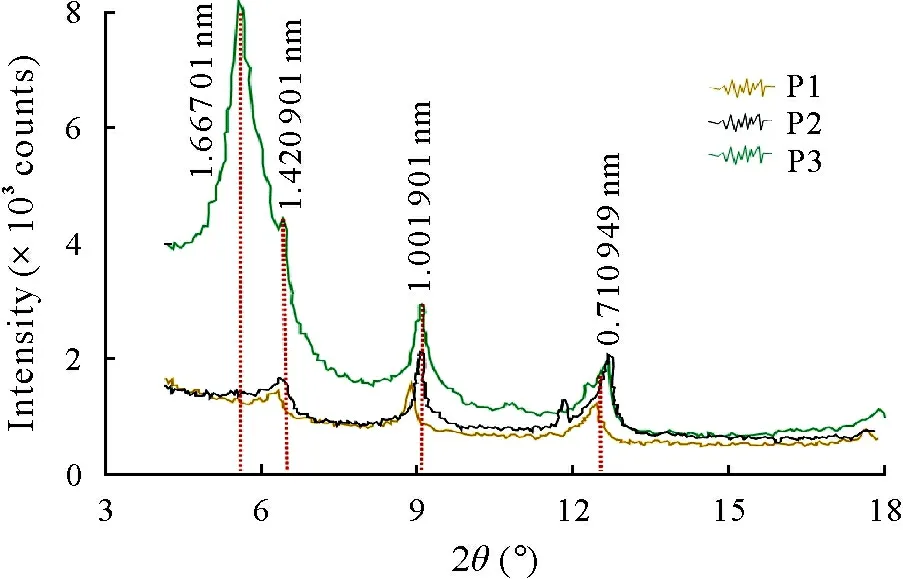
Fig.7 X-ray diffractograms showing clay mineralogy of A horizons in the three chronosequence soil profiles developed from different years on the former lakebed(P1,2007;P2,1994;and P3,1975).The minerals evaluated in the X-ray diffraction patterns were montmorillonite at a wavelength of 1.667 01 nm,chlorite at 1.420 901 nm,illite at 1.001 901 nm,and kaolinite at 0.710 949 nm.
Soil morphological,physical,and chemical properties of the biosequence soil profiles are presented in Table II.Within the topsoils(A horizons)of the three biosequence profiles,the soil structure was moderate medium subangular in P4(forest region),moderate medium subangular(10 cm)in P5(agricultural region),and very fine granular in P6(lakebed region). The structure was observed from soil surface to 46cm depth in P4, to 45 cm depth in P5, and to 58 cm depth in P6.All the subsoil horizons of the three profiles had massive structures.These massive structures were related to deposits that have not yet suffered extensive pedogenesis.The Munsell color was described as 10YR(moist)for all the horizons in P4,2.5Y(moist)for all the horizons in P5,and 2.5Y(moist)for A1 horizon and 5YR(moist)and 10YR(moist)for subsoil horizons in P6.
The topsoil properties were compared among the biosequence profiles(Fig.8).The OM and Na+increased in the order of P4(forest),P5(agriculture),and P6(lakebed),from the oldest (native vegetation) to the youngest ecosystem.The agricultural soils depending on fertilizer applications showed the highest values of EC, K+, and, but the lowest values of Cl-in the topsoil compared to the soils from the forest and lakebed(Fig.8).
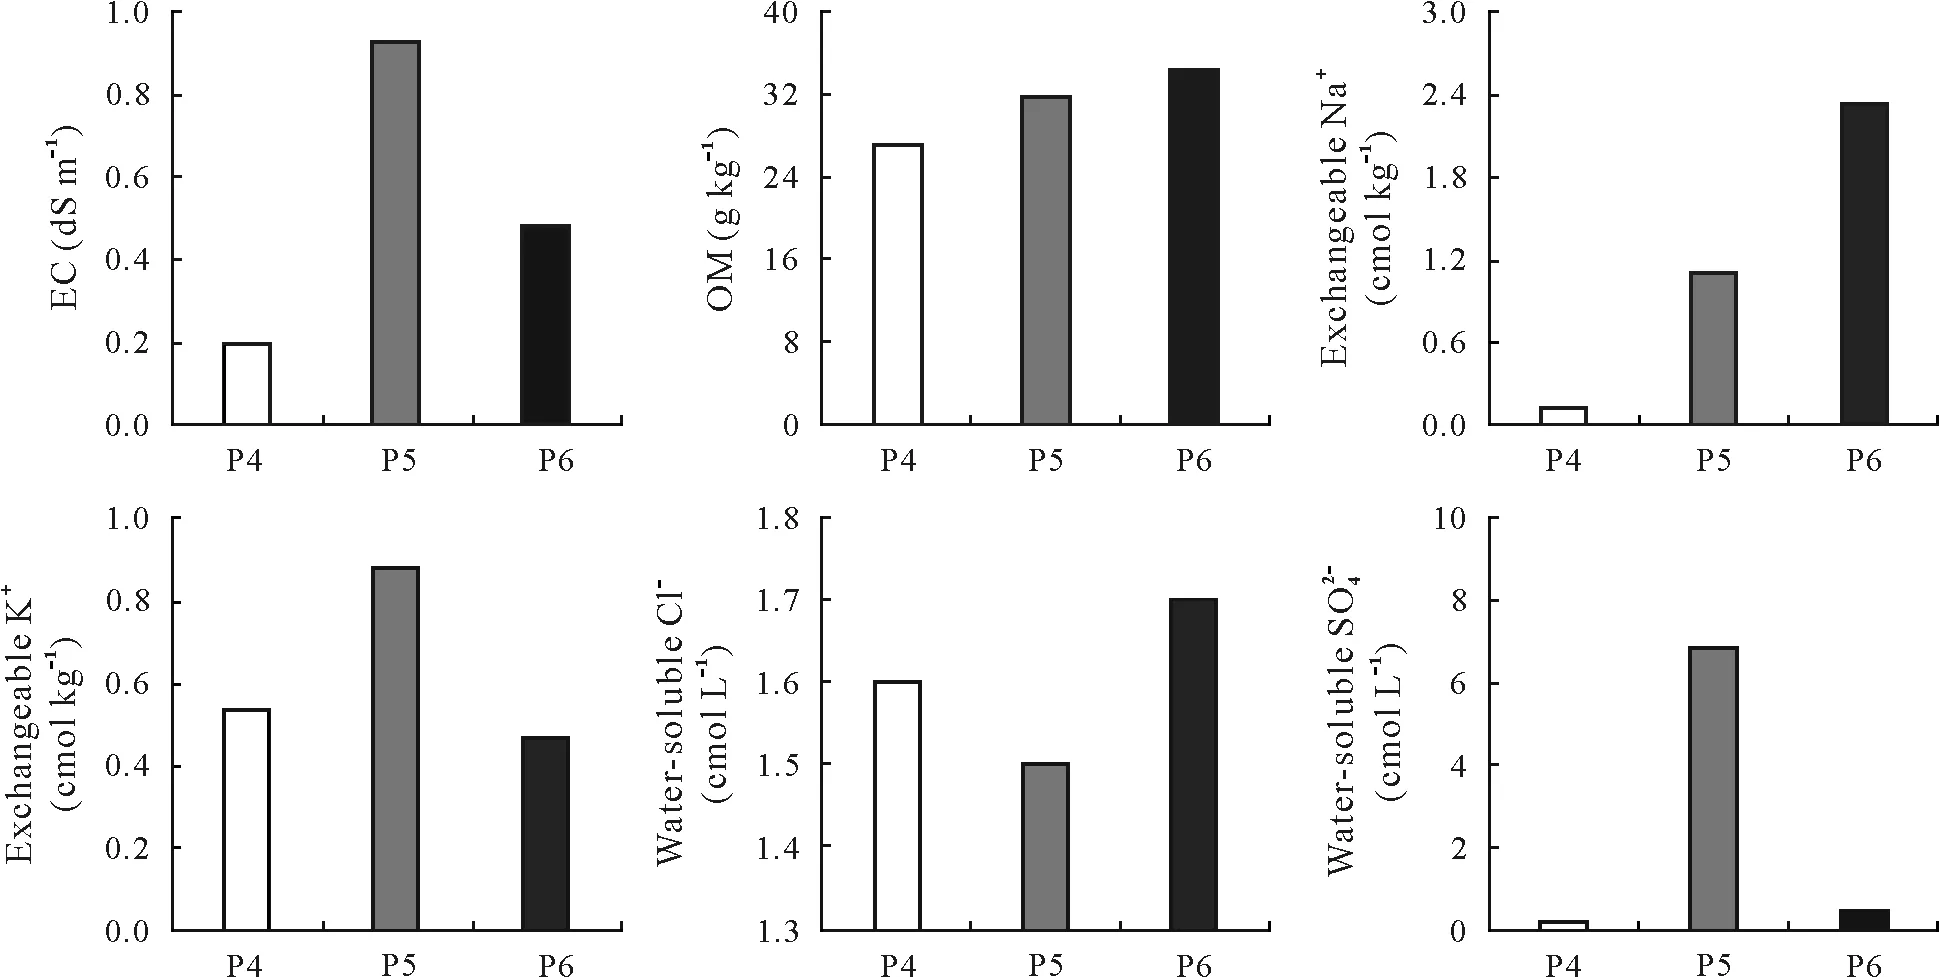
Fig.8 Changes in the selected soil properties of A horizons in the three biosequence soil profiles under different land use types(P4,native forest vegetation;P5,agriculture;and P6,lakebed).EC=electrical conductivity;OM=organic matter.
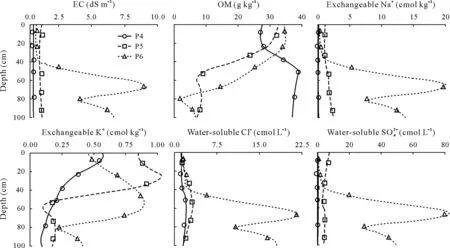
Fig.9 Changes in the selected soil properties with increasing depth in the three biosequence soil profiles under different land use types(P4,native forest vegetation;P5,agriculture;and P6,lakebed).Depth functions were fitted using equal-area quadratic spline functions with the interval of depth functions(λ)=1.EC=electrical conductivity;OM=organic matter.
Soil properties across all depths were compared among the biosequence profiles(Fig.9).Soil EC,Na+,Cl-,andshowed similar uniform distributions with depth in P4 and P5,whereas they were uniform from 0 to 40 cm and then increased with depth in P6.Soil EC,Na+,Cl-,andhad the highest variations in P6. The OM decreased with depth in P5 and P6(from 34.5 to 1.8 g kg-1),but increased with depth in P4(from 27.2 to 38.7 g kg-1).The K+content decreased with depth in all of the profiles.The exchangeable cations were generally present in the order of their abundance in all profiles, with Na+>K+in the topsoil and subsoil horizons.The Na+and K+ranged from 0.12 to 0.91 cmol kg-1and from 12.46to 22.85 cmol kg-1,respectively,in the upper horizon.
DISCUSSION
Climate and temporal changes in the Burdur Lake
The lake water level increased approximately 1 000 m(above sea level)to a maximum level in the Last Glacial Age(20 000 years ago),but then reduced to approximately 900 m(above sea level)at the end of the Holocene(11 700 years ago)(Yiğitbaşıoğluet al.,2003;Robertset al.,2004;Tudrynet al.,2013;Atalay,2017).The water flowing into the Burdur Lake basin has decreased in recent years(Girginet al.,2004;Ataol,2010;Şener and Morova,2011;Tudrynet al.,2013;Sarp and Ozcelik,2017;Gozukaraet al.,2019a,b).The recent decrease in the lake level is related to the excessive use of surface water and groundwater feeding the lake.For example,this decrease is considered to be the results of the increase in the number of ponds and small dams built in the lake basin,tectonic fissures,separation of water from the environment,erroneous agricultural production patterns,irrigation,and public water consumption (Ataol, 2010; Gozukaraet al.,2019a, b).The reductions in the level of the Burdur Lake have also been driven by increases in the annual average temperature and annual total evaporation and decreases in the annual total precipitation.Large variations in precipitation have been observed at the Burdur Meteorological Station;the area was relatively stable from 1950 to 1969,arid from 1969 to 1974,stable from 1974 to 1988,arid from 1988 to 1995,and rainy from 1995 to 2003(Gozukaraet al.,2019a).Despite increased precipitation since the early 1990s, the water level has continued to decrease regularly.In particular,severe water losses were detected from 1987 to 2002.The highest precipitation level in the last 56years in Burdur was detected in 2003 (594.2 mm), which temporarily stopped the lake level reductions,although the decrease continued afterward(Ataol,2010;Gozukaraet al.,2019a,b).According to Şeneret al.(2005),the decrease in the level of the Burdur Lake was caused by the dry seasons between 1988 and 1995,and in the following years,it was the result of constructed dams. Thus, it seems that anthropogenic factors have a stronger effect on the shrinkage of the Burdur Lake than natural phenomena.
Pedogenesis of chronosequence and biosequence soil profiles
Soil chronosequence and biosequence are genetic suites of soils that have evolved under similar conditions(Harden,1982).They translate spatial differences between soils into temporal differences,and this translation indicates how the soils and soil properties in a given region change over time(Bockheim, 1980; Vincentet al., 1994). Figures. 3 and 4 present the chronosequence and biosequence soil profiles affected by Burdur Lake recessions and the relative stage of their exposure to soil-forming factors and processes.These processes reflect a time frame in which the sediments have been subjected to soil formation factors that initiate soil development. The longer the time frame, the greater the chance for soil development and the formation of diagnostic horizons such as cambic, argillic, salic, and calcic. The evidence of the Burdur Lake recession from the soil studies is presented with the oldest to the youngest soil and the most recent stage(Figs.3 and 4).
In the study area,a young weakly to moderately developed soil was observed in the upper 10 cm of P2, upper 22 cm of P3, upper 46cm of P4, upper 45 cm of P5, and upper 58 cm of P6.However,structure development was not observed in P1.These data show a better-developed structure in the topsoil of the biosequence soil profiles than in the chronosequence soil profiles.Especially,time and vegetation,which are the soil formation factors, contributed to better structure development in the biosequence profiles. Other studies(Ozaytekinet al.,2012;Hamzehpouret al.,2018)have also provided evidence about structural development that correlates with the results obtained in this study.The color darkens with the effects of OM,time,and other soil formation factors(Vilmundardóttiret al.,2014).Soils growing on lacustrine material typically have a light-colored A horizon(Altunbas and Sari,2011;Altunbaset al.,2019).As we approached Burdur Lake,we observed decreases in the color parameters of hue,value,and chroma.This suggests that the color of the topsoil is slightly darkened due to the effect of organic matter over time. The effect of organic matter,time,and other soil formation factors changed soil color to 10 YR in the topsoil of P4 compared to the other chronosequence and biosequence soil profiles.Other studies have reported that the surface horizons become darker with increasing distance from the current lake coast(Moustakas,2012; Ozaytekinet al., 2012; Hamzehpouret al., 2018;Altunbaset al., 2019). The soil chronosequence profiles(especially in P1)showed irregular increases and decreases in the amount of organic matter and soil texture.These differences may be explained by abrupt lithologic transitions,and each layer may have been formed from the storage of topsoil and subsoil horizons by seasonal/continuous side streams and streams from the north and northeast of the Burdur Lake.
The calcic horizon, an indicator of soil development(Soil Survey Staff, 2014), was only detected in P4 of the biosequence profiles. The other soil chronosequence and biosequence profiles lacked diagnostic horizons.The calcic horizon in P4 included the 2 ACk horizon. The high clay content and low salinity in the soil indicate the deposition of low-salinity and calcareous fine-textured sediments during a high lake stand.The well-developed P4 had a diagnostic calcic horizon with low salinity(EC<0.27 dS m-1).The salinity of old sediments can be further reduced during the soil development process and calcic horizon formation.At the same time, gradual accumulations of organic matter were observed in P4.The accumulation of organic matter and calcic horizon formation,which are the important soilforming processes,were only observed in P4.In all of the horizons of P1,soil salinity was>16.36dS m-1(Fig.5).The water table was near the soil surface, which showed an underground connection of P1 to the Burdur Lake. In the chronosequence soils, all the horizons of P1 and the subsoil of P2 and P3 showed gleying properties and salt accumulation with EC between 3.19 and 18.11 dS m-1.This indicated a high water table and salinization resulting from the high ion concentrations of the Burdur Lake.Beyhanet al.(2007)reported that the EC value of the Burdur Lake was between 8.4 and 9.31 dS m-1and that the anion(Cl-and)and cation(Na+and K+)concentrations were also high.Beyhanet al.(2007)and Gülleet al.(2010)reported an increase in the EC and soluble anion concentrations of the Burdur Lake water every year.Some studies have shown that the EC(Moustakas,2012;Hamzehpouret al.,2018),Na+(Furquim,2017),and soluble anions(Beyhanet al.,2007)are correlated with the properties of old lake sediments in the topsoil and subsoil of chronosequence and biosequence.
The data of the structure,Munsell color,EC,exchangeable cation concentrations (K+and Na+), water-soluble anion concentrations(Cl-and),and clay mineralogy of the chronosequence and biosequence soils developed on old lake sediments showed both the genetic characteristics of the soils and their interaction with water of the Burdur Lake.
The clay minerals are formedviatwo main processes.In the first phase,clay minerals are produced through hydrothermal events as alternating material; in the second process,weathering forms the minerals(Dizdar,1979).Clay minerals in lacustrine sediments reflect the intensity of chemical and physical weathering in their source area.Weathering depends on the water chemistry of the lake,lithology,climate,local environmental conditions, and the geochemical evolution of environment, and forms the topsoil and sediments. In temperate and warm sub-arid climates,chemical weathering prevails,and smectite clay minerals are abundant(Chamley,1989). In the chronosequence soil profiles P1 and P2, the dominant types of clay minerals in the clay fractions of the subsoil (A horizons) were consistent (chlorite, illite, and kaolinite).However,montmorillonite was the dominant clay mineral in P3,which may be explained by higher intensities of chemical and physical weathering and erosion processes in the topsoil of P3.Tudrynet al.(2013)reported that the soils in the old the Burdur Lake coast were generally rich in illite,kaolinite,and chlorite.However,Tudrynet al.(2013)also reported that montmorillonite clay mineral was detected from the former lake bed of the Burdur Lake.These findings are consistent with our results.
CONCLUSIONS
Between 1975 and 2019, the area of the Burdur Lake decreased from 211.01 to 125.76km2,corresponding to an area loss of 40.40%.As a result,approximately 85.25 km2of lacustrine material was exposed to the air. The results of field studies, physical and chemical analyses, and clay mineralogical evidence(obtained from chronosequence soil profiles)indicate that the soils in the chronosequence and biosequence profiles are at different stages of soil evolution.Soil EC(18.1 to 0.4 dS m-1),Na+(34.7 to 1.4 cmol kg-1),K+(0.61 to 0.56cmol kg-1),Cl-(70.3 to 2.1 cmol L-1),and(275.9 to 25 cmol L-1)decreased with increasing distance from the Burdur Lake,whereas the A horizon thickness(10 to 48 cm),structure formation(0 to 48 cm),gleization-oxidation depth(0 to 79 cm),and montmorillonite and OM(25.9 to 46.0 g kg-1)contents increased with increasing distance from the Burdur Lake in chronosequence soil profiles. P3 (chronosequence) and P5 (biosequence)were better developed due to longer exposures to pedogenic processes(time,land use,vegetation,etc.).It can be concluded that the changes in EC,exchangeable cation(Na+and K+) and water-soluble anion (Cl-and) concentrations of the salt-enriched horizon,OM,gleization-oxidation depth,A horizon thickness,and structure formation in the chronosequence and biosequence soil profiles (especially the topsoil)were all highly related to the distance from the Burdur Lake,as well as time and land use.
ACKNOWLEDGEMENTS
This study was supported by the Scientific Research Projects (BAP) (No. 2017-2800) of Akdeniz University,Turkey. The first author was supported by the Scientific Research Projects(BAP)(No.2019-2757)of Eskisehir Osmangazi University,Turkey for postdoc researchers at the Department of Soil Science,University of Wisconsin-Madison,USA.
杂志排行
Pedosphere的其它文章
- Letter to the Editor Molecular characterization of an extensively drug-resistant Acinetobacter baumannii isolated from a corn culture soil
- Soil organic matter content and chemical composition under two rotation management systems in a Mediterranean climate
- Impacts of land use and salinization on soil inorganic and organic carbon in the middle-lower Yellow River Delta
- Rice(Oryza sativa L.)seedlings enriched with zinc or manganese:Their impacts on cadmium accumulation and expression of related genes
- Responses of the methanogenic pathway and fraction of CH4 oxidization in a flooded paddy soil to rice planting
- Effect of biochar applied with plant growth-promoting rhizobacteria(PGPR)on soil microbial community composition and nitrogen utilization in tomato
