Improving the Detection Rate of Rarely Appearing Intrusions in Network-Based Intrusion Detection Systems
2021-12-15EunmokYangGyanendraPrasadJoshiandChanghoSeo
Eunmok Yang,Gyanendra Prasad Joshi and Changho Seo
1Department of Financial Information Security, Kookmin University, Seoul, 02707,Korea
2Department of Computer Science and Engineering, Sejong University, Seoul, 05006,Korea
3Department of Convergence Science, Kongju National University, Gongju, 32588,Korea
Abstract: In network-based intrusion detection practices, there are more regular instances than intrusion instances.Because there is always a statistical imbalance in the instances,it is difficult to train the intrusion detection system effectively.In this work, we compare intrusion detection performance by increasing the rarely appearing instances rather than by eliminating the frequently appearing duplicate instances.Our technique mitigates the statistical imbalance in these instances.We also carried out an experiment on the training model by increasing the instances,thereby increasing the attack instances step by step up to 13 levels.The experiments included not only known attacks, but also unknown new intrusions.The results are compared with the existing studies from the literature, and show an improvement in accuracy, sensitivity, and specificity over previous studies.The detection rates for the remote-to-user (R2L) and user-to-root (U2L) categories are improved significantly by adding fewer instances.The detection of many intrusions is increased from a very low to a very high detection rate.The detection of newer attacks that had not been used in training improved from 9% to 12%.This study has practical applications in network administration to protect from known and unknown attacks.If network administrators are running out of instances for some attacks, they can increase the number of instances with rarely appearing instances,thereby improving the detection of both known and unknown new attacks.
Keywords:Intrusion detection; statistical imbalance; SMO; machine learning;network security
1 Introduction
Network security is becoming a matter of global interest and importance,as evidenced by the fact that network intruders are now regularly making the headlines.As more and more different devices are connected to the network,the network administrator needs a way to determine that the data passing through the network is not an intrusion.Intrusion detection systems(IDSs)can be classified into host-based and network-based detection systems.A host-based IDS basically monitors and analyzes intrusions within a machine.A network-based intrusion detection system(NBID)monitors and analyzes network traffic to protect a system from network-based threats.It reads all inbound packets and looks for suspicious patterns.Although NBIDs can detect known intrusions,detecting unknown new intrusions(UNI)is also very important.If the intrusion instance is known,the network administrator can easily protect network resources with an IDS.However,as the number and types of devices connected to the network increase,UNI may also increase.Detecting new intrusions(NIs) is a challenge.
IDSs have been studied extensively based on the KDDCup’99 and the NSL-KDD datasets, which are datasets collected from network traffic.Some researchers have pointed out the class imbalance issue in the KDDCup’99 dataset [1].NSL-KDD resolves the statistical imbalance by removing the duplicate instances of the dataset [2].There are several types of attacks:Denial of service (DoS), user to root(U2R), probe, and remote to user (R2L).In a DoS attack, the attacker makes the system too busy to handle legitimate requests.In a U2R attack, the attacker gains root access to the system with a normal user account.In the R2L attack, the attacker consistently sends packets/requests to a machine set up locally in order to acquire access as a local user.Finally, in a probe attack, the attacker tries to compromise the service either through probing or through discovering the network configuration.
There is always an imbalance between intrusion and normal instances in organizations that manage network traffic and detect intrusions.In the real world, most instances are normal.Furthermore, instances of intrusion methods that are technically simple and have been known for a long time are more frequent than instances of complex and unfamiliar NIs.
A machine learning model trained with a disproportionate ratio of data can have a negative effect on classification performance.This kind of issue is called a class imbalance issue [3].There are several methods to deal with this issue.One way to solve the class imbalance issue is to give more weight to the data with a smaller number of observations.Another way is to adjust the training data to create the model, using methods such as upsampling, downsampling, or synthetic minority over-sampling Technique (SMOTE).However, these techniques cannot solve the class imbalance issue completely.Upsampling extracts more samples from a small amount of data, which may cause overfitting problems.Downsampling extracts a large amount of data, which may cause information loss.SMOTE oversamples the minority class by taking each minority class sample and introducing synthetic examples along the line segments joining thekminority class’s nearest neighbors.Theknearest neighbors are randomly chosen based on the required oversampling.SMOTE can increase the overlapping class and can introduce additional noise[4].
Generally,UNI are a variant of known intrusions;this means that IDSs have to have a good detection capacity against known intrusions and should actively cope with new intrusion [5-8].In the real world,network administrators do not use a statistical algorithm to solve the class imbalance issue.In this work,we proposed a method by which the network administrator can increase intrusion detection by increasing the number of instances increasing the number of instances of very infrequent attack types without using statistical techniques.
In this work, to resolve class imbalance in the KDDCup’99 dataset without removing duplicate data,very small intrusion instances are increased by certain factors, but large intrusions such as normal,neptune, smurf, ipsweep, and portsweep are unchanged.Increasing various steps from by a factor of 5 to 10 leads to improvement in the detection rate of infrequent intrusions.
We compare the intrusion detection rate of known intrusions with UNI at each step.To the best of our knowledge, there exists no statistical analysis that addresses the class imbalance issue by increasing the number of very small instances without removing duplicate data from the dataset.There has also never been an attempt to detect UNI.Most studies in the literature have used the KDDCup’99 10% or corrected dataset for training, and also a mixed (10% and corrected) dataset [5,9-13].However, to represent intrusion instances accurately, we have used the full data for the training, and corrected data that includes unknown intrusions for testing.These unknown intrusions in the test dataset are not included in the training.Although the proposed method is time-consuming and requires computational resources, it is valuable because in real life it is very important to detect rare small instances.
If intrusions are detected by category,the most frequent instances will have a significant impact on the detection rate because of class imbalance.There is a significant advantage to doing intrusion detection by its type.This approach can provide a specific detection rate even if the proportion of instances is small.Most of the studies that use KDDCup’99 datasets for intrusion detection detect attacks by category.In contrast,our proposed method detects these by intrusion type.
We propose a method that does not require complex knowledge of attacks, so that network administrators can easily implement it in their system.This method mitigates imbalance issue without removing duplicate data.It can be used efficiently in a NBID.Network administrators can easily implement the proposed method in firewall hardware for rare known attacks, and also for UNI.The proposed method detects intrusions by intrusion type.
The rest of the paper is organized as follows.Section 2 describes related literature.Section 3 explains the composition of the experimental dataset.The experimental method is described in Section 4.Section 5 discusses the experimental results, and finally,Section 6 concludes the paper.
2 Related Work
IDSs are increasingly becoming essential with the massive growth of computer network usage and the huge increase in the number of applications running on these networks.Many studies on NBIDs have been done,both in academia and in industries,to mitigate the problem of intruders.Some of these efforts,reported in the literature, are summarized as follows.
Nadiammai et al.[14]did an experiment using 10-fold cross-validation.They selected 7,500 instances out of 311,029 corrected datasets (corrected.gz).The performance of the algorithm was measured using D-TNE, OneR, JRIP, Part, Ridor, ZeroR, Conjunctive Rule, Decision Table, NNge, MLP, SMO, and REFNW.The mean absolute error (MAE), root mean square error (RMSE), accuracy, sensitivity, and specificity were used for comparison to assess the detection performance.Singh and Bansal [9] published an article comparing the detection performance for each category of attack using RBF Network, Voted Perceptron, Logistic, and Multilayer Perceptron algorithms.They evaluated and compared accuracy,kappa statistic, mean absolute error, root mean squared error, relative absolute error, root relative squared error, and time taken.Their experiment was based on the Weka artificial neural network and used a set of NSL-KDD data.Garg et al.[10] evaluated the performance of each category of attack using randomly selected instances from the NSL-KDD dataset with 45 algorithms provided by Weka.The performance was evaluated according to accuracy, receiver operating characteristics (ROC) value, kappa, training time,mean absolute error,false-positive rate(FPR), and recall value.
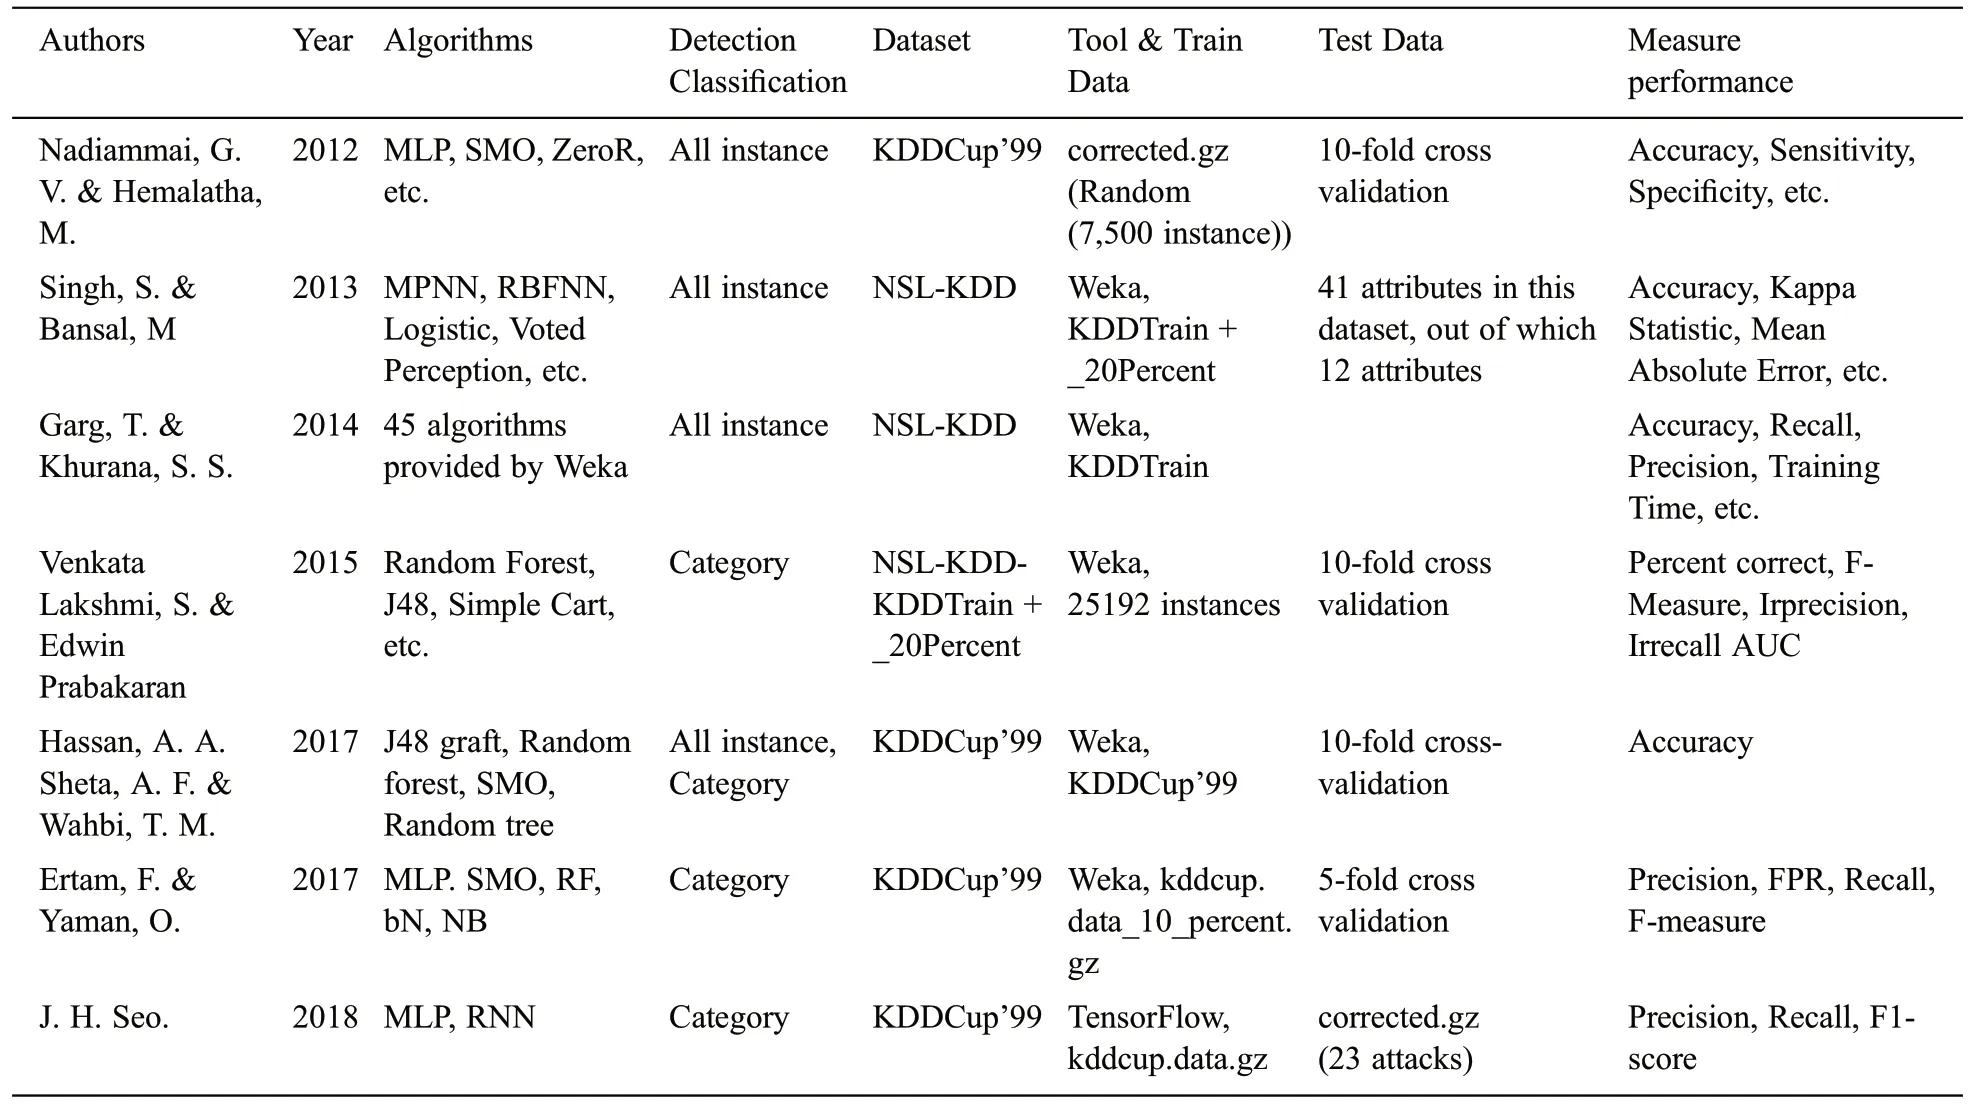
Table 1:Comparison of related work
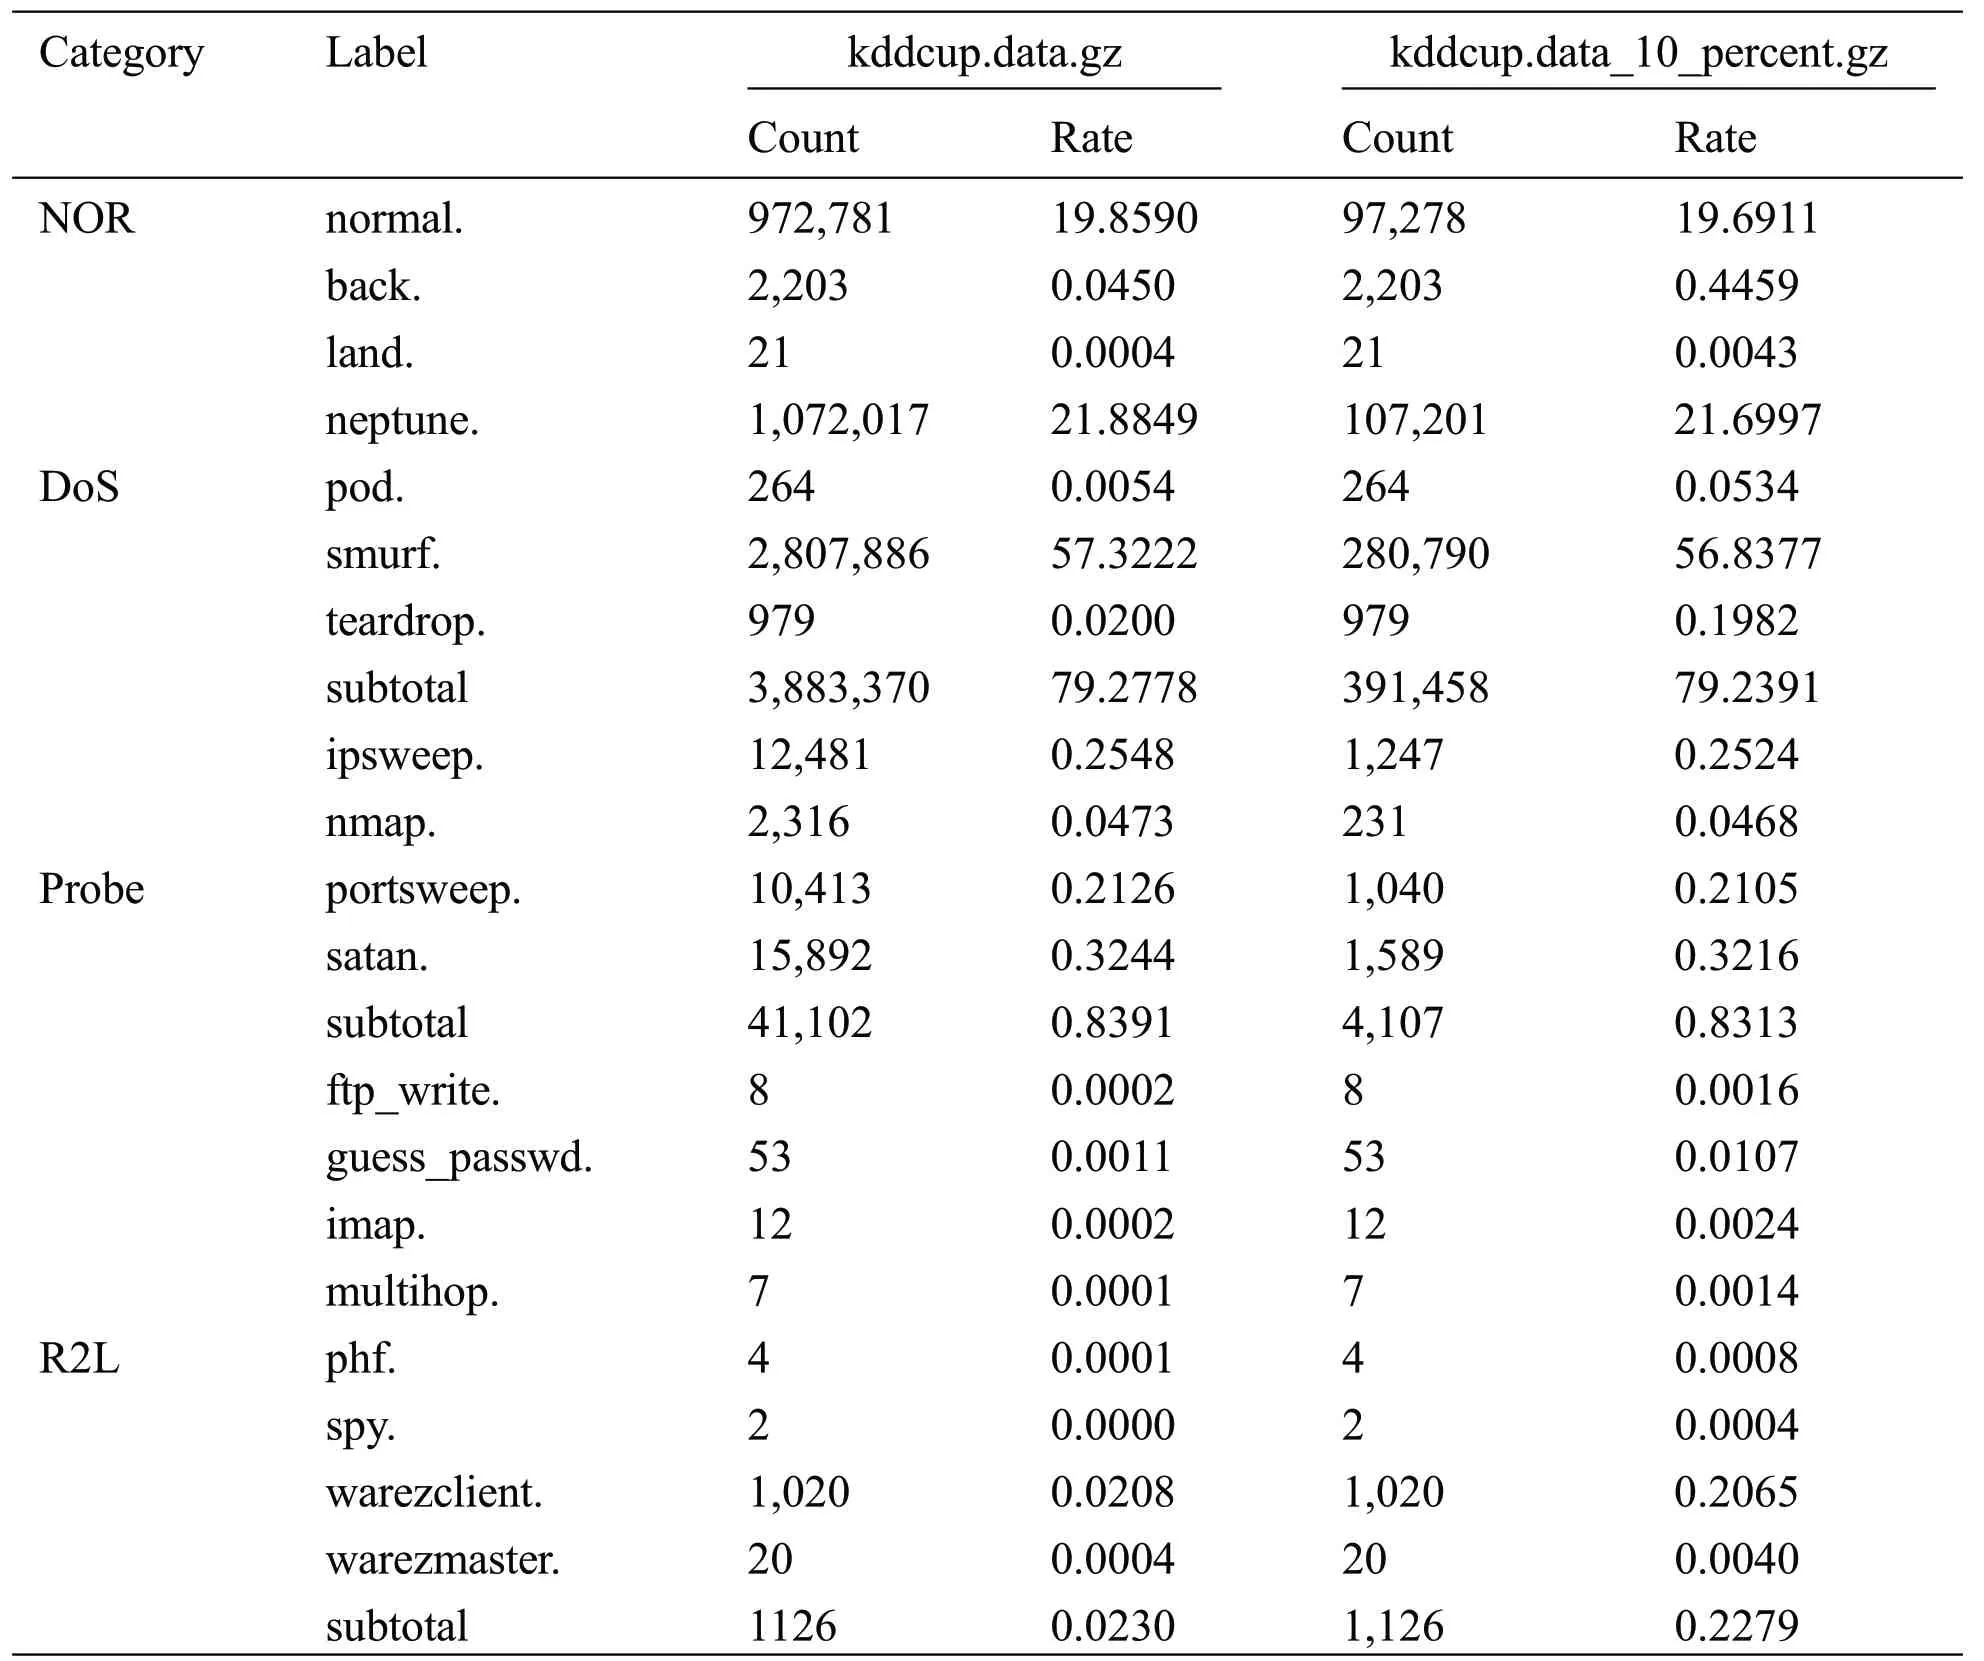
Table 2:kddcup.data.gz vs.kddcup.data 10 percent.gz of the record count

Table 2 (continued).
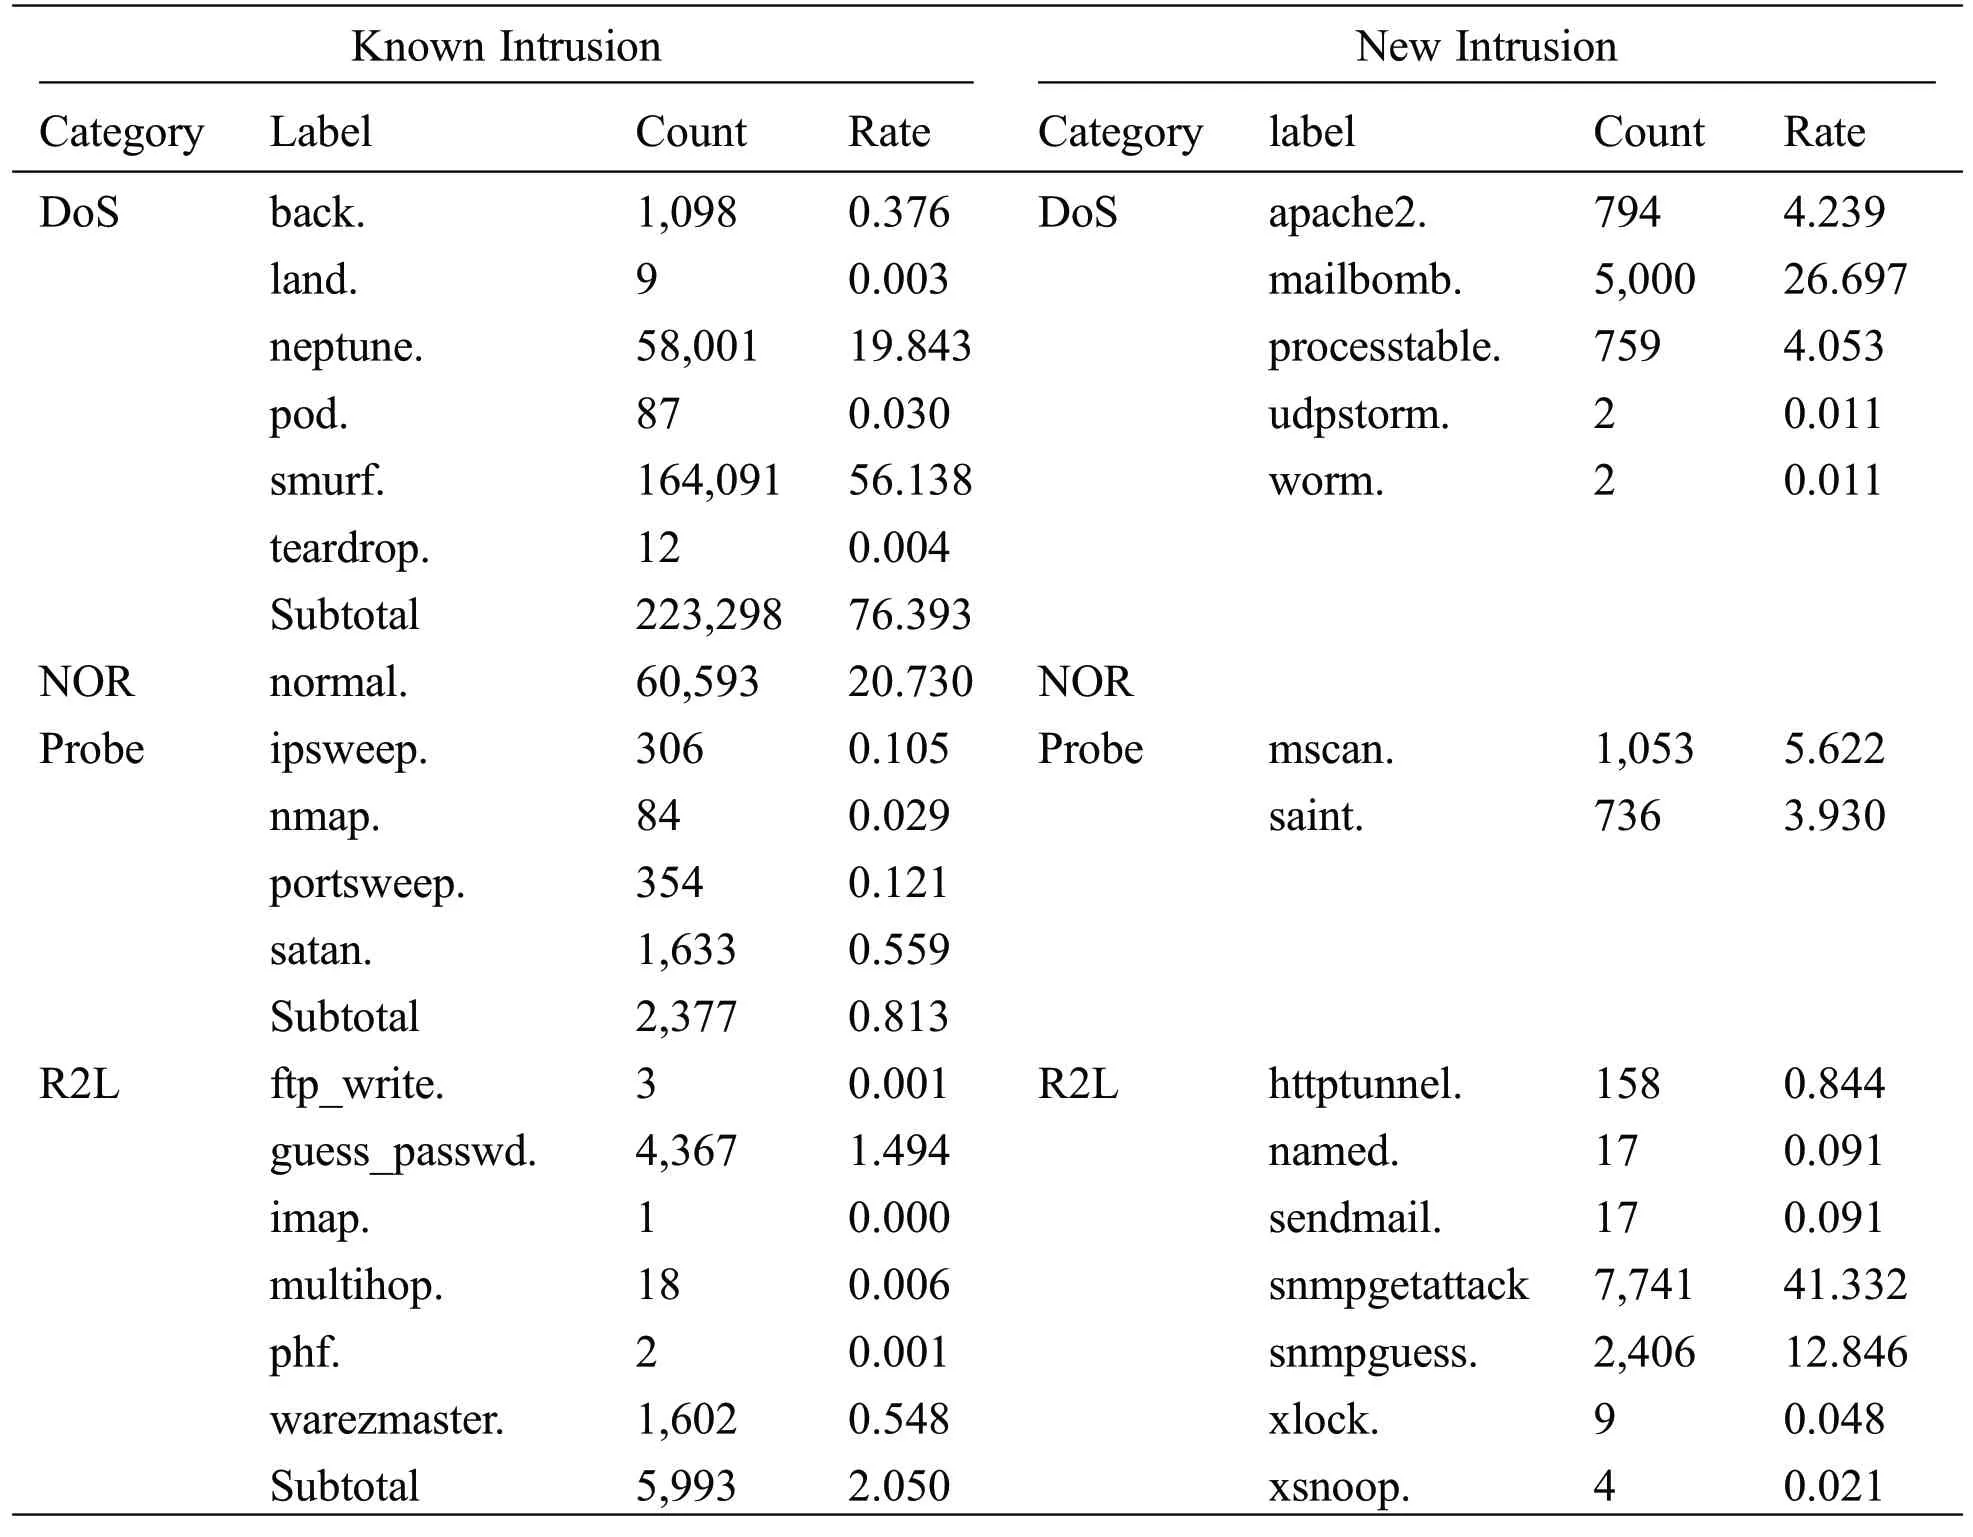
Table 3:Known intrusion and new intrusion of test data set(corrected.gz)

Table 3 (continued).
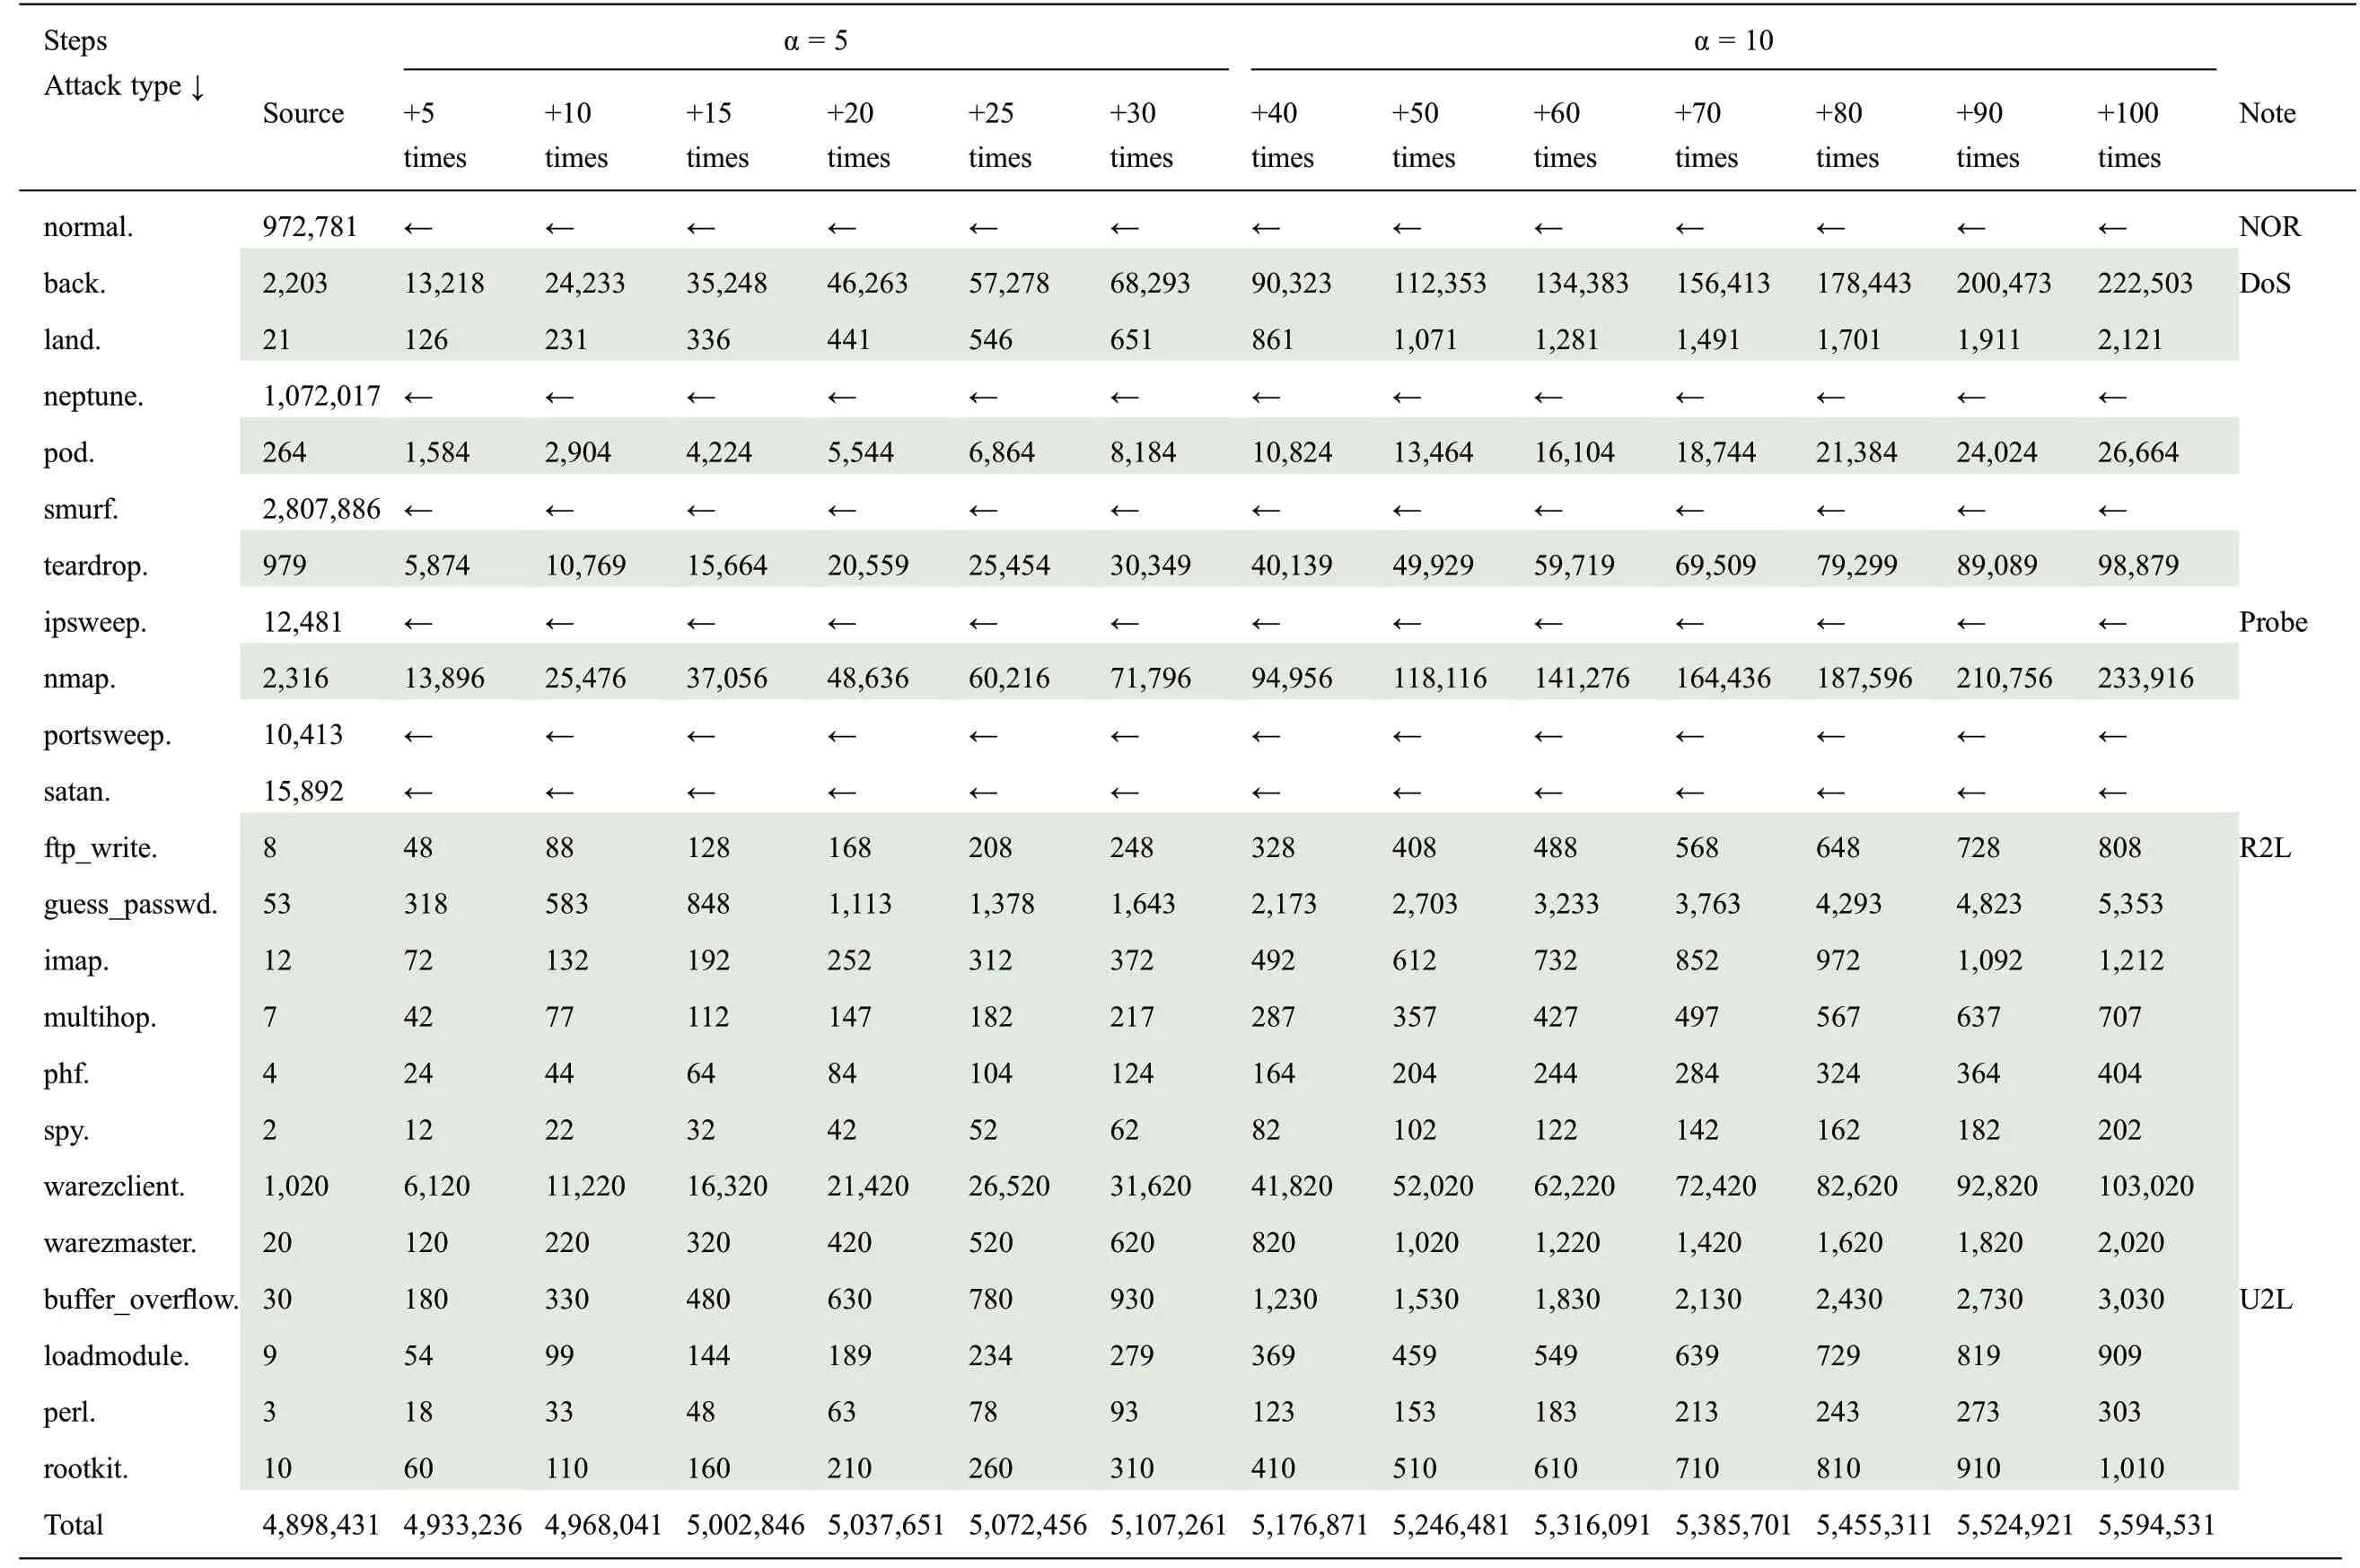
Table 4:Steps of training data statistics used to generate the model
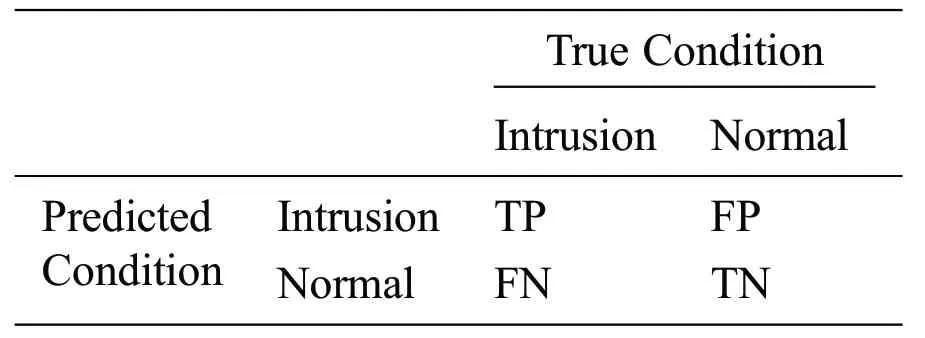
Table 5:Confusion matrix

Table 6:Cross-validation comparison between previous research and the proposed method
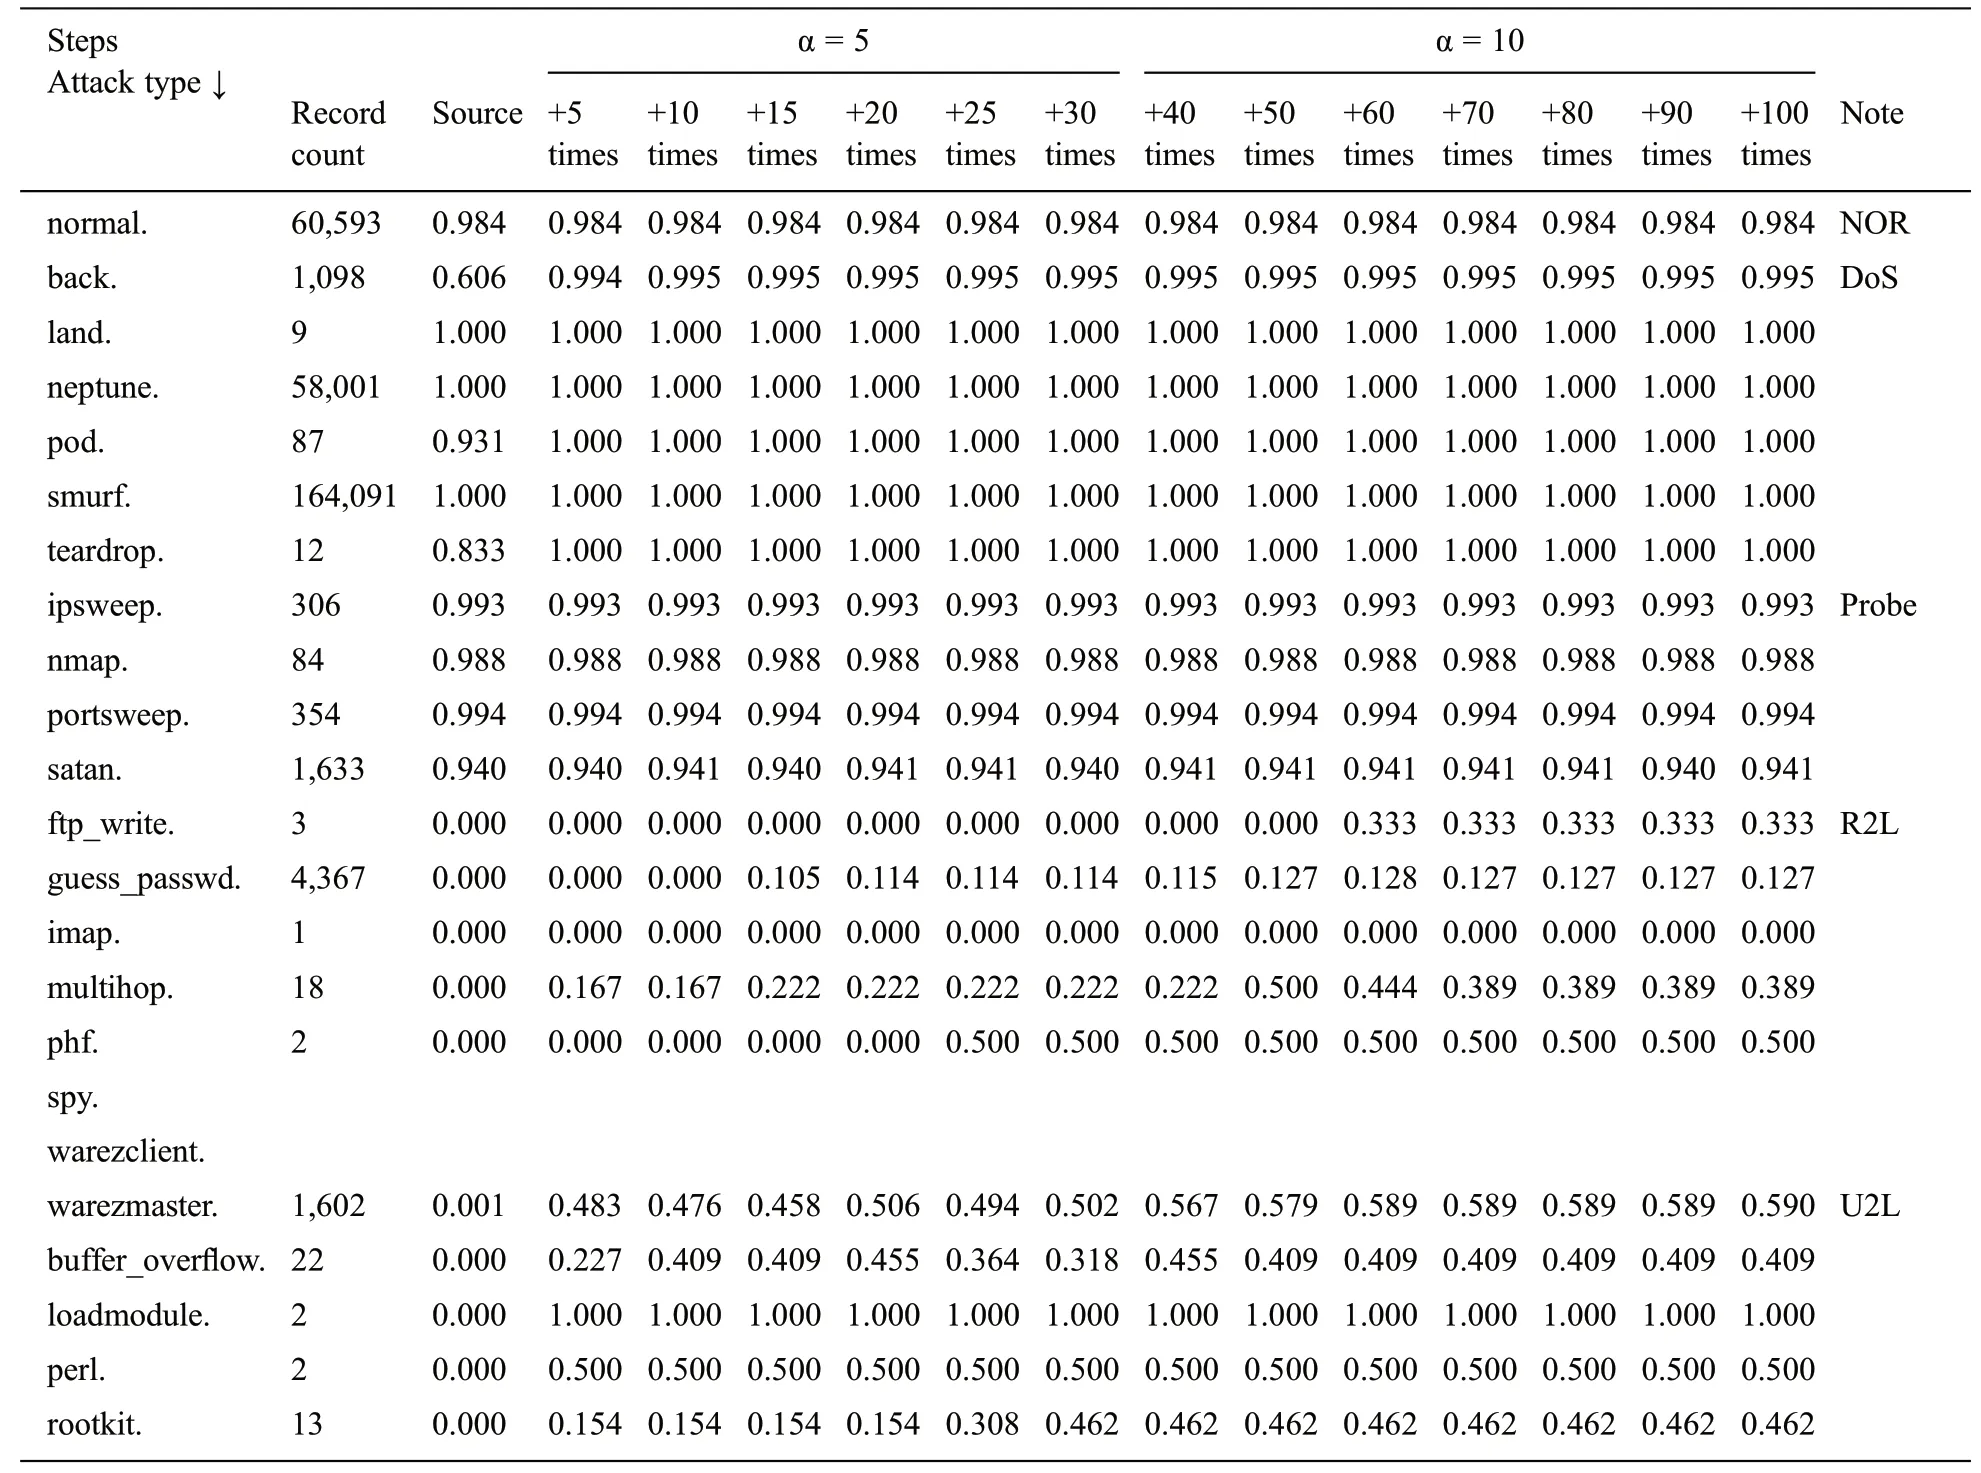
Table 7:Test results with known intrusions in corrected.gz(292,300 instances)

Table 8:New intrusion detection

Table 9:Comparison of SMOTE with the proposed method
Ramakrishnan et al.[11]used corrected.gz as the training data and KDDCup.data 10 percent.gz as the test data.They used the fuzzy algorithm and jFuzzyLogic.This work is based on differentiation on labels rather than categories.Venkata Lakshmi et al.[12] used 10 classification algorithms, including SMO of Weka, on the KDDTrain 20% dataset.Their comparison indexes were percent correct, F-measure, irrecall,irprecision, and area under ROC (AUC) for each category of attacks.Hassan et al.[15] used intrusion detection for each category of the KDDCup’99 dataset.The algorithm compares the correct classification using SMO, J48, random tree, rep tree, random forest, simple chart, J48 graft, naive Bayes, and RBF network.Ertam et al.[16] used 10% of the data from the KDDCup’99 dataset while using Weka.They compared the results by category of intrusions using naive Bayes (NB), Bayes NET (bN), random forest(RF), multilayer perception(MLP), and sequential minimal optimization (SMO).Performance comparison indexes are false rate, precision, recall, F-measure metrics, and accuracy.Seo [17] used TensorFlow’s MLP and RNN for intrusion detection.The training used kddcup.data.gz from the KDDCup’99 dataset,and the test detected 23 attacks from corrected.gz.The detection results were compared with the previous studies in terms of precision, recall, and F1-score.In addition, the SMOTE algorithm [18-20] was used to solve the data imbalance problem.
Tab.1 compares various related works reported in the literature.In Tab.1, training datasets and test datasets are used in various ways.Many researchers used 10% or 20% of the corrected datasets.These training and test datasets are arbitrarily extracted and used.Nevertheless, there have also been studies that used attack labels for detection.Most of the papers have used its category to detect intrusions.The machine learning algorithms used for intrusion detection were also diverse.The program tools can be categorized into customized tools, TensorFlow-based tools, and Weka-based tools [15,21].However, there is little research on the detection rate of NIs after training with known attacks [22].
Because of the class imbalance in the KDDCup’99 dataset,most of the existing machine-learning-based intrusion detection research reports in the literature use various methods to create sub-datasets,and then train for intrusion detection.To the best of our knowledge, there are not many studies on the detection of rare UNIs.In addition, there are few studies on detecting intrusions that had not been used for training.
3 Description of the Dataset
The KDDCup’99 dataset is the most widely used dataset for the evaluation of anomaly detection[15].This dataset has been developed based on the DARPA 98 dataset at the MIT Lincoln Laboratory [1],produced by the DARPA (1998) Intrusion Detection Evaluation Program.It included nine weeks of raw TCP dump data for a local area network (LAN) simulating a typical US Air Force LAN.The LAN was operated as if it were a true Air Force environment, but peppered with multiple attacks.Protocols such as TCP, UDP, and ICMP had been used on this dataset to evaluate the intrusion detection methods.The full KDDCup’99 dataset (uncompressed file kddcup.data.gz) has 4,898,431 records, and each record contains 41 features.Since the KDDCup’99 dataset contains so much data, many authors used a reduced version of the KDDCup’99 dataset (uncompressed file kddcup.data 10 percent.gz) to reduce the computation time.The kddcup.data 10 percent.gz is about 10% of the KDDCup’99 dataset, and contains 494,021 records, of which 97,278 are normal (19.6%) and 396,743 are intrusions (80.4%).In the reduced version, the normal, neptune, smurf, ipsweep, nmap, portsweep, and satan instances are reduced.However, because even rare intrusion instances may severely compromise security, we used the full dataset for our experiments.
Instead of ignoring small number of instances, we increased their numbers to decrease the class imbalance.The details of kddcup.data.gz and kddcup.data 10 percent.gz are compared in Tab.2.
Tab.3 shows the known intrusions and UNI in the corrected version of the KDDCup’99 dataset(corrected.gz).We used the corrected.gz dataset for testing.There were 292,300 known intrusions and 18,729 unknown intrusions used for testing.
4 Experimental Method
In a typical IDS environment,a lot of duplicated traffic may occur.Therefore,we trained using the full data,kddcup.data.gz,which contains many duplicate instances,as shown in Tab.2.Most of the dataset(99.8579%)consists of attacks(79.9999%:Neptune,smurf,ipsweep,portsweep,satan)and normal records(19.850%).
It is difficult to mitigate class imbalance during normal training,because land,ftp write,guess passwd,imap,multihop,phf,spy,warezmaster,buffer overflow,loadmodule,perl,and rootkit attacks are very small(less than 10,000 instances).For example, the number of instances of spy is 1,403,943 times smaller than smurf, and 536,008 times smaller than neptune.The threshold value of 10,000 instances is a design parameter for the intrusion detection experiments.In general, the problem of class imbalance in machine learning is that the cost of predicting a smaller class is higher than the cost of predicting a larger class.Therefore,the very small number of such instances in training may lead to non-training issues[17].
The experiment was carried out in four steps.In the first step,while making a training dataset,the attack instances smaller than 10,000 were increased by five(i.e.,α=5)six times,i.e.,until“+30 times”in Tab.4,and by 10(i.e.,α=10)seven times,i.e.,until“+100 times”.The multiplied values were added to the source values.As shown in Tab.4,each step was increased by α times the previous number,as in Eq.(1).The coefficient α is the design parameter.We observed the intrusion detection rate by increasing the coefficient value by a unit of five for the first six steps,and then by a unit of 10 for the other seven steps.Because there were minor changes in detection rates when the coefficient value reached 30,the value of α was increased to 10 for the last seven steps.There were almost no changes in the detection rate after the coefficient value becomes 100.

where α=5,10,15,20,25,30,40,50,60,70,80,90,100.Fig.1 shows the block diagram of the data preprocessing, and the classification model of the proposed IDS.
In the second step,the modified dataset was trained by the SMO algorithm of the Waikato Environment for Knowledge Analysis (Weka) to generate the model.SMO is one of the most popular optimization algorithms for solving the support-vector machine (SVM) quadratic programming (QP) problem.Training an SVM requires the solution of a very large QP optimization problem.SMO breaks this huge QP problem into a series of the smallest conceivable QP problems.To avoid complex numerical QP optimizations, these small QP problems are solved analytically.Compared to other similar optimization algorithms, SMO can handle very large training sets with the same amount of memory.Weka includes many algorithms, and SMO is one of them.The training and testing data were evaluated using the SMO classifier in Weka API.
16. The birds had come and had eaten it up, every bit: In some fairy tales birds function as helpers, are aligned76 with divine powers (Freiberg, p 23), or grant special powers to those who understand their language (Bettelheim, p. 31). Here, to the misfortune of Little Thumb and his brothers, they function solely82 as the embodiment of indifferent, external nature.Return to place in story.
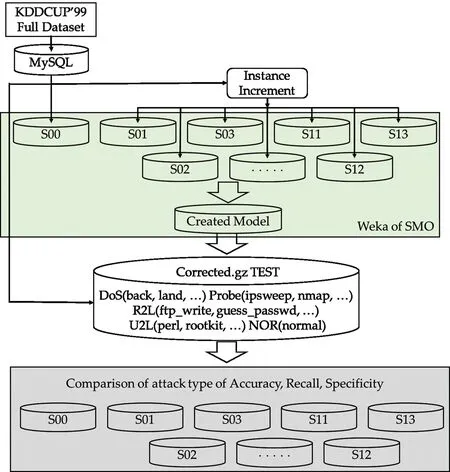
Figure 1:An overall model of the proposed intrusion detection system
In the third step,a test was performed using the test dataset with corrected labels(corrected.gz dataset).In the fourth and final step,the unknown new attack types were changed to normal instances to detect unused attack types.After being changed to normal instances, the NIs that had not been used for training were detected.Tab.4 shows the 13 levels of training data statistics used to generate the model.
Fig.2 shows the ratio of the number of instances used in the experiment by eliminating the class imbalance of the training data.The left side of the figure shows the total percentage of instances with more than 10,000 instances, i.e., normal, neptune, smurf, ipsweep, portsweep, and satan.The right side of the figure shows the percentage of the total small instances.The numbers on the right side of the figure are total attacks.
The experiments are conducted on Weka 3.8 SMO, Windows 10 Enterprise edition, Intel i9-7940K 3.10 GHz,and 64 GB RAM.
5 Experimental Results
Tab.5 shows the indicators for measuring the performance of the model.True positive(TP)represents the condition when an instance is an intrusion and is classified as an intrusion.False negative (FN) is the condition when the instance is an intrusion but is classified as normal.False positive (FP) is when the instance is normal but classified as an intrusion.True negative (TN) is when the instance is normal and is classified as normal.Tab.5 shows the indicators for measuring the performance of the model.
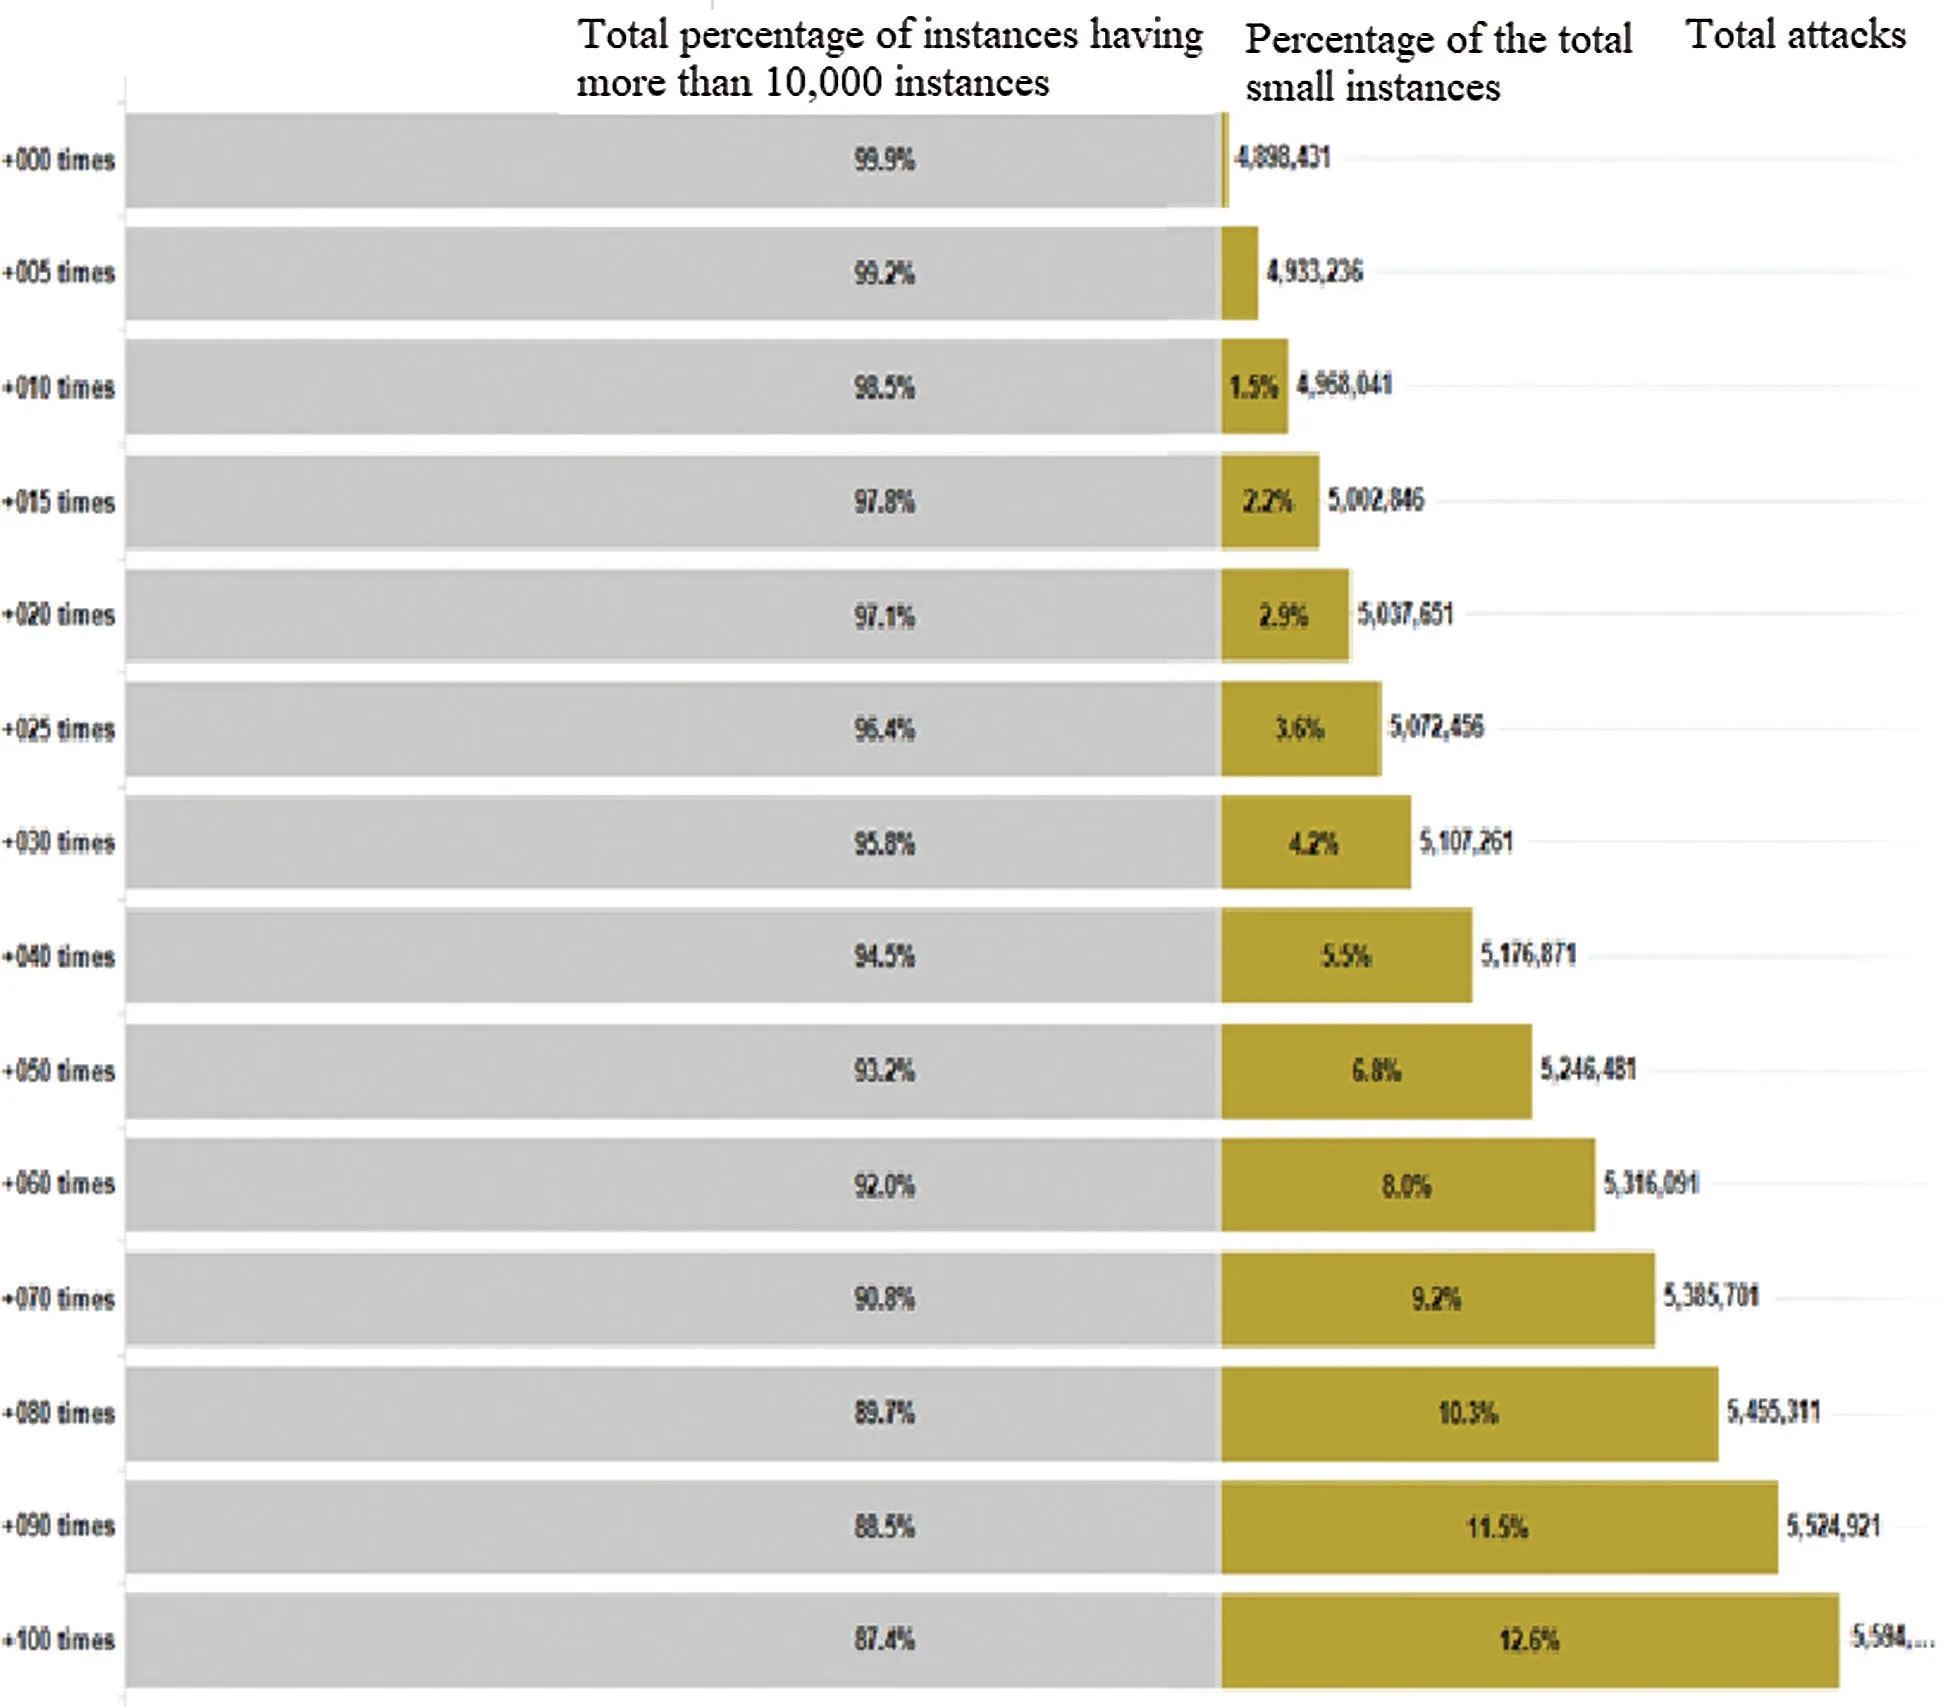
Figure 2:The percentage of the training data structure used in the model generation
The following evaluation matrices are used to compare the performance of the proposed method with existing methods.Recall or sensitivity or true positive rate (TPR) is the percentage of the intrusions that are detected as intrusions.The recall is calculated as follows.

Specificity is the percentage of the normal instances that are detected as normal.Specificity is calculated as follows.

Accuracy is the percentage of the intrusions that are detected as normal instances.This is calculated as follows.

Our method does not easily lend itself to direct comparison with existing methods.This is because the training dataset and test datasets are different,as shown in Tab.1.Thus,existing methods are compared with a similar training and test dataset and training methods using the 10/5-fold cross-validation method.
Tab.6 compares the proposed method with previous studies.Among the three methods in the table,Hassan A.used the KDDCup’99 data; Nadiammai G.V.used 7,500 randomly extracted instances from the corrected.gz data; and Ertam F.trained using kddcup.data 10 percent.gz.The SMO algorithm using Weka’s application programming interface (API) was used for the evaluation.The performance matrices’accuracy,recall,and specificity were evaluated based on the 10/5-fold cross-validation test.
The results consist of 4,898,431 data entries extracted from kddcup.data.gz and analyzed with Weka’s SMO algorithm for 10-fold cross-validation.Using the full version of KDDCup’99 (kddcup.data.gz)produces higher accuracy,recall, and specificity.
Tab.7 shows the model-specific test results.The test dataset is the result of the detection of known attacks used for training the corrected dataset (corrected.gz).
Figs.3 to 6 show the test result comparisons of intrusion detection rates in steps S00 to S13.Fig.3 shows the detection results for normal instances.The detection rate for source instances that do not increase is 98.44%.From +60 times, i.e.,from the 9th level,the rate is 98.38%.

Figure 3:Test results of normal instance detection rate
Fig.4 shows the detection rate with increasing instances from the DoS category.Smurf(100%)and land(99.8%)attacks had a high detection rate for source instances.The back attack was improved from 60.56%in source to 99.54%in+10 times.The detection rate of pod and teardrop instances in+5 times,i.e.,the second level,was 100%.
Fig.5 shows the probing category detection rates by attack type.Probe attacks had a high detection rate in the source.We increased the instances of nmap attacks among four probe attack types.However,the result shows that there was no change in the detection rate of probe attacks with high detection rates.
Fig.6 shows the detection rates by attack type in the R2L category.The source of the R2L category had a very low detection rate.The guess_passwd attack was 0%until+5 times(first level).After+50 times(eighth level), it was about 12.6%.
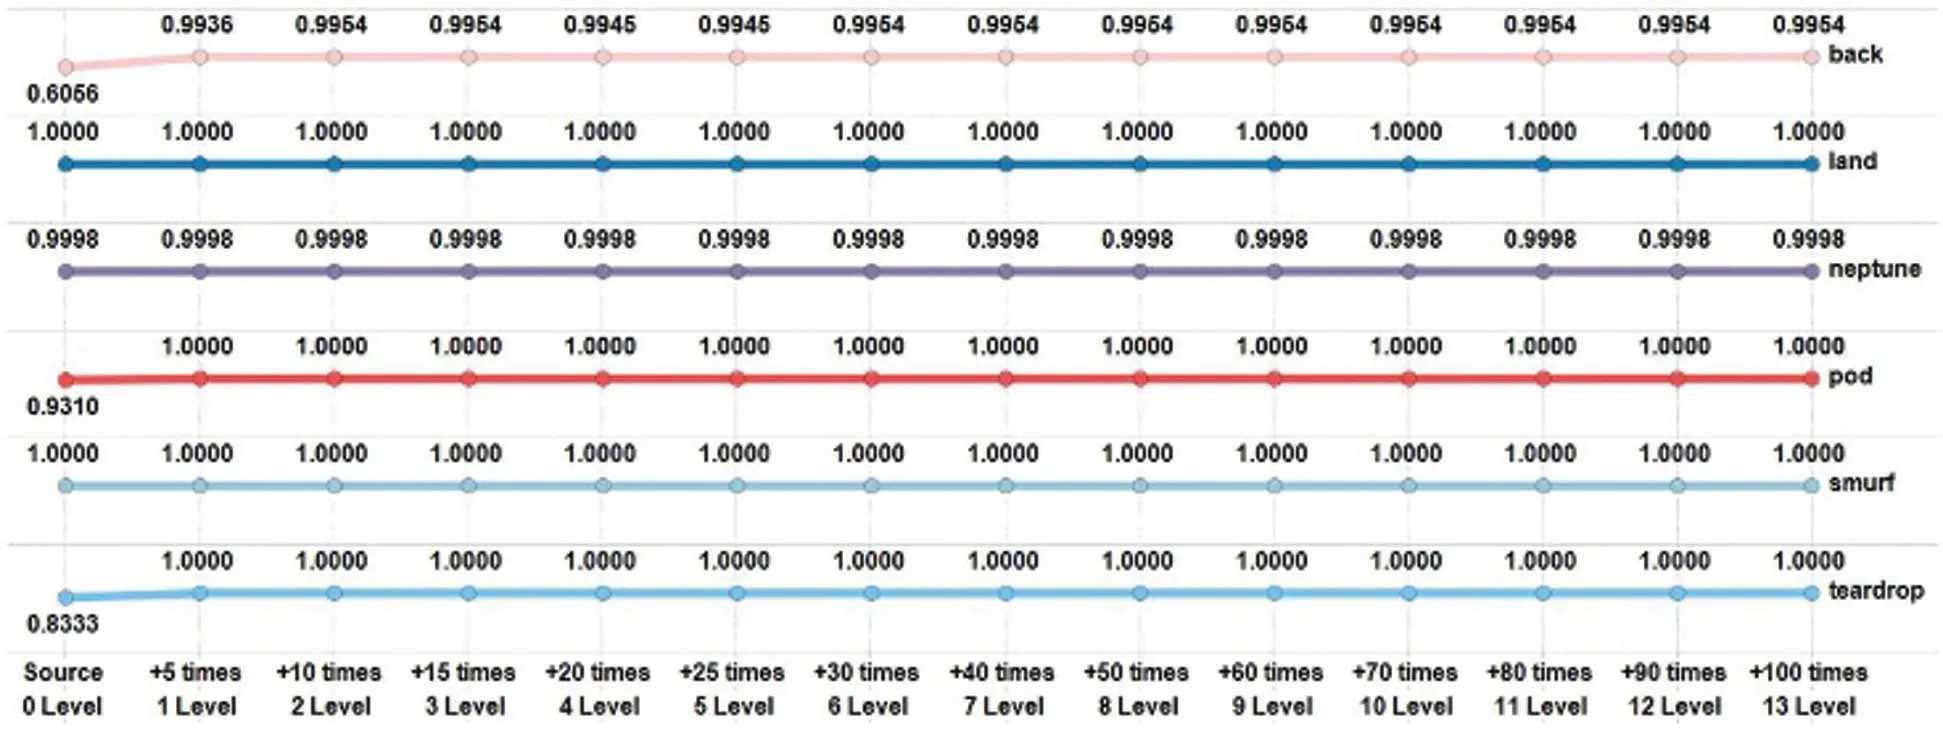
Figure 4:Detection rate results of various instance types in a DoS attack

Figure 5:Detection rate test results of various attack types in the probe category
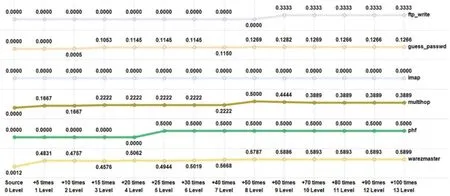
Figure 6:Test results of various attack types in R2L
In an imap attack,the source and the increased number of instances had the same detection rate,i.e.,0%.This may be because there was only one test instance,as in Tab.3.The multihop attack had a detection rate of 0%for source,and a detection rate of 16.67%for+5 times and+10 times.The detection rate after+15 times to+40 times was 22.22%,and the detection rate for+50 times was 50%.However,the detection rate after+70 times fell to 38.89%.
In a phf attack,the detection rate was 0%until+20 times,and 50%after+25 times.The source detection rate of the warezmaster attack was 0%,the detection rate of+5 times was 48.31%,and from+70 times,the detection rate was 58.93%.
Fig.7 shows the U2L category detection rate by attack type.The source detection rate of the U2L category was 0%, and the detection rate remained very low in general, as in the R2L category.The detection rate of the buffer overflow attack was 22.73% for +5 times, 40.10% for +10 times, 45.45% for+40 times,and 40.91%after +50 times.

Figure 7:Test results of various attack types in U2L
The loadmodule attack had a detection rate of 100%after+5 times.The perl attack had a detection rate of 50%after+5 times.Finally,the rootkit attack had a detection rate of 15.38%at+5 times and 46.15%at+30 times.
Tab.8 shows the number and ratio of instances of detection of UNIs.The new intrusion types(apache2.,httptunnel., mailbomb., mscan., named., processtable., ps., saint., sendmail., snmpgetattack., snmpguess.,sqlattack., udpstorm., worm., xlock., xsnoop., xterm.) were changed to normal, and then the system was tested.The number of instances that were changed to normal was 18,729.In the source, 1,827 of 18,729 instances were detected as NIs, and the detection rate of NIs was 9.755%.The new intrusion detection rate rose to 9.878% after +5 times.After +15 times, the detection rate rose to 11.453%.After+20 times, the detection rate was 12.11%.After +50 times, the detection rate was 12.174% (2,272/18,729), which was the highest rate achieved for NIs.Without the use of special algorithms such as SMOTE, network administrators can easily add statistically unbalanced data to improve the detection of unknown intrusions by 2.419%.
Tab.9 compares 10% of the KDDCup’99 dataset processing using SMOTE, and the full dataset processing using simple increment-based SMO.The results are compared by attack category in terms of the RNN, SVM,and SMO algorithms.
6 Conclusions
Intrusion detection research using machine learning extracts arbitrary instances from a dataset or uses SMOTE algorithms to increase instances to train and test models.In this paper, we proposed and tested a method by which the network administrator can increase intrusion detection by increasing the number of instances of very rare attack types without using statistical techniques.We compared the detection rates by increasing the instances in 13 levels, increased by 5 each time.The results show that this method increased the system’s ability to detect intrusions.It also increased the detection rate of NIs that had not been used in training.
Our experiments show that the detection rate of attacks in the DoS category is generally high,while the back attack has a relatively low detection rate.When the number of back attack instances was increased by+10 times,the detection rate increased from 60.56%to 99.54%.The detection rate of the teardrop attack was 83.33%,and it rose to 100%with a+5 times increase of instances.In the R2L category,the source detection rate was almost 0%, but it was greatly improved by increasing the number of instances.In particular, the multihop attack was improved from 0% to 50% when the instance is increased by +50 times.The detection rate of the source of the U2L attack category was 0%, but the detection rate of the buffer overflow attack was improved to 45.45% by increasing the instances.The detection rate of the perl attack was 50%, and the detection rate of the rootkit attack was 45.15%.Notably, the detection rate of the loadmodule attack was improved by 100%.The detection rates of R2L and U2L attacks were significantly improved when the training was performed by increasing the number of instances of the rare attacks.
In the future, we hope to compare the existing methods with the proposed method in terms of computation complexity and overheads, so as to identify the potential tradeoffs.We will use the same detection technique on preprocessed datasets to evaluate the performance.We will also use the crossvalidation method to test the classifier and compare our method with other recently proposed approaches.
Funding Statement:This work was supported by the Institute for Information and Communications Technology Planning and Evaluation (IITP) funded by the Korea Government (MSIT) under Grant 20190007960022002 (2020000000110).
Conflicts of Interest:The authors declare that they have no conflicts of interest to report regarding the present study.
杂志排行
Computers Materials&Continua的其它文章
- Understanding the Language of ISIS:An Empirical Approach to Detect Radical Content on Twitter Using Machine Learning
- A Self-Learning Data-Driven Development of Failure Criteria of Unknown Anisotropic Ductile Materials with Deep Learning Neural Network
- An Effective Numerical Method for the Solution of a Stochastic Coronavirus(2019-nCovid) Pandemic Model
- A Novel Approach to Data Encryption Based on Matrix Computations
- Fuzzy Based Decision Making Approach for Evaluating the Severity of COVID-19 Pandemic in Cities of Kingdom of Saudi Arabia
- Industry 4.0:Architecture and Equipment Revolution
