Electronic Supplementary Material to:Toward Understanding the Extreme Floods over Yangtze River Valley in June-July 2020: Role of Tropical Oceans*
2021-12-13ShaoleiTANGJingJiaLUOJiayingHEJiyeWUYuZHOUandWushanYING
Shaolei TANG, Jing-Jia LUO, Jiaying HE, Jiye WU, Yu ZHOU, and Wushan YING
Institute for Climate and Application Research (ICAR)/Key Laboratory of Meteorological Disaster of Ministry of Education/Joint International Research Laboratory of Climate and Environment Change/Collaborative Innovation Center on Forecast and Evaluation of Meteorological Disasters, Nanjing University of Information Science and Technology,Nanjing 210044, China

Fig.S1.Spatial distribution of Pacific SST anomalies (°C) averaged in the boreal winter season (December-February, DJF) of (a) 1982, (b) 1997, (c) 2015, and (d) 2019.

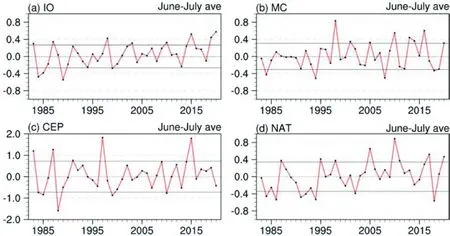
Fig.S2.Time series of June-July averaged SST anomalies (°C) averaged for the (a) Indian Ocean (IO), (b) Maritime Continent (MC), (c) central and eastern equatorial Pacific (CEP), and (d) North Atlantic Ocean (NAT).The horizontal black line in each subplot denotes one standard deviation of each SST anomaly time series.

Fig.S3.Impacts of the warm SST anomalies in the North Atlantic Ocean (NAT) on the 850 hPa geopotential height(shading, gpm) and horizontal wind (vector, m s-1) during June-July 2020 based on the sensitivity model experiment(i.e., EXP_NATOBS minus EXP_NATCLM).Stippling indicates that the geopotential height anomalies are statistically significant at the 90% confidence level based on two-sided Student′s t-test.

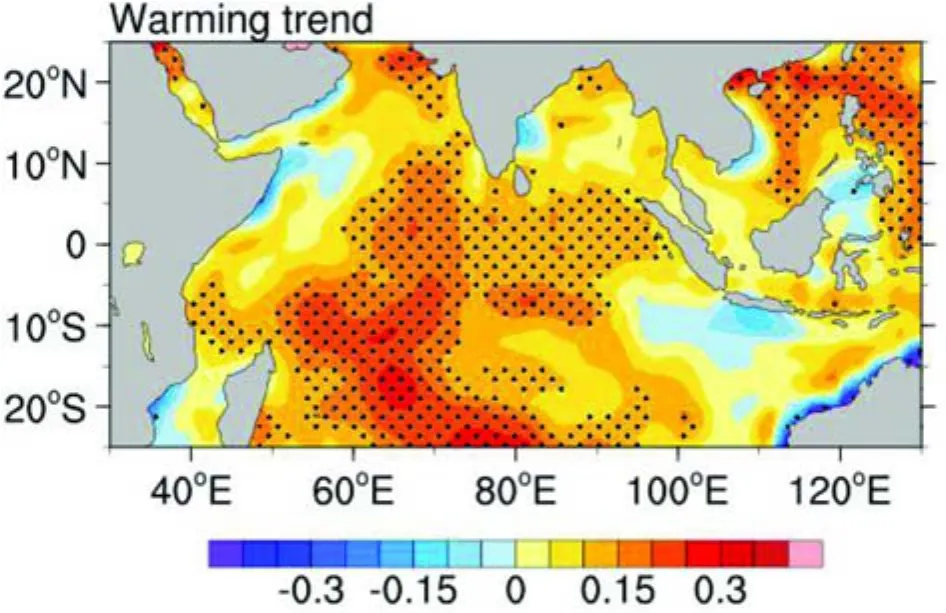
Fig.S4.Spatial distribution of the multi-decadal warming trends [°C (10 yr) -1] in the Indian Ocean SST anomalies during 1983-2020.Stippling denotes that the multi-decadal warming trend is statistically significant at the 95%confidence level according to two-sided Student-t test.

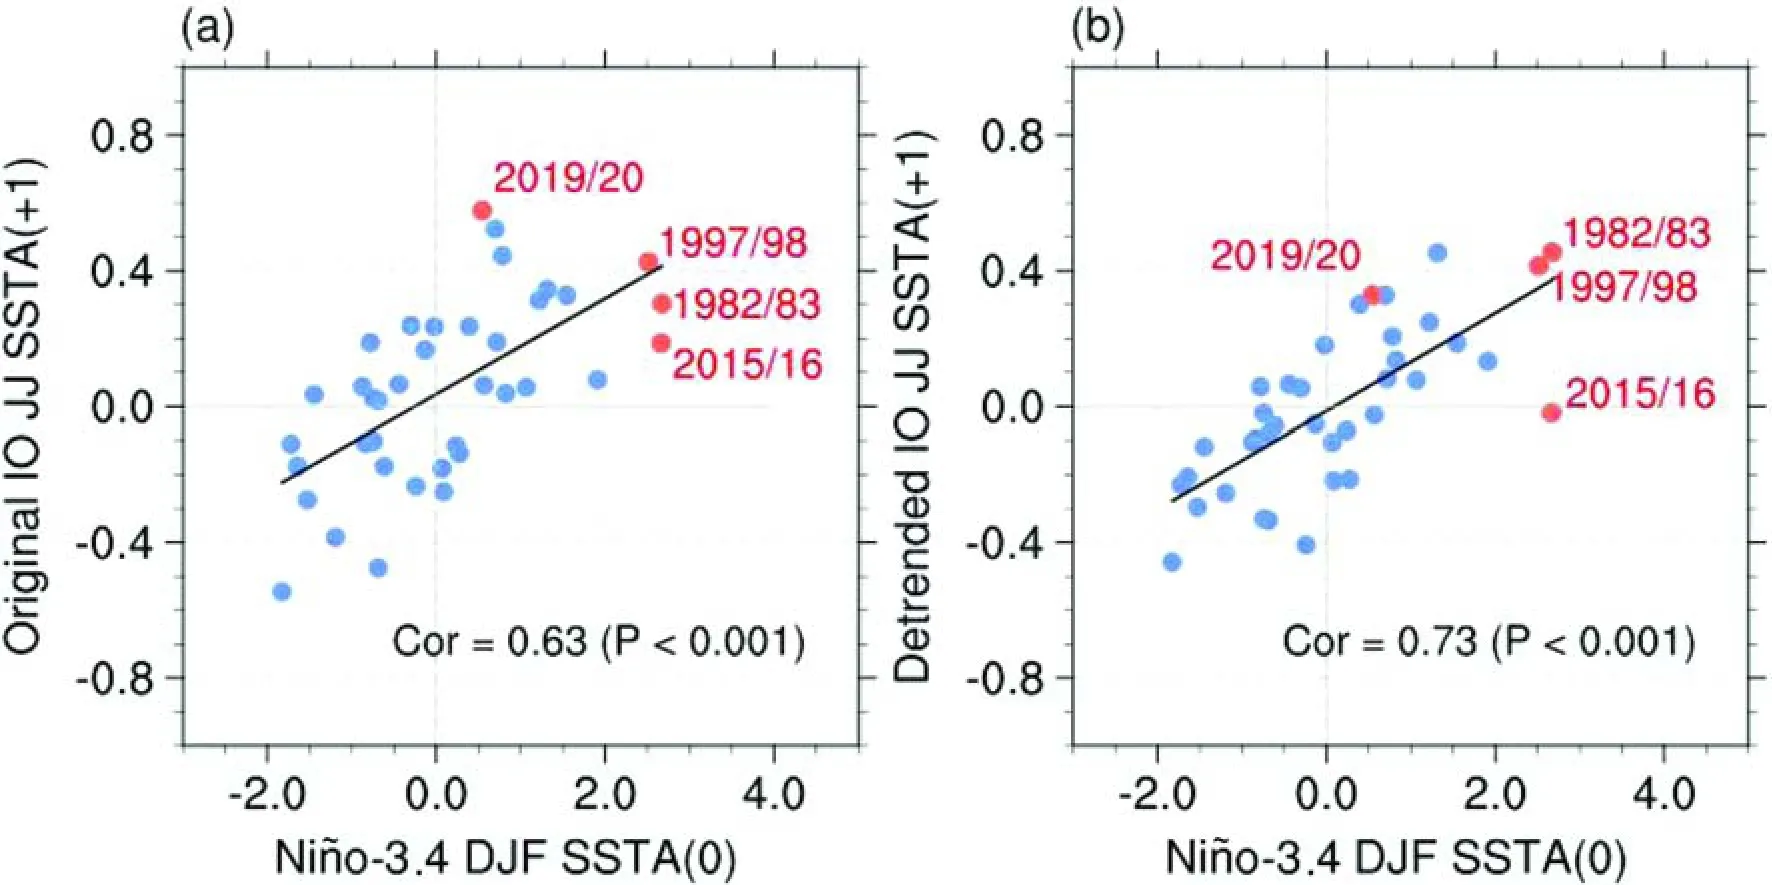
Fig.S5.Scatter plot of the Niño-3.4 SST anomalies in December-February (DJF, averaged over 5°N-5°S,190°-240°E) and (a) the original (non-detrended) and (b) detrended IO SST anomalies in following June-July (JJ,averaged over 20°N-20°S, 50°-100°E).Cor indicates correlation coefficient between two series.

Fig.S6.Correlation between the June-July precipitation anomalies over the MLYRV and the SST anomalies during 1983-2020 after linearly removing the influence of the IO SST anomalies on the MLYRV precipitation and the tropical SST anomalies.Stippling denotes that the correlation is statistically significant at the 95% confidence level according to two-sided Student-t test.
杂志排行
Advances in Atmospheric Sciences的其它文章
- Electronic Supplementary Material to:The Anomalous Mei-yu Rainfall of Summer 2020 from a Circulation Clustering Perspective: Current and Possible Future Prevalence*
- Seasonal Rainfall Forecasts for the Yangtze River Basin in the Extreme Summer of 2020※
- Two Types of Diurnal Variations in Heavy Rainfall during July over Korea※
- On the Diurnal Cycle of Heavy Rainfall over the Sichuan Basin during 10-18 August 2020※
- Typical Circulation Patterns and Associated Mechanisms for Persistent Heavy Rainfall Events over Yangtze-Huaihe River Valley during 1981-2020※
- On the Second-Year Warming in Late 2019 over the Tropical Pacific and Its Attribution to an Indian Ocean Dipole Event※
