Toward Understanding the Extreme Floods over Yangtze River Valley in June-July 2020: Role of Tropical Oceans※
2021-12-13ShaoleiTANGJingJiaLUOJiayingHEJiyeWUYuZHOUandWushanYING
Shaolei TANG, Jing-Jia LUO, Jiaying HE, Jiye WU, Yu ZHOU, and Wushan YING
Institute for Climate and Application Research (ICAR)/Key Laboratory of Meteorological Disaster of Ministry of Education/Joint International Research Laboratory of Climate and Environment Change/Collaborative Innovation Center on Forecast and Evaluation of Meteorological Disasters, Nanjing University of Information Science and Technology, Nanjing 210044, China
ABSTRACT
The extreme floods in the Middle/Lower Yangtze River Valley (MLYRV) during June-July 2020 caused more than 170 billion Chinese Yuan direct economic losses.Here, we examine the key features related to this extreme event and explore relative contributions of SST anomalies in different tropical oceans.Our results reveal that the extreme floods over the MLYRV were tightly related to a strong anomalous anticyclone persisting over the western North Pacific, which brought tropical warm moisture northward that converged over the MLYRV.In addition, despite the absence of a strong El Niño in 2019/2020 winter, the mean SST anomaly in the tropical Indian Ocean during June-July 2020 reached its highest value over the last 40 years, and 43% (57%) of it is attributed to the multi-decadal warming trend (interannual variability).Based on the NUIST CFS1.0 model that successfully predicted the wet conditions over the MLYRV in summer 2020 initiated from 1 March 2020 (albeit the magnitude of the predicted precipitation was only about one-seventh of the observed), sensitivity experiment results suggest that the warm SST condition in the Indian Ocean played a dominant role in generating the extreme floods, compared to the contributions of SST anomalies in the Maritime Continent, central and eastern equatorial Pacific, and North Atlantic.Furthermore, both the multi-decadal warming trend and the interannual variability of the Indian Ocean SSTs had positive impacts on the extreme floods.Our results imply that the strong multidecadal warming trend in the Indian Ocean needs to be taken into consideration for the prediction/projection of summer extreme floods over the MLYRV in the future.
Key words: summer extreme floods, Middle/Lower Yangtze River, El Niño, Indian Ocean SST, decadal warming trend
1.Introduction
The Middle/Lower Yangtze River Valley (MLYRV) is one of the most developed and densely populated regions in China.As one of the wettest regions in China, the MLYRV experiences strong year-to-year variations in precipitation and suffers frequent flooding in summer (e.g., Li et al.,2016a), which often brings tremendous loss in lives and properties of the local people.For example, the catastrophic flooding in 1998 summer caused approximately 3000 deaths and$30 billion economic loss (Huang et al., 1998; Jiang et al.,2008).Moreover, precipitation extremes around the Yangtze River might become more frequent in a warmer climate in future (e.g., Birkinshaw et al., 2017).Hence, it is important to investigate underlying mechanisms responsible for the strong summer precipitation over the MLYRV for better prediction and mitigation.
Summer precipitation anomalies over the MLYRV are strongly related to anomalies in the atmospheric large-scale circulation and associated moisture transport from the tropics to the MLYRV.Among those, the western North Pacific anticyclone (WNPAC, or Subtropical High) plays an important and even predominant role in controlling the moisture transport (e.g., Zhou and Yu, 2005).The persistent and strong WNPAC brings large amounts of air moisture from adjacent regions to the MLYRV and induces moisture convergence and precipitation there.
The formation and maintenance of the WNPAC is closely related to sea surface temperature (SST) anomalies in the tropical oceans (e.g., Wang et al., 2000, 2013; Yang et al., 2007; Xie et al., 2009, 2016; Yuan and Yang, 2020).For instance, warm SST anomalies in the central and eastern equatorial Pacific related to El Niño can generate cold SST anomalies in the western North Pacific, which in turn induce and maintain the WNPAC from the peak phase of El Niño in wintertime to the decaying phase in springtime by local wind-evaporation-SST feedbacks (e.g., Wang et al.,2000).On the other hand, the tropical Indian Ocean (IO)warms up following the El Niño because of the El Niñoinduced downwelling ocean Rossby waves in the southwestern basin (Huang and Kinter, 2002; Xie et al., 2002) and heat flux changes elsewhere (e.g., Klein et al., 1999; Tokinaga and Tanimoto, 2004).The tropical IO warming can persist through the subsequent spring and summer and maintain the WNPAC by generating eastward-propagating equatorial Kelvin waves and the resultant low-level divergence in the western North Pacific (e.g., Yang et al., 2007; Xie et al.,2009).The impact of the IO SST anomalies on the WNPAC is seasonally dependent, which becomes most effective during the decay phase of El Niño in summer (e.g., Wu et al.,2009).
Furthermore, the central and eastern equatorial Pacific cooling could also play a role in maintaining the Subtropical High and anomalous anticyclone in the western North Pacific by reducing convection around 160°E and stimulating Rossby waves to its northwest (e.g., Wang et al., 2013;Chen et al., 2016).Warm SST anomalies over the Maritime Continent can effectively stimulate local convection and thus lead to an anomalous Hadley circulation that ascends over the Maritime Continent and descends over the western North Pacific, suppressing convection over the western North Pacific and hence enhancing the WNPAC (e.g.,Chung et al., 2011; Chen et al., 2018, 2019).
The tropical Atlantic Ocean can also impact the WNPAC via two distinct mechanisms: Firstly, the tropical Atlantic warm SST anomalies can modulate the Walker circulation and induce anomalous descending and low-level divergence over the equatorial central Pacific.As a Rossby response to the anomalous divergence and resultant convection depression, the WNPAC is generated (Jin and Huo,2018; Yuan and Yang, 2020).Secondly, the Atlantic warm SST anomaly drives easterly wind anomalies over the Indowestern Pacific by eastward-propagating equatorial Kelvin waves, and these wind changes induce an Indo-western Pacific warming and enhance the WNPAC (Li et al., 2016b;Ma et al., 2020).
In addition to the important impacts of the tropical oceans, summer precipitation over the MLYRV is also influenced by other multiple factors, such as Tibetan Plateau snow depth (Ren et al., 2016; Yuan et al., 2017), North Atlantic Oscillation (Liu et al., 2020), midlatitude circulation (Li et al., 2017), Asian westerly jet (Li and Lu, 2017),and blocking Highs in mid- and high latitudes of the Eurasian continents (e.g., Ding and Chan, 2005; Yuan et al.,2017).In summary, the interannual variations of summer precipitation over the MLYRV are governed by many complicated processes.
Currently the forecast skill of summer precipitation anomalies in China, based on both statistical and dynamical model methods, is quite limited and the forecast score in general reaches merely ~60%-70% (e.g., Fan et al., 2008;Wang et al., 2015).Owing to the complicated influences of various processes/signals in the tropics and extratropics, correct prediction of the summer precipitation anomaly in the MLYRV remains as a key and long-standing challenge.Nevertheless, because of the long memory of tropical oceans and their strong impacts on the WNPAC, dynamical precipitation forecast models may have some skill in predicting the MLYRV summer precipitation at long lead times if the climate models are able to simulate these dynamical processes correctly.For example, Li et al.(2016a) showed that a considerable level of seasonal prediction skill of the Yangtze River valley summer precipitation in the Met Office’s operational seasonal forecasting system GloSea5 arose from the prediction of convection around the Maritime Continent.Additionally, the main source of the statistically significant skill of GloSea5 in predicting June precipitation in the MLYRV up to 4 months ahead was provided by the equatorial Pacific SSTs in the preceding winter (Martin et al.,2020).
It is widely recognized that precipitation over the MLYRV tends to strengthen considerably during the decaying summer of a strong El Niño, as demonstrated by the catastrophic flooding suffered in the summers of 1983, 1998 and 2016.However, the MLYRV unexpectedly suffered from heavy precipitation in June-July 2020 with no strong El Niño occurring in the 2019/2020 winter, except for a weak warm condition in the western and central equatorial Pacific caused by a central Pacific-type El Niño (Fig.S1 in the Electronic Supplementary Material, ESM).The accumulated precipitation in June-July 2020 exceeded those in 1998 and 2016 and broke the record since 1961 (Fig.1c,Liu et al., 2020).The occurrence of this extreme summer flooding without a preceding strong El Niño forcing raises a new question about the well-accepted notion, and makes the MLYRV summer precipitation prediction more challenging.Therefore, exploring the underlying mechanisms of this type of extreme summer flood is crucial to improving its predictability and disaster prevention over the MLYRV in future.
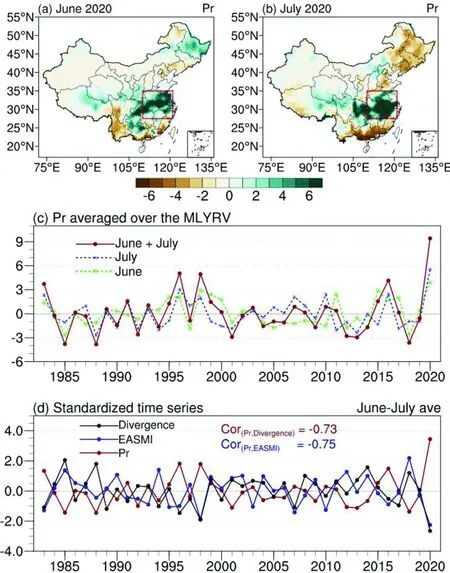
Fig.1.(a-b) Spatial distribution of precipitation anomalies (mm d-1) in June and July 2020; (c) Year-by-year variation of the precipitation anomaly (mm d-1) in June and July averaged over the Middle/Lower Yangtze River Valley (MLYRV, 27.5°-35°N, 110°-121°E) indicated by the red box in (a-b); (d) As in (c), but for the standardized June-July averaged precipitation anomaly, East Asian Summer Monsoon Index (EASMI), and moisture flux divergence vertically integrated from 1000 hPa to 300 hPa.Cor indicates correlation coefficient between two series.
By conducting ensemble prediction experiments,Takaya et al.(2020) found that warm SST anomalies in the Indian Ocean aftermath of the super Indian Ocean Dipole(IOD) event in 2019 might play a role in the enhanced Meiyu-Baiu rainfall in early summer 2020.Zhou et al.(2021) also suggested that the record-breaking strong IOD event in 2019 was an important contributor to the extreme Yangtze flooding of 2020.However, considerable SST anomalies also appeared in other tropical oceans, including a La Niña condition.Whether the SST anomalies in the Pacific and Atlantic Oceans may also have contributed to the occurrence of this extreme summer flooding over the MLYRV is not yet explored.And relative contributions of the tropical SST anomalies in different basins to this extreme summer flooding are yet unclear.Therefore, in this study, we attempt to explore the above questions by conducting sensitivity experiments with NUIST CFS1.0 model.We also briefly assess the performance of NUIST CFS1.0 in predicting this extreme summer flooding over the MLYRV.
The paper is organized as follows: The dataset, methodology, and model experiments are described in section 2.Section 3 presents the observed characteristics of precipitation,atmospheric circulation, and SST anomalies during June and July 2020.Section 4 analyzes the numerical sensitivity experiment results and model predictions.Finally, summary and discussion are given in section 5.
2.Data, methodology, and model experiment
2.1.Data and methodology
Observational datasets used in this study include: SST from the NOAA 1/4° monthly Optimum Interpolation Sea Surface Temperature (OISST) version 2.1 (Reynolds et al.,2002), precipitation from both the gridded monthly station precipitation in China (Version 2.0, Zhao et al., 2014) and the CPC Merged Analysis of Precipitation (CMAP; Xie and Arkin, 1997), and pressure level wind, geopotential height and relative humidity data from the NCEP-NCAR Reanalysis-1 (Kalnay et al., 1996).Monthly anomalies were obtained by subtracting the monthly mean climatology for the period 1983-2012.We adopted the East Asian summer monsoon index (EASMI, Wang et al., 2008) to represent the large-scale summer monsoonal circulation, which is defined by the difference of 850 hPa zonal wind (U850) between(5°-15°N, 90°-130°E) and (22.5°-32.5°N, 110°-140°E).
2.2.Model description and experiment design
2.2.1.The model
The fully coupled ocean-atmosphere model used in the study is the Climate Forecast System version 1.0 of Nanjing University of Information Science and Technology (NUIST CFS1.0, He et al., 2020), which is developed from the coupled model SINTEX-F (Luo et al., 2003, 2005a, b; Masson et al., 2005).The atmospheric component is the latest version of ECHAM4 with a high horizontal resolution (T106)of about 1.1°×1.1°.A hybrid sigma-pressure vertical coordinate (19 levels in total) is used with the highest vertical resolution near the earth’s surface.The ocean component is the reference version 8.2 of OPA with the ORCA2 configuration, and the horizontal resolution is 2° (longitude) × 2°cosine (latitude) with meridional resolution increased to 0.5° near the equator.The ocean model has 31 vertical levels, 19 of which are in the upper 400 meters.The coupling variables (i.e., water, heat, and momentum flux, and SST) without flux correction are exchanged every two hours between the OPA and ECHAM4 models by means of the OASIS 2.4 coupler (Valcke et al., 2000).
2.2.2.Hindcast experiments
To evaluate the model’s performance in predicting the East Asian summer monsoon and precipitation over China,ensemble hindcasts initiated from 1 March of each year during 1983-2017 were performed.The hindcasts consist of 9-member ensemble predictions generated by three different initial conditions for each of three model versions with modified coupling physics (Luo et al., 2008).Only the observed weekly NOAA OISST values are assimilated into the coupled model to generate realistic and well-balanced initial conditions required for the hindcasts.
2.2.3.Sensitivity experiments
To explore the possible impacts of SST anomalies in the tropical oceans on the MLYRV precipitation, a set of ensemble sensitivity experiments were conducted.To obtain robust results, we added another 18 ensemble members in addition to the 9 members used in the hindcast experiments.As for the additional 18 members, the initial conditions for the NUIST CFS1.0 were obtained by assimilating the 6-hourly zonal and meridional wind, air temperature and surface air pressure of the JRA-55 reanalysis data (Kobayashi et al., 2015) into the atmosphere model and NOAA OISST data into the ocean model in a coupled manner.Similarly,the additional 18 members were generated by various combinations of different initial conditions and modified coupling physics.
To evaluate the relative contributions of SST anomalies in different tropical oceans to the MLYRV precipitation, we conducted five groups of ensemble experiments from 1 May to 31 July.Each group consists of two sensitivity experiments.In the first group of the experiments, we specified the observed monthly climatological SST of 1983-2012 in one sensitivity experiment (EXP_IOCLM) in the tropical Indian Ocean (IO, 20°S-20°N, 50°-100°E), and keep elsewhere free ocean-atmosphere coupling.In the other sensitivity experiment (EXP_IOOBS), we specified the observed monthly SST values during April-August 2020 in the IO region, and keep elsewhere free ocean-atmosphere coupling.Thus, the differences between the two sensitivity experiments (EXP_IOOBS-minus-EXP_IOCLM) represent the impacts of the Indian Ocean SST anomalies on the MLYRV precipitation.
Similarly, in the second, third, and fourth group of the sensitivity experiments, we specified the observed monthly climatological SST in the Maritime Continent (MC,10°S-10°N, 100°-130°E, EXP_MCCLM), central and eastern equatorial Pacific (CEP, 5°S-5°N, 180°-80°W,EXP_CEPCLM), and North Atlantic Ocean (NAT,0°-25°N, 60°-15°W, EXP_NATCLM), respectively, and keep elsewhere free ocean-atmosphere coupling.And in the counterpart experiments, we specify the observed monthly SST values during April-August 2020 in the MC(EXP_MCOBS), CEP (EXP_CEPOBS), and NAT(EXP_NATOBS), respectively, and keep elsewhere free ocean-atmosphere coupling.Thus, the differences between EXP_MCOBS and EXP_MCCLM (EXP_MCOBS-minus-EXP_MCCLM), between EXP_CEPOBS and EXP_CEPCLM (EXP_CEPOBS-minus-EXP_CEPCLM), and between EXP_NATOBS and EXP_NATCLM(EXP_NATOBS-minus-EXP_NATCLM) represent the impacts of the SST anomalies in the MC, CEP, and NAT on the MLYRV precipitation, respectively.In addition, we conducted a fifth group of the sensitivity experiments, in which we specified observed monthly climatological SST in one experiment (EXP_ALLCLM) and observed monthly SST values in the other experiment (EXP_ALLOBS) in the above four regions.And the differences between the two experiments (EXP_ALLOBS-minus-EXP_ALLCLM) represent the combined impacts of the SST anomalies in the above four regions on the MLYRV precipitation.The groups of the sensitivity experiments are summarized in Table 1.

Table 1.Experiments conducted to investigate the relative contributions of SST anomalies in different tropical oceans to the precipitation anomaly in June-July 2020 over the MLYRV Ensemble simulations (27 members) are conducted starting from 1 May 2020.
High-quality observations have shown that the tropical IO has experienced rapid surface warming over the past few decades (Luo et al., 2012; Roxy et al., 2014).At the same time, the June-July averaged IO SST anomaly in 2020 reached its highest value in the last 40 years (Fig.S2a in the ESM).In order to examine the respective role of the multidecadal warming trend and interannual variations of the IO SST in the 2020 summer MLYRV extreme precipitation,two additional ensemble prediction experiments are conducted.In the first model simulations from 1 May to 31 July,we specified observed monthly climatological SST plus detrended SST anomalies in the tropical IO, and kept other regions fully coupled (EXP_IODET).Thus, the differences between EXP_IODET and EXP_IOCLM (EXP_IODET-minus-EXP_IOCLM) represent the impacts of interannual anomalies of the tropical IO SST anomalies on the MLYRV precipitation in June-July 2020.In the second experiment,we specified observed monthly climatological SST plus multi-decadal warming trend component in the tropical IO(EXP_IOTRE).The differences between EXP_IOTRE and EXP_IOCLM (EXP_IOTRE-minus-EXP_IOCLM) therefore represent the impacts of the IO multi-decadal warming trend on the MLYRV precipitation.The additional two experiments are summarized in Table 2.

Table 2.Experiments conducted to investigate the relative contributions of the Indian Ocean SST multi-decadal warming trend and interannual variations to the precipitation anomaly in June-July 2020 over the MLYRV.Ensemble experiments (27 members) are conducted starting from 1 May 2020.
3.Observational results
Figures 1a and 1b show that the MLYRV (27.5°-35°N,110°-121°E, red box in Fig.1a) suffered extremely heavy precipitation in both June and July of 2020; in fact, the sum of the precipitation anomalies in June-July 2020 reached its highest value in the last 40 years, far exceeding the previous records in 1983, 1998, and 2016 (Fig.1c).The summer precipitation anomalies in the MLYRV are closely related to the large-scale circulation anomalies over the western North Pacific and resultant moisture convergence.As shown in Fig.1d, during 1983-2020, the June-July averaged precipitation anomaly in the MLYRV is negatively correlated to the EASMI and column integrated (1000-300 hPa) moisture flux divergence, and their correlation coefficients reach -0.75 and -0.73, respectively; both are significant above the 95% confidence level.Consistently, the extreme precipitation anomalies in the MLYRV during June-July 2020 were closely linked to the stronger-than-normal Subtropical High (i.e., anticyclonic anomalies) in the western North Pacific region (Fig.2a), which brought abundant tropical warm moisture to the MLYRV that converged there (Fig.2b).

Fig.2.Spatial distribution of June-July 2020 averaged (a) 850 hPa wind (vector, m s-1) and geopotential height(shading, gpm) anomalies, (b) column-integrated (1000 to 300 hPa) moisture flux (vector, g m-1 s-1) and its divergence (shading, g m-2 s-1) anomalies, (c) SST (°C) anomalies, (d) precipitation (mm d-1) anomalies.Red boxes in (a-b) denote the same region as in Fig.1(a-b).Red boxes A to D in (c-d) indicate the tropical Indian Ocean (IO,20°S-20°N, 50°-100°E), Maritime Continent (MC, 10°S-10°N, 100°-130°E), central and eastern equatorial Pacific(CEP, 5°S-5°N, 180°-80°W), and North Atlantic Ocean (NAT, 0°-25°N, 60°-15°W) (see Table 1).
Meanwhile, strong SST anomalies appeared in the trop-ical oceans during June-July 2020: warm SST anomalies occurred in the tropical IO, MC, Western Pacific (WP) and NAT, and cold SST anomalies happened in the CEP (Fig.2c).The simultaneous correlation analysis shows that the SST anomalies in all these regions except those in the CEP are significantly correlated to the June-July precipitation anomalies in the MLYRV (Fig.3).We note that the air-sea causality relation in the WP appears to be different from other regions that show positive precipitation anomalies occur over warm SST anomalies.In the WP, negative precipitation anomalies appear over the warm SST anomalies (Fig.2d).This indicates that the warm SST anomalies in the WP may play a passive role and be caused by reduced cloud cover and hence more surface solar radiation.Therefore, it should not be considered as a potential forcing of the atmosphere when looking for the causes of the strong precipitation anomalies in the MLYRV during June-July 2020.In addition,although the SST anomalies in the CEP are not significantly correlated with the MLYRV summer precipitation anomalies (Fig.3), previous modeling studies suggested that the cold SST anomalies in the CEP also played a role in maintaining a strong Subtropical High and anomalous anticyclone in summer over the western North Pacific (e.g., Wang et al.,2013; Chen et al., 2016).In terms of the above considerations, the SST anomalies in the following four regions are selected and specified in the sensitivity model experiments,which may exert possible influences on the MLYRV precipitation during June-July 2020.These four regions are IO(20°S-20°N, 50°-100°E; box A in Fig.2c); MC (10°S-10°N, 100°-130°E; box B in Fig.2c); CEP (5°S-5°N,180°-80°W; box C in Fig.2c); NAT (0°-25°N, 60°-15°W;box D in Fig.2c).
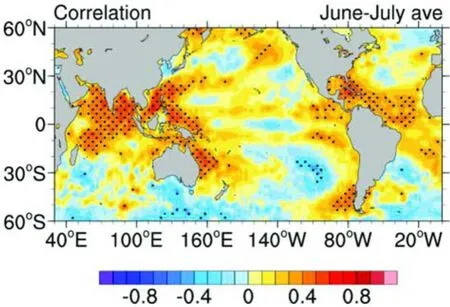
Fig.3.Simultaneous correlations between June-July averaged precipitation anomalies over the MLYRV and June-July averaged SST anomalies over the global ocean during the period 1983-2020.Stippling indicates the correlation exceeds the 95% significant level based on two-sided Student-t test.
The observations show that the SST anomalies in the IO, NAT, and MC in June-July 2020 were strong; all exceeded one standard deviation of the SST anomalies(Fig.S2).What is even more surprising is that the SST anomaly in the IO reached its highest value since 1983 (Fig.S2a).To better estimate independent impacts of the tropical SST anomalies on the MLYRV precipitation, we conducted a partial regression analysis based on the SST anomalies in the IO, MC, CEP and NAT.The results suggest that the anticyclonic anomalies over the western North Pacific and positive precipitation anomalies in the MLYRV during June-July are significantly related to the warm SST anomalies in the IO (Fig.4a).In addition, the SST anomalies in the MC,CEP and NAT also have impacts but their influences are relatively weak (Figs.4b-d).Specifically, the partially regressed precipitation anomalies over the MLYRV corresponding to one standard deviation of the SST anomalies in the IO, MC,CEP and NAT are 0.82 mm d, 0.10 mm d, 0.31 mm dand 0.13 mm d, respectively.In the next section, the relative contributions of the SST anomalies in these four regions to the strong MLYRV precipitation during June-July 2020 are examined with a set of numerical sensitivity experiments.
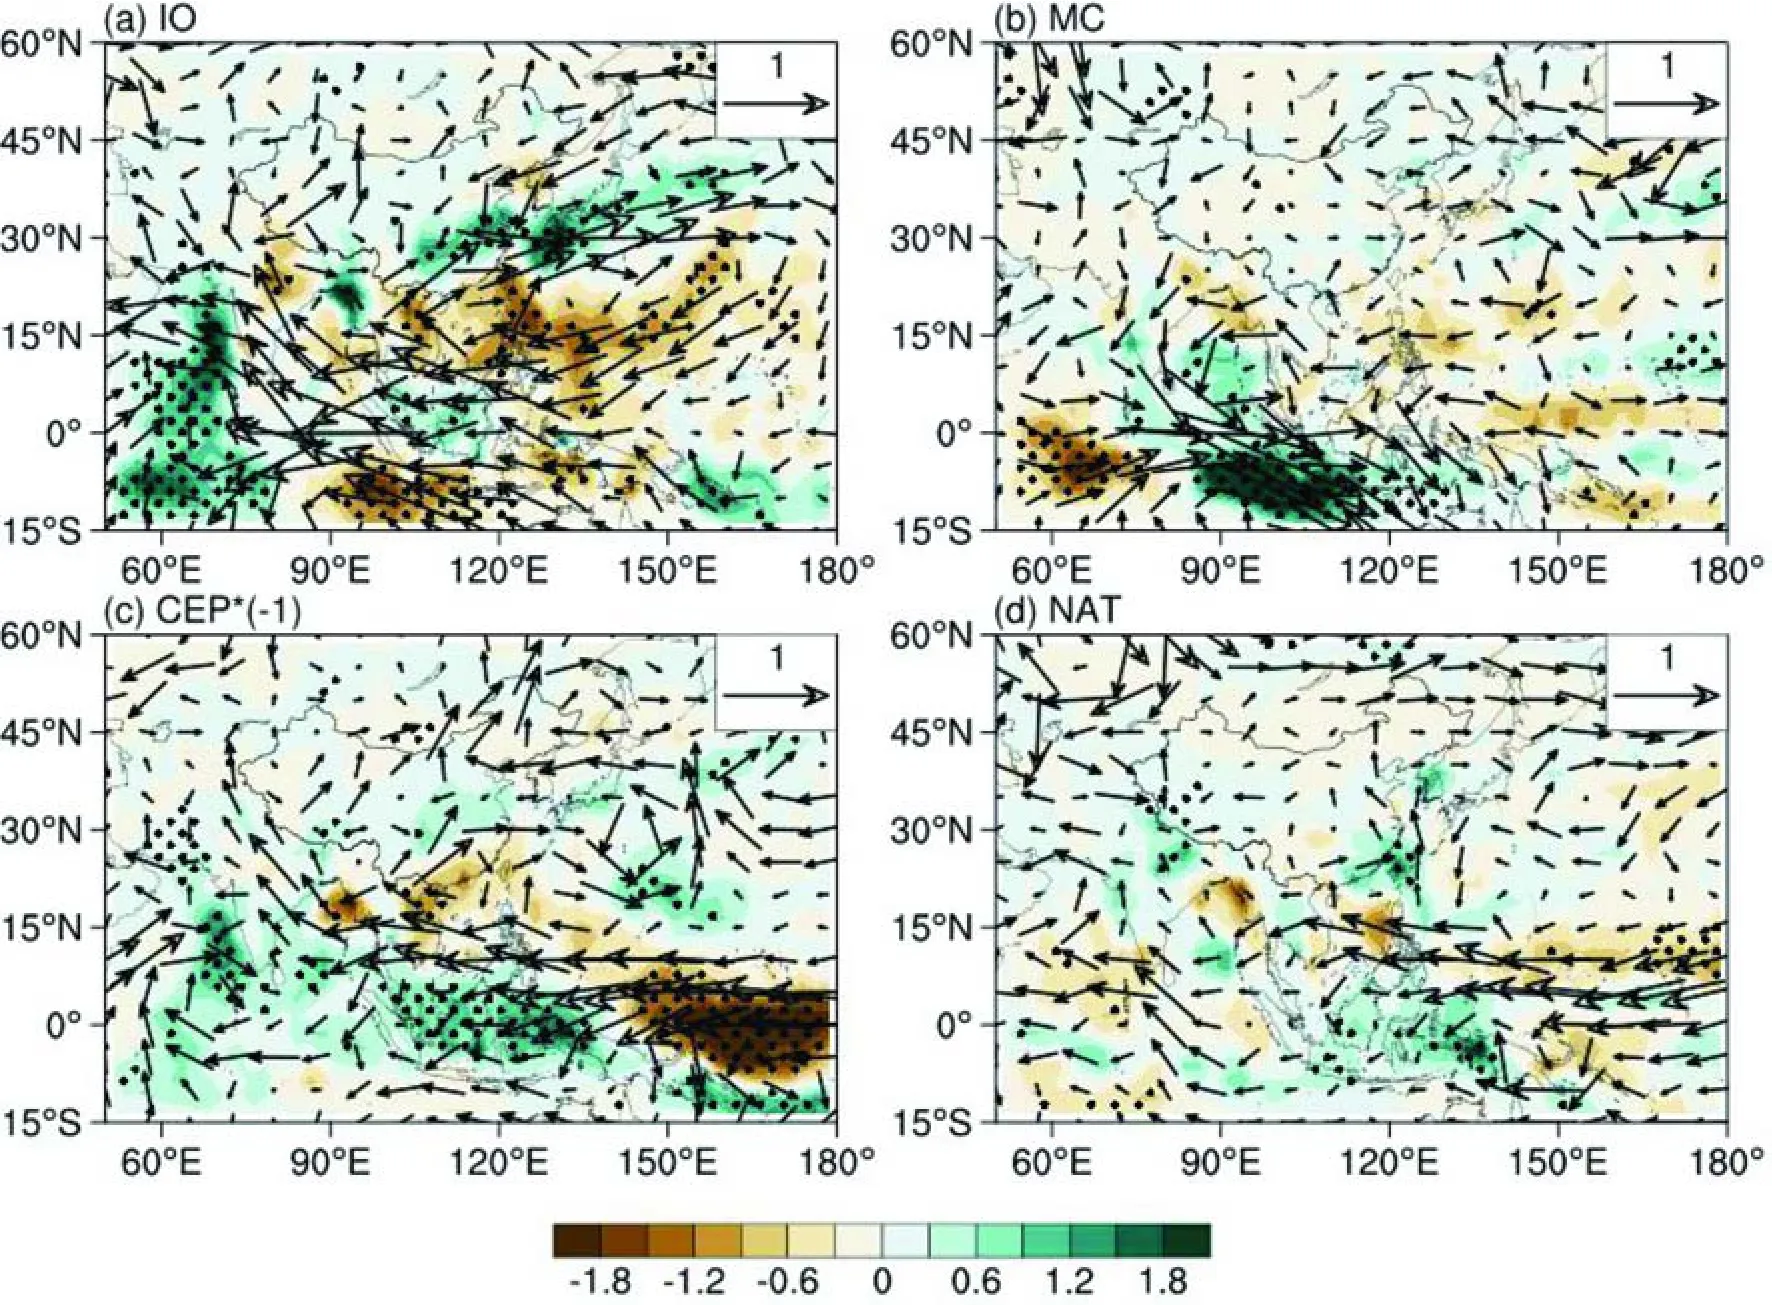
Fig.4.Partially regressed 850 hPa wind (vector, m s-1) and precipitation (shading, mm d-1) anomalies on the standardized SST anomalies averaged over the (a) Indian Ocean (IO, box A in Fig.2c), (b) Maritime Continent (MC,box B in Fig.2c), (c) central and eastern equatorial Pacific (CEP, box C in Fig.2c), and (d) North Atlantic Ocean(NAT, box D in Fig.2c) during the period 1983-2020.To better display the impact of La Niña on the MLYRV precipitation, sign of the regressed anomalies on the CEP SST index is reversed.Stippling denotes precipitation regression coefficients are statistically significant at the 90% confidence level according to two-sided Student-t test.
4.Experimental results
Before conducting the sensitivity experiments, we briefly assess the performance of NUIST CFS1.0 model in reproducing the observed East Asian summer monsoon index (EASMI) and summer precipitation in China.Previous studies have shown that, at lead times of several months, NUIST CFS1.0 displayed a good skill in predicting the Northwest Pacific atmospheric anomalies and the EASMI during summer, including the anomalous anticyclone following El Niño (Chowdary et al., 2011; Li et al.,2018).In addition, as shown in Figs.5a and 5b, the distribution of the observed climatological precipitation in China,which shows a gradual decrease in the amplitude from the southeast coastal areas to the northwest inland, is reasonably well reproduced by the model predictions.The interannual variations of the EASMI and precipitation over the MLYRV during 1983-2017 can be predicted from 1 March with statistically significant correlation skill of 0.73 for the EASMI and 0.47 for the MLYRV precipitation (Figs.5c and d).This indicates that NUIST CFS1.0 has moderate skill in replicating the precipitation variations over the MLYRV.
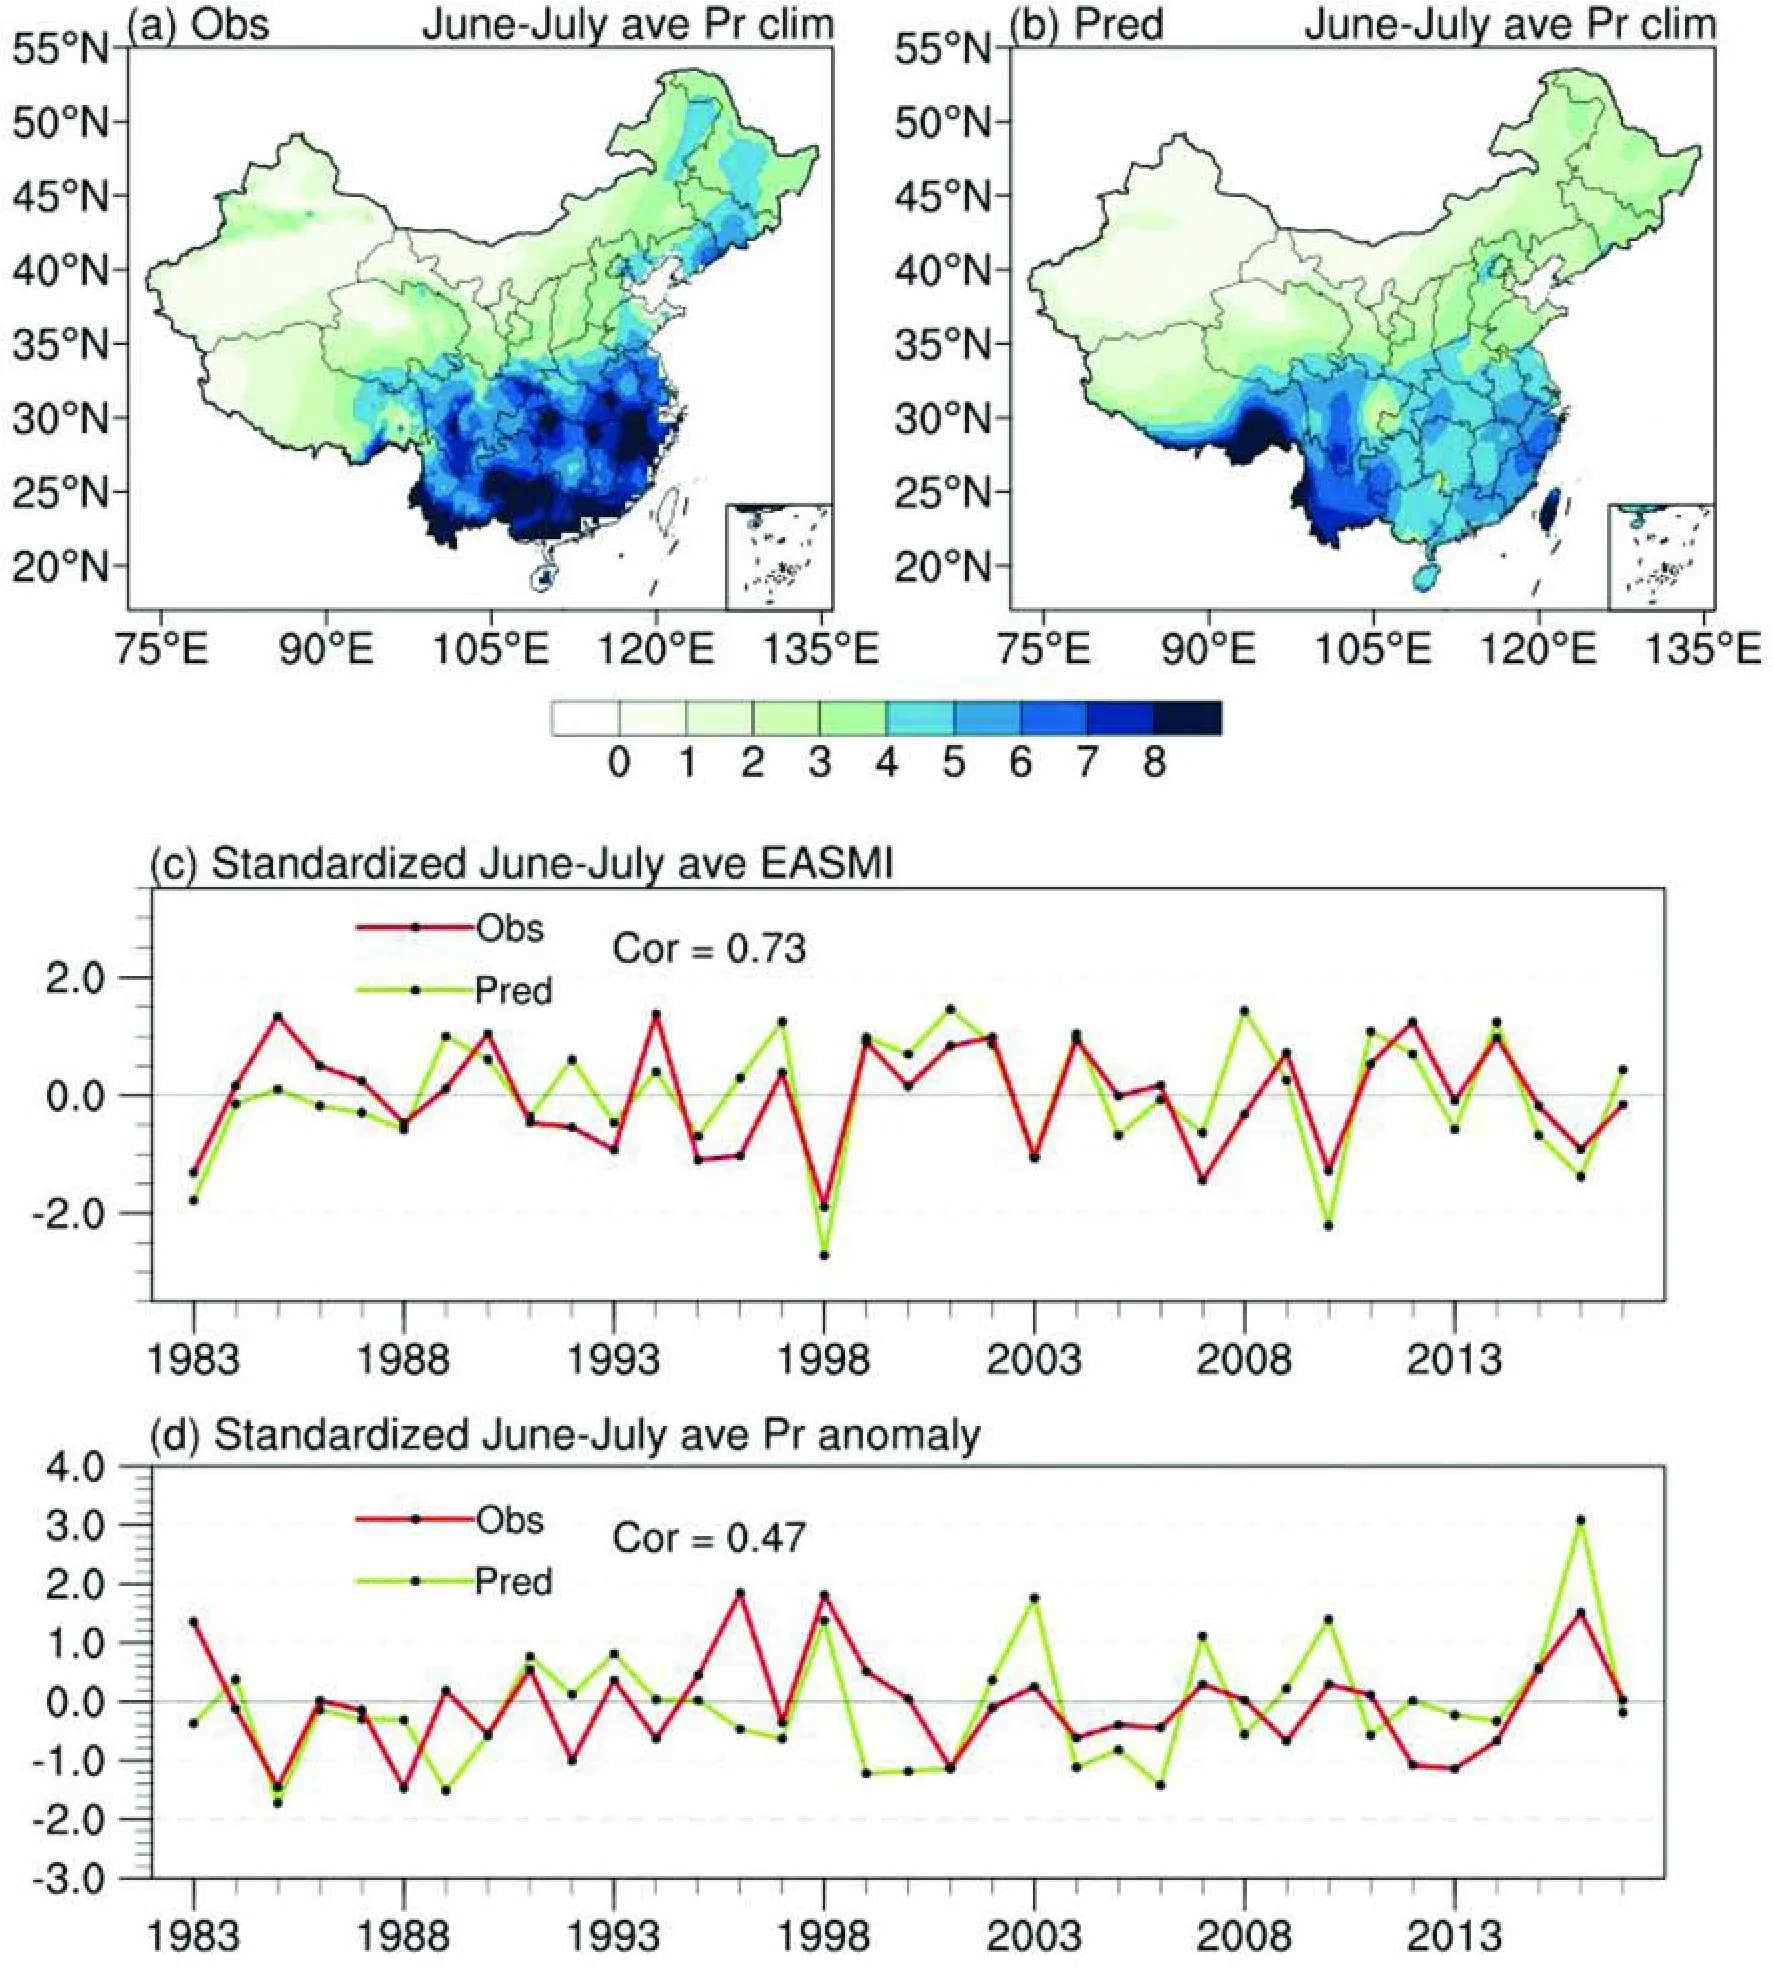
Fig.5.(a-b) Spatial distribution of June-July averaged precipitation climatology (1983-2012, mm d-1) in China based on (a) observation, and (b) ensemble predictions initiated from 1 March of each year.(c) The observed (red line) and predicted (green line) standardized East Asian Summer Monsoon Index (EASMI) of June-July during 1983-2017.Cor=0.73 indicates the correlation coefficient between the observation and hindcasts initiated from 1 March of each year, which is significant at the 95% confidence level according to two-sided Student′s t-test.(d) As in (c), but for the June-July averaged precipitation anomalies over the MLYRV.
4.1.Relative contributions of SST anomalies in different oceans
Figures 6a-c display the responses of the large-scale circulation and precipitation to the SST anomalies in the tropical IO during June-July 2020.As expected, corresponding to the warm SST anomalies in June and July 2020, there are positive precipitation anomalies in the IO (Fig.6a), strong easterly wind anomalies in the MC and WP, and enhanced Subtropical High and anticyclone in the western North Pacific (Fig.6b).As a result, positive precipitation anomalies appear in the MLYRV (Fig.6c).The results are consistent with previous findings about the impact of the IO warm SST anomaly on the WNPAC (Yang et al., 2007; Xie et al.,2009).Note that, in response to the warm SST anomalies in the IO, cold SST and negative precipitation anomalies appear in the western and central equatorial Pacific (Fig.6a);this indicates that the strong warm SST anomalies in the IO during June-July 2020 may have played a role in triggering the fast phase transition from the moderate 2019/2020 central Pacific type of El Niño to La Niña in summer 2020 (e.g.,Kug et al., 2006; Luo et al., 2010, 2017; Kim et al., 2011).
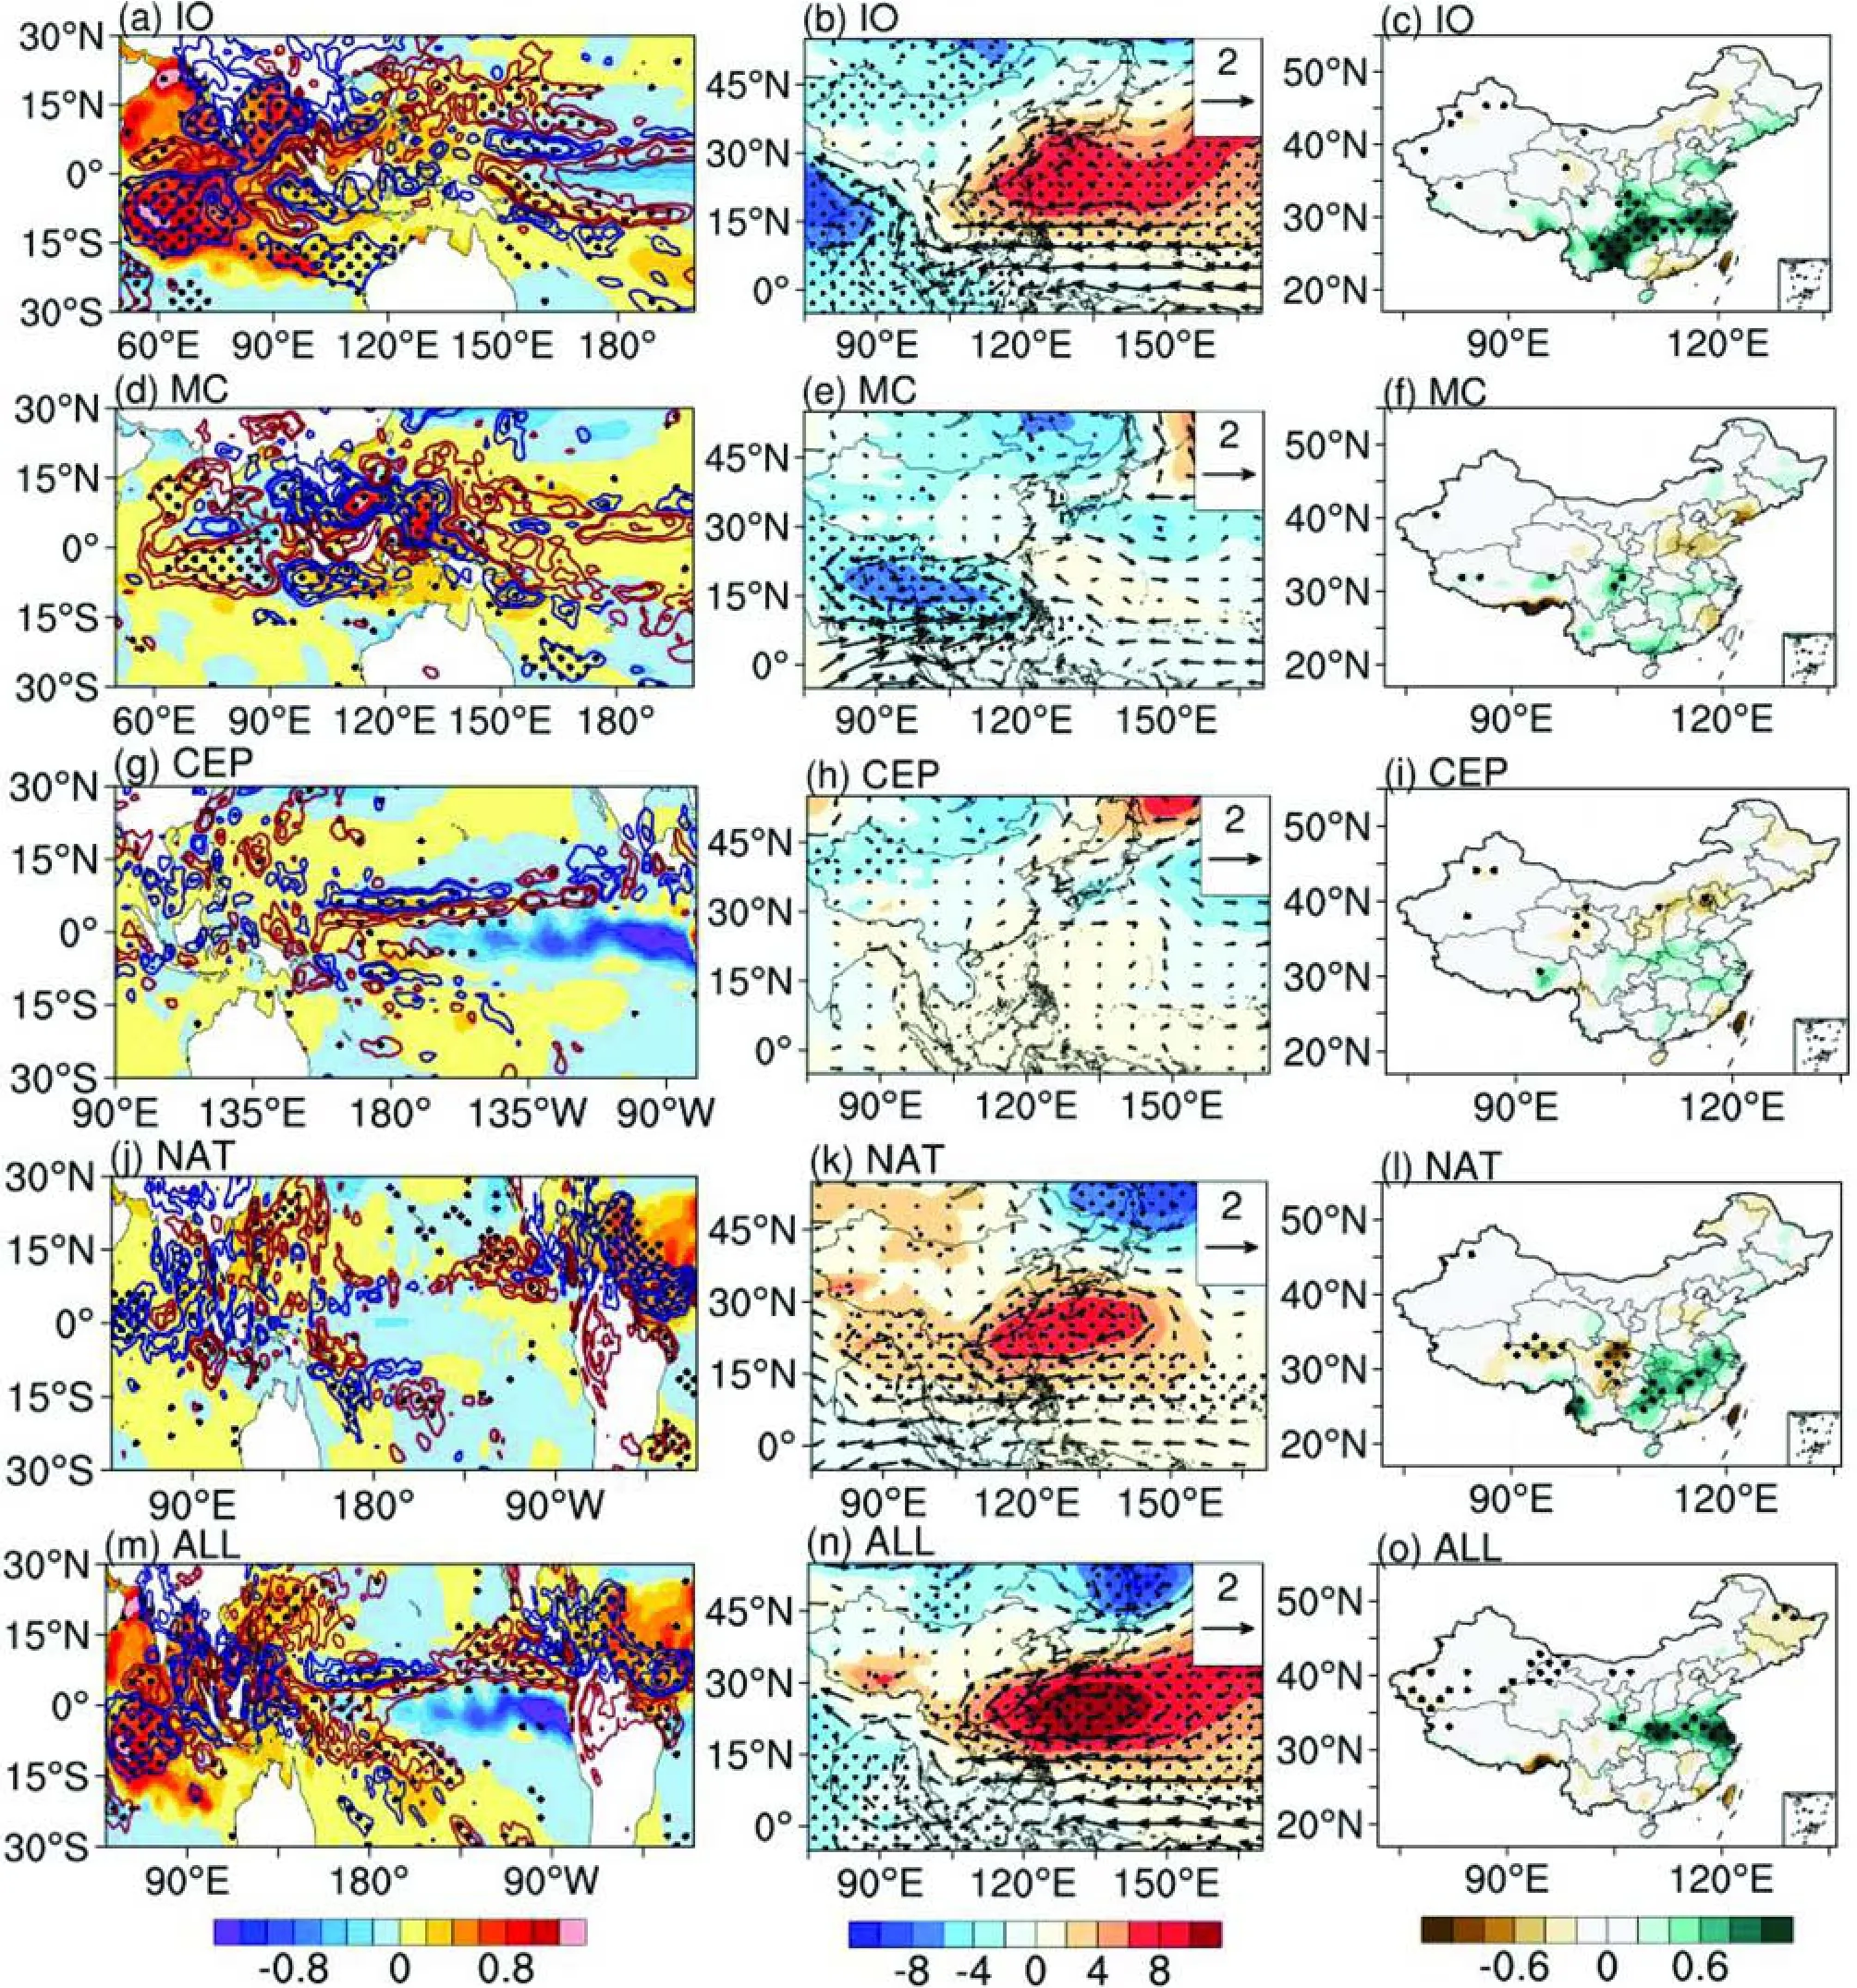
Fig.6.Impacts of the SST anomalies in the IO, MC, CEP, and NAT on the climate during the June-July 2020 based on the sensitivity model experiments.(a) SST (shading, °C) and precipitation (contour; CI: ±0.5, ±1.0, ±2.0, ±4.0, ±7.0 mm d-1) differences between EXP_IOOBS and EXP_IOCLM (EXP_IOOBS-minus-EXP_IOCLM), induced by the IO SST anomalies during June-July 2020.The blue and red lines indicate positive and negative precipitation anomalies, respectively.(b) As in (a), but for 850 hPa geopotential height (shading, gpm) and horizontal wind (vector, m s-1).(c) As in (a), but for precipitation anomalies (mm d-1) over China.Stippling in (a) - (c) indicates that the IO SST impacts are statistically significant at the 90% confidence level based on twosided Student-t test; (d-f), (g-i), (j-l), and (m-o), As in (a-c), but for the impacts of the SST anomalies in the MC (EXP_MCOBS-minus-EXP_MCCLM), CEP (EXP_CEPOBS-minus-EXP_CEPCLM), NAT (EXP_NATOBS-minus-EXP_NATCLM), and for all four regions (EXP_ALLOBS-minus-EXP_ALLCLM).
Figures 6d-f show the impacts of the MC SST anomalies on the large-scale circulation and precipitation during June-July 2020.As shown in Fig.6d, positive precipitation anomalies appear over the MC and negative precipitation anomalies occur over the western North Pacific.A strongerthan-normal Subtropical High exists over the western North Pacific, but its amplitude is weak and is located more to the southeast compared to that shown in Chung et al.(2011)(Fig.6e).This is possibly because the SST anomalies in the MC during June and July 2020 are weaker than those imposed in the experiment of Chung et al.(2011).As a result, the MC SST anomalies have little influence on the precipitation over the MLYRV during June-July 2020 (Fig.6f).
In response to the cold SST anomalies in the CEP during June-July 2020, negative precipitation anomalies appear over the western and central equatorial Pacific(Fig.6g).A large but weak Subtropical High/anticyclone anomaly appears over the western North Pacific (Fig.6h),and correspondingly, weak positive precipitation anomalies occur over the MLYRV (Fig.6i).Note that the weak anticyclone and precipitation responses to the cold SST anomalies in the CEP somehow are different from the experimental results of Wang et al.(2013).This may be because the cold SST anomalies during June-July 2020 are weak in the central Pacific and locate much eastward, while in Wang et al.(2013) the cold SST anomalies with a maximum value of about -0.8°C are imposed between 160°E and 260°E along the equator (10°S-10°N).
The warm SST anomalies prescribed in the NAT also induce strong positive precipitation anomalies there (Fig.6j).In response to this, a statistically significant and strong anticyclone anomaly appears over the western North Pacific(Fig.6k) that leads to apparent positive precipitation anomalies in the MLYRV (Fig.6l).Interestingly, strong easterly wind anomalies appear over the MC and WP region (Fig.6k), which resembles the response to the warm SST anomalies in the tropical IO (i.e., Fig.6b).The easterly wind anomalies induced by the warm SST anomalies in the NAT extend from the Indo-western Pacific to the NAT (Fig.S3 in the ESM), which is consistent with the result of previous studies (e.g., Li et al., 2016a).Note that the warm NAT SST anomalies also induce large positive precipitation anomalies in the equatorial IO (Fig.6j), which could enhance the WNPAC by generating eastward-propagating equatorial Kelvin waves (Xie et al., 2009).However, in contrast to the previous results (e.g., Jin and Huo, 2018; Yuan and Yang,2020), no apparent negative precipitation anomalies occur over the equatorial central Pacific in response to the prescribed warm SST anomalies in the NAT during June-July 2020.Therefore, the significant anomalous anticyclone over the western North Pacific in the NAT experiment is more likely induced by the enhanced precipitation over the IO,which is initially caused by the warm SST anomalies in the NAT via exciting eastward-propagating equatorial Kelvin waves (e.g., Li et al., 2016a; Ma et al., 2020).
Figures 6m-o display the combined impacts of the SST anomalies in the four regions.It is obvious that the Subtropical High and anticyclone anomaly in the western North Pacific in response to the prescribed SST anomalies in the four regions together during June-July 2020 are stronger than those induced by the SST anomalies in individual region separately (Fig.6n).Correspondingly, stronger positive precipitation anomalies are simulated over the MLYRV region (Fig.6o).
The simulated precipitation anomalies averaged over the MLYRV during June-July 2020 in the coupled model experiments with the SST anomalies being specified in the above four regions separately and together are displayed in Fig.7.The results indicate that the SST anomalies in each of the four regions positively contribute to the enhanced precipitation over the MLYRV during June-July 2020, despite the fact that large uncertainties exist in association with the intrinsic complex nature of the summer precipitation variations.Among the contributions of the SST anomalies in the four regions, the unprecedented warm SST anomalies in the tropical IO have the largest contribution.Note that the MLYRV precipitation anomaly induced by the SST anomalies in the four regions together is not equivalent to, but apparently smaller than, the sum of the precipitation anomalies induced by the SST anomalies in each of the four regions separately.

Fig.7.Precipitation anomalies (mm d-1) averaged over the MLYRV during June-July 2020 based on the sensitivity experimental results (i.e., Fig.6).The error bars represent one standard deviation of the 27-member simulations, namely the differences in each pair of the sensitivity experiments.
This indicates that the contributions of the SST anomalies in the four regions to the precipitation over the MLYRV during June-July 2020 are not independent of one another.For instance, as discussed above, the warm SST anomalies in the NAT can induce strong positive precipitation anomalies in the tropical IO, which can in turn intensify the Subtropical High over the western North Pacific and the precipitation over the MLYRV during June-July 2020(recall Figs.6j-l).Moreover, the warm SST anomalies in the tropical IO can induce cold SST anomalies in the CEP(Fig.6a), partly contributing to the rapid development of the La Niña condition in June-July 2020.Therefore, the SST anomalies in the four tropical regions may have interacted with one another, and lead to complicated nonlinear impacts on the summer precipitation over the MLYRV.In addition,the large spread of the simulated precipitation anomalies over the MLYRV among the 27 members of the sensitivity experiments indicates a big challenge in predicting the precipitation variations there, which requires building probabilistic prediction systems in the future (Slingo and Palmer,2011).
4.2.Relative contributions of the IO multi-decadal warming and interannual variations
The results described above suggest that, compared to the SST anomalies in other tropical oceans, the warm SST anomalies in the IO have the strongest contribution to the enhanced precipitation over the MLYRV during June-July 2020.The warm SST anomaly in the tropical IO in June-July 2020 reached its highest value in the last 40 years(Fig.8).Furthermore, strong multi-decadal warming trends of the SST occurred in most parts of the tropical IO (Fig.S4 in the ESM; Luo et al., 2012; Zhang et al., 2019).Therefore,in this section, we further explore the relative contributions of the multi-decadal warming trend and interannual variations of the SST anomalies in the tropical IO to the strong precipitation anomalies over the MLYRV during June-July 2020.
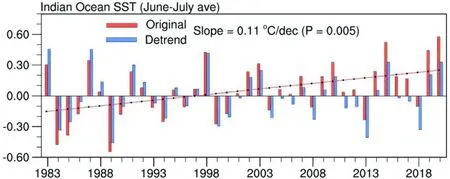
Fig.8.Non-detrended and detrended June-July mean SST anomalies (°C) in the tropical IO during 1983-2020.The red and blue bars represent the original (non-detrended) and detrended SST anomalies,respectively.The red line denotes the linear trend of the IO SST during 1983-2020.
Figure 8 shows that the linear trend of the SST in the tropical IO was 0.11°C per decade during 1983-2020 (Luo et al., 2012).The tropical IO mean SST anomaly in June-July 2020 in total reached 0.58°C, of which nearly 43% (i.e.,0.25°C) is attributed to the multi-decadal warming and 57%(i.e., 0.33°C) to the interannual SST variation.The IO SST anomaly in June-July 2020 becomes moderate after removing the multi-decadal warming trend (blue bars in Fig.8);this indicates that both the multi-decadal warming trend and interannual SST variations in the IO may have contributed to the strong summer precipitation over the MLYRV.
The relative contributions of the multi-decadal warming trend and interannual SST variations in the IO to the strong summer precipitation over the MLYRV were investigated based on two groups of coupled model sensitivity experiments (Table 2, recall section 2).The results suggest that both the multi-decadal warming trend and the interannual variations of SST in the IO excited a strong Subtropical High and anticyclone anomaly in the western North Pacific, and hence induced positive precipitation anomalies over the MLYRV during June-July 2020 (Fig.9).While both the multi-decadal warming trend and the interannual variations of SST in the IO do not appear to have induced statistically significant precipitation anomalies on each grid in the MLYRV, probably due to the complex and nonlinear processes governing the precipitation variations, Figure 9g shows that nearly 57% of the MLYRV area-averaged precipitation anomaly induced by the SST anomalies in the IO was provided by the interannual variation component and 34%of the precipitation anomaly originated from the multidecadal warming trend component.The remaining 9% may be related to the nonlinear responses of the climate system and the MLYRV precipitation to the IO SSTs.These results indicate that impacts of both the interannual SST variations and multi-decadal warming trend in the IO need to be taken into consideration when seeking the underlying causes of the summer precipitation variations over the MLYRV.
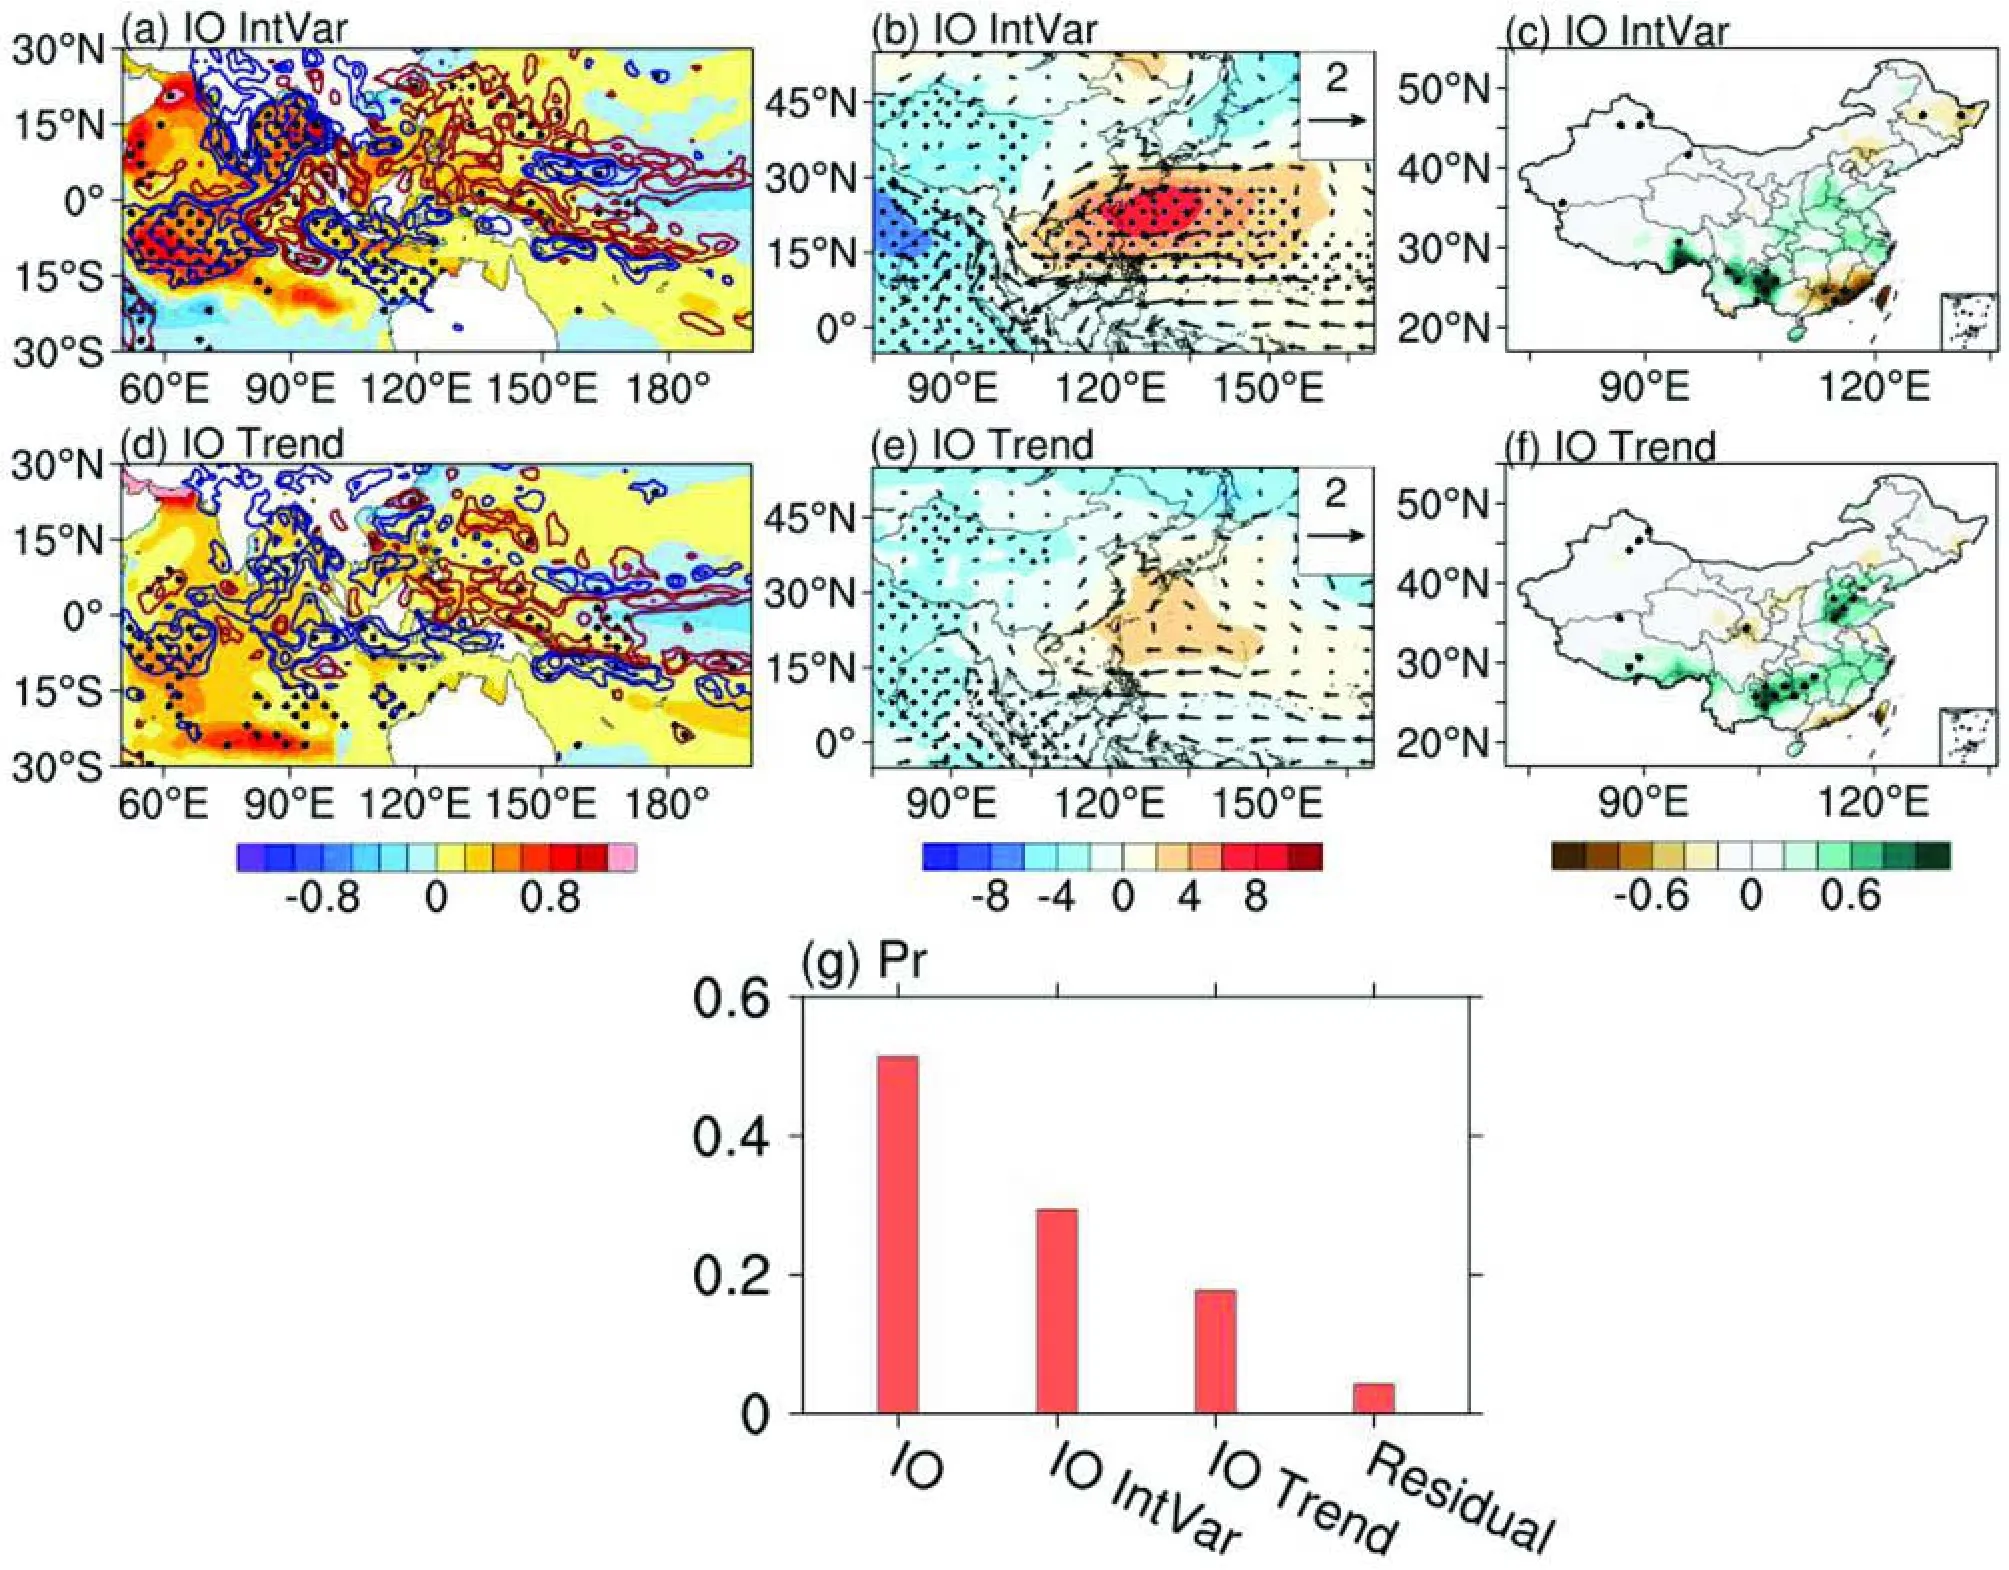
Fig.9.(a-c) and (d-f) as in Fig.6a-c, but for the impacts of the interannual variations of SST and the multi-decadal warming in the IO during June-July 2020.(g) As in Fig.7, but for the MLYRV precipitation anomalies during June-July 2020 induced by the total SST anomalies (IO), interannual variations (IO IntVar) and multi-decadal warming (IO Trend) component in the IO, and residual respectively.
4.3.Skill of NUIST CFS 1.0 in predicting the precipitation anomalies during June-July 2020
The high predictability of the tropical climate (e.g., Luo et al., 2016) and the considerable impacts of the tropical SST anomalies on the summer precipitation over the MLYRV indicate a certain predictability of the MLYRV precipitation.Indeed, real-time forecast of the summer precipitation anomalies over the MLYRV has been a key and important task to operational centers and research institutions in China.For instance, in March every year, the National Climate Center and the Hydrological Information Center of the Ministry of Water Resources have gathered all available forecasts for better predicting the precipitation anomalies in summer.However, among about 20 real-time forecasts of the MLYRV precipitation anomalies in summer of 2020, only a few (including NUIST CFS1.0) realistically predicted a wet condition in June-July 2020.NUIST CFS1.0 has shown excellent skills in predicting the tropical climate in the Indo-Pacific region (Luo et al., 2007, 2008; He et al., 2020).Here, we briefly analyze the real-time ensemble forecasts of the climate anomalies during June-July 2020 based on the NUIST CFS1.0.
Initiated from 1 March 2020, 9-member ensemble mean forecasts of the NUIST CFS1.0 capture reasonably well the spatial distributions of observed precipitation anomalies in June and July 2020 with the centers of positive anomalies located in the MLYRV (cf., Figs.10a-b and Figs.1a-b).However, the intensities of predicted precipitation anomalies are much smaller than that observed in both June and July (Fig.10e).The predicted precipitation anomalies averaged in the MLYRV region are 0.65 mm din June 2020 and 0.64 mm din July 2020, which are merely ~14% of the observed anomalies (i.e., 3.90 mm din June and 5.52 mm din July).This reveals a great challenge to forecasting extreme flooding events.
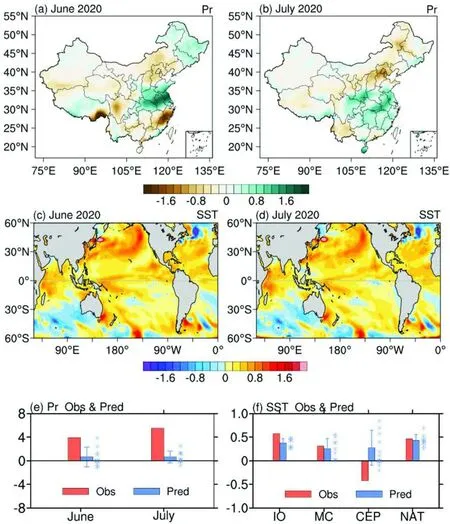
Fig.10.(a-b) Spatial distribution of the precipitation anomalies (mm d-1) in June and July 2020 predicted by the NUIST CFS1.0 initiated from 1 March 2020.(c-d) As in (a-b), but for the predicted SST anomalies (°C).(e) The observed and predicted precipitation anomalies (mm d-1) in June and July 2020 over the MLYRV.(f) The observed and predicted SST anomalies (°C) averaged in June-July 2020 in the four regions marked by A, B, C, D in Fig.2c.The asterisks and error bars in (e-f) represent predictions of individual members and one standard deviation of the 9-member predictions, respectively.
A better prediction of the summer precipitation anomalies over the MLYRV often requires an accurate forecast of the tropical SST anomalies.Figures 10c and d show that NUIST CFS1.0, initiated from 1 March 2020, correctly predicted the warm SST anomalies in the IO, MC, and NAT during June-July 2020.However, the observed cold SST anomalies in the CEP during June-July 2020 were not predicted by NUIST CFS1.0 (Figs.10c-d and f), indicating a difficulty in predicting the fast development of the La Niña in summer 2020.This failure in predicting the cold SST anomalies in the CEP may also have contributed to the underestimation of the strong precipitation in the MLYRV.As shown in Fig.10f, NUIST CFS1.0 displays the best performance in predicting the NAT and MC SST anomalies, with the amplitudes of the 9-member mean predicted SST anomalies in the two regions reaching approximately 91% and 81% of the observed values, respectively.In addition, the predicted SST anomaly in the tropical IO accounts for 66% of the observed anomaly.
The above real-time forecast results based on NUIST CFS1.0 suggest that correct prediction of the warm SST anomalies in the tropical oceans may not be sufficient to accurately predict the amplitude of precipitation anomalies in the MLYRV during June-July 2020.Other factors such as a negative phase of North Atlantic Oscillation, which could enhance the cyclone north of the MLYRV and strengthen the ascending motion over the MLYRV (Liu et al., 2020), may also need to be taken into consideration.In fact, the predicted negative geopotential height anomaly and cyclone anomaly north of the MLYRV were weaker than the observed in July 2020 (not shown).This may also have contributed to the underestimated precipitation in the NUIST CFS1.0 predictions.Tibetan Plateau vortices may also have had a positive impact on the strong precipitation over the MLYRV (Li et al., 2021).Considering the complicated mechanisms responsible for the extreme MLYRV precipitation, certainly more effort and future studies are required to improve our understanding and prediction.
5.Summary and Discussion
5.1.Summary
The extreme floods in the MLYRV during June-July 2020 caused huge socio-economic losses.In this study, we examined the key features of the large-scale atmosphere circulation and tropical SST anomalies that were closely related to the extreme precipitation over the MLYRV in June-July 2020.The relative contributions of the SST anomalies in different tropical oceans to the extreme summer precipitation were explored in particular.
Observational analysis shows that the extreme precipitation over the MLYRV was induced by a strong anomalous anticyclone that persisted over the western North Pacific in June-July 2020, which transported abundant tropical warm moisture northward that converged over the MLYRV.Results based on coupled model sensitivity experiments suggest that the warm SST anomalies in the tropical IO during June-July 2020 may have played a dominant role in enhancing the anticyclone over the western North Pacific and consequently the precipitation over the MLYRV, compared to the contributions of the SST anomalies in other tropical oceans.The June-July averaged IO warm SST anomalies in 2020 reached its highest value in the last 40 years, of which 43% (57%) was attributed to the multi-decadal warming trend (interannual variations).Additional coupled model experimental results indicate that both the multi-decadal warming trend and interannual variation components of the warm IO SST anomalies in June-July 2020 may have made a positive contribution to the strong precipitation over the MLYRV.It should be noted that the warm SST anomalies in the NAT during June-July 2020, despite its remote distance from China, may also have helped strengthen the anticyclone over the western North Pacific and the MLYRV precipitation via inducing strong positive precipitation anomalies in the tropical IO.Our results also show that the extreme precipitation condition over the MLYRV during June-July 2020 was predicted but much underestimated by NUIST CFS1.0 initialized from 1 March 2020, partly in association with its successful forecast of the warm SST anomalies in the tropics.
5.2.Discussion
The IO SST anomalies in summer have a significant impact on precipitation over the MLYRV by inducing an anomalous anticyclone in the western North Pacific.Therefore, better understanding and prediction of the IO SST anomalies in summer are crucial to improve the prediction of summer precipitation over the MLYRV.Usually, in response to an El Niño in the previous winter, a basin-wide warming in the tropical IO occurs in the following spring and persists into summer (Yang et al., 2007; Xie et al., 2009).Figure S5 in the ESM shows that the IO SST anomaly in summer is significantly correlated with the Niño-3.4 (5°N-5°S, 190°-240°E) SST anomaly in the previous winter.However, the deviations from this linear relationship can be large in some years, especially in 2019/20.The correlation coefficient between the ENSO and IO SST anomalies becomes larger after removing the IO multi-decadal warming trend.Based on this linear correlation (r=0.73), the Niño-3.4 SST anomaly in the previous winter can only explain about one-half of the IO SST variance in the following summer.This suggests that other factors may also play a role in the interannual variations of the IO SST.For instance, Zhou et al.(2021) suggested that the strong IO warm SST anomaly in summer 2020 might originate from the extremely strong positive IOD event in 2019, which was not entirely driven by the moderate central Pacific-type of El Niño in 2019 (Lu and Ren, 2020).In addition, the SST anomalies in the Atlantic Ocean may also play a role in the occurrence of the strong warm SST anomalies in the IO during June-July 2020(recall Figs.6j-l).
Previous model experiment studies suggested that the cold SST anomalies in the CEP played a role in strengthening the anticyclone over the western North Pacific in summer (e.g., Wang et al., 2013; Chen et al., 2016), and hence might contribute to the strong summer precipitation over the MLYRV.However, Fig.3 shows that the June-July precipitation anomalies over the MLYRV are not significantly correlated to the SST anomalies in the CEP during the period of 1983-2020.This seems to be at odds with the previous results.To further explore this issue, we calculated the correlations between the June-July precipitation anomalies over the MLYRV and the tropical SST anomalies during 1983-2020 after linearly removing the influence of the IO SST anomalies on the two fields (Fig.S6 in the ESM, see also Johnson et al., 2019).The result reveals a significant negative relation in the CEP (Cor=-0.35 between the residual precipitation time series and the residual SST anomalies averaged over 5°N-5°S, 160°E-130°W).This suggests that the cold SST anomalies in the CEP do positively contribute to the strong precipitation over the MLYRV in summer, but its contribution appears to be rather small, consistent with the coupled model sensitivity experiment results (recall Figs.6g-i).
Acknowledgements.This work is supported by National Natural Science Foundation of China (Grant No.42030605 and 42088101) and National Key R&D Program of China (Grant No.2020YFA0608004).The model simulation was conducted in the High Performance Computing Center of Nanjing University of Information Science & Technology.The OISST is downloaded from https://www.ncdc.noaa.gov/oisst/data-access website.CMAP precipitation data and NCEP—NCAR Reanalysis-1 data provided by the NOAA/OAR/ESRL PSL, Boulder, Colorado, USA, are downloaded from the website at https://psl.noaa.gov/.
Electronic supplementary material: Supplementary material is available in the online version of this article at https://doi.org/10.1007/s00376-021-1036-8.
杂志排行
Advances in Atmospheric Sciences的其它文章
- Why Does Extreme Rainfall Occur in Central China during the Summer of 2020 after a Weak El Niño?※
- Electronic Supplementary Material to:The Anomalous Mei-yu Rainfall of Summer 2020 from a Circulation Clustering Perspective: Current and Possible Future Prevalence*
- The Seasonal Prediction of the Exceptional Yangtze River Rainfall in Summer 2020※
- The Record-breaking Mei-yu in 2020 and Associated Atmospheric Circulation and Tropical SST Anomalies※
- Cause of Extreme Heavy and Persistent Rainfall over Yangtze River in Summer 2020※
- The Anomalous Mei-yu Rainfall of Summer 2020 from a Circulation Clustering Perspective: Current and Possible Future Prevalence※
