Research on the ions’axial temperature of a sympathetically-cooled 113Cd+ion crystal∗
2021-11-23NongChaoXin辛弄潮ShengNanMiao苗胜楠HaoRanQin秦浩然LiMingGuo郭黎明JiZeHan韩济泽HuaXingHu胡华星WenXinShi施文心JianWeiZhang张建伟andLiJunWang王力军
Nong-Chao Xin(辛弄潮) Sheng-Nan Miao(苗胜楠) Hao-Ran Qin(秦浩然)Li-Ming Guo(郭黎明) Ji-Ze Han(韩济泽) Hua-Xing Hu(胡华星)Wen-Xin Shi(施文心) Jian-Wei Zhang(张建伟) and Li-Jun Wang(王力军)
1State Key Laboratory of Precision Measurement Technology and Instruments,Department of Precision Instruments,Tsinghua University,Beijing 100084,China
2Department of Physics,Tsinghua University,Beijing 100084,China
Keywords: ion temperature,sympathetic cooling,electric parameters,microwave clock
1. Introduction
Trapping and cooling ion technique plays an important role in precision measurement field, including but not limited to frequency standards, quantum information processing, and chemical reactions. This technique is employed to acquire long-term, stable, and cold (milli-Kelvin) ion crystal. Especially, frequency standards based on ion traps and Doppler laser cooling technology demonstrate great potential in the application of time-keeping,[1]space navigation,[2,3]and deep-space exploration.[4]Among the ion cooling techniques,sympathetic cooling technology is a technique that indirectly cools another type of particles on the basis of laser cooling of one type of particles.[5,6]Therefore,the transition spectrum of atoms, ions, and molecules cooled by sympathetic cooling technology can be measured more accurately. Because only the coolant particles should be cooled by laser,the particles of similar mass can be effectively cooled through the interaction between the particles. The sympathetic-cooling technology is effective for almost all particles, and significantly important in the precise measurement of particle spectrum and the study of particle properties.[7,8]Through sympathetic cooling technique, microwave clock based on sympathetically-cooled113Cd+ions[9]has been proven to be conducive to overcoming limits, including Dick effect and second-order Doppler frequency shift(SODFS),which result from the dead time of laser cooling process and rise in temperature during the clock interrogation,respectively.[10,11]
Study has revealed that for the sympathetically-cooled ion crystal,trapped in the linear Paul trap,there exists a complex relationship between the electric parameters,including RF(radio frequency)voltage and end-cap voltage,and the temperature of ions.[9]To study the sympathetic cooling efficiency and the ion crystal temperature, we constructed an MD (molecular dynamics) simulation model of a sympathetically-cooled113Cd+ion crystal, in which40Ca+ions were used as the coolant to sympathetically cool a large113Cd+cloud. Furthermore, both types of ions are trapped in a linear Paul trap.By applying MD simulation,detailed information of any particular ion, including but not limited to ions’velocity and location distribution,temperature,and evolution of secular motion together with micro-motion can be acquired reasonably and accurately.[12,13]After defining some parameters,such as ions’ mass-to-charge ration, ions’ quantity and potential applied on trap ions,the process of ion generating,trapping and sympathetic cooling can be simulated properly. Moreover,the pseudo-potential approximation model[14]is adopted to define motion modes of ions, and it clearly explains spatial configuration transformation and temporal evolution of the simulated three-dimensional(3D)sympathetically-cooled ion system under different voltages.
For the ion crystal system we built, the optimum radio frequency(RF)voltage amplitude(about 260 V),corresponding to minimum temperature,was discovered. Before the optimum RF voltage,ions’axial temperature is negatively correlated with the RF voltage. While after the optimum RF voltage, ions’ axial temperature experiences a steady escalation with the increasing of RF voltage. The axial temperature is positively correlated with the end-cap voltage. The change trends of ion temperature vs. the RF voltage and the endcap voltage are consistent with the experimental results. We further proposed a simple method to estimate the axial temperature trend while tuning the voltages by a key index (see in Eq.(9)),which is determined by secular motion amplitude,average position,andqx,y(defined in Eq.(3)).
2. MD simulation and verifications
2.1. MD simulation model

whereΩis the frequency of RF voltage andκis the axial equivalent geometric factor, decided by the geometry of the trap and distance between two endcapsz0. In our experiment,COMSOL software is used to construct the trap model. By setting different voltages,we fitted the corresponding trap potential,and then obtained theκcoefficient by fitting analysis.κwas set to 0.049.
The random collision forceFistochastic(Ref. [15]) and the laser forceFilaser(Ref. [12]) have already been described at Ref.[10].The evolution process uses the Leapfrog algorithm,[1,16,17]which is a second-order stable and time reversible algorithm. In addition,the choice of time step is critical in molecular dynamics simulation;it is appropriate to include dozens to one hundred time steps in an RF cycle. The time step of the model built in this article is selected as 5 ns,1/100 of the RF cycle,and it ensures the stability of the algorithm and simultaneously guarantees the accuracy of the calculation. The time step can be changed artificially in the simulation program.
The cardinal parameters of the simulated linear Paul trap are depicted in Fig.1.[19]Our trap is composed of four threesection cylindrical copper electrodes. The diameter of each electrode is 14.2 mm, and the shortest distance between the electrodes and the ion trap center is 6.2 mm.To trap ions in the axial direction, the end-cap voltage(Uend, direct current voltage) is applied on the adjacent section (A and C parts) of all electrodes. Meanwhile,to achieve confinement of ions in the radial direction, RF voltage (Urf=(Vrf/2)cosΩt), frequency fixed at 2.06 MHz,is assigned to the central section(B part)of electrodes 2 and 4,and the central section of electrodes 1 and 3 is well grounded. The adjustment range of amplitude of RF voltage is 150 V-500 V,and the output amplitude of end-cap voltage can be varied from 0 V to 100 V.The cooling laser and the probe laser are shined on ions in the direction of the axial of trap.Thus,axial temperature of the ion cloud is investigated in the following analysis.
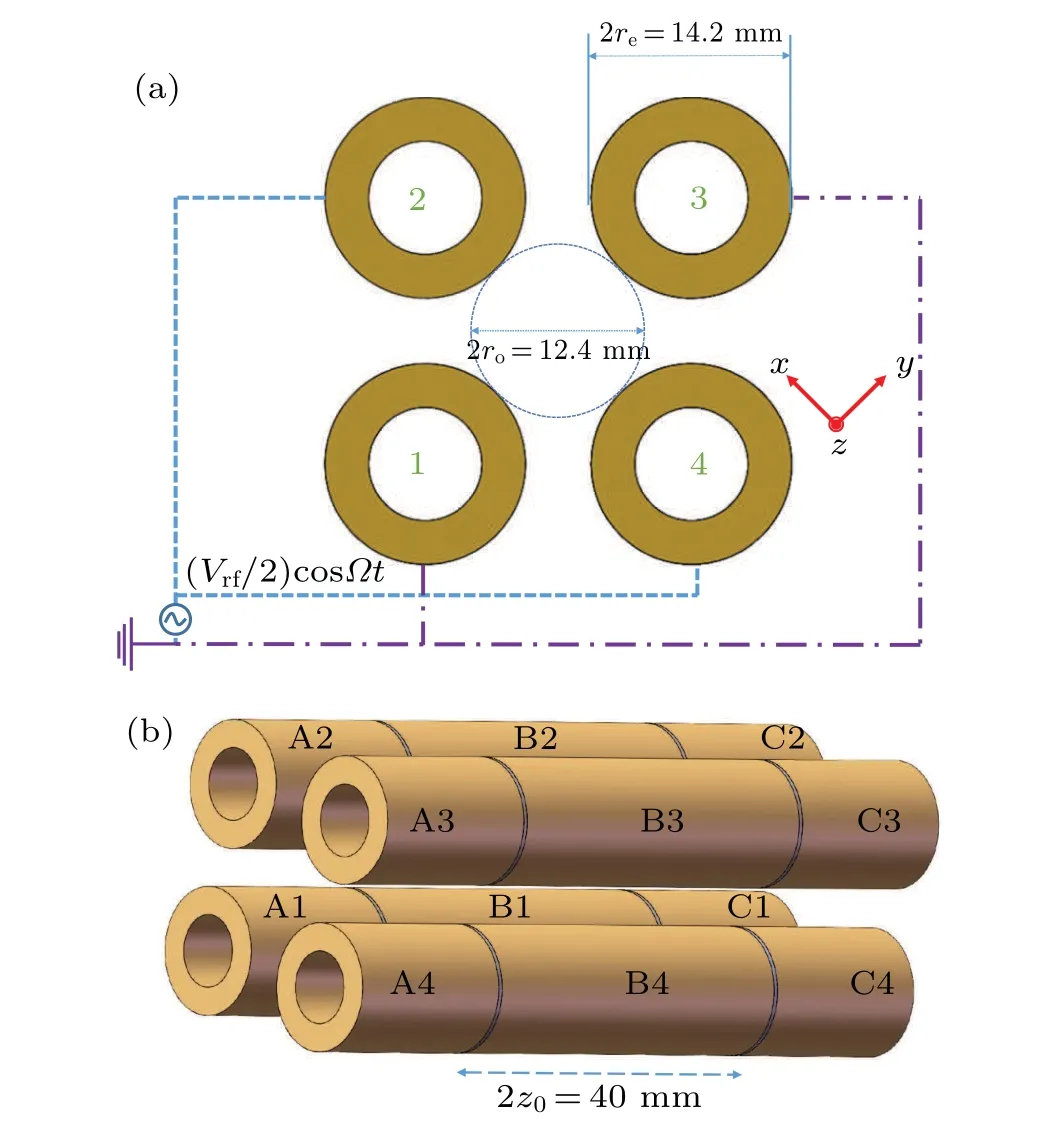
Fig. 1. Sketch of linear Paul trap: (a) axial view and (b) side view. The origin of z axis of our coordinate is centered between endcaps.
2.2. Verifications
Before the investigation,our simulation program was validated by comparing the simulated results to the analytic and experimental results. These tests allows detection if modifications introduce errors;thus,ensuring correctness of the further illustrations.
By using pseudo-potential approximation, motion of a single ion can be depicted as[20,21]

In radial direction, the motion of one single ion is separated into a secular motion at frequencyωi,i=x,yand a swift‘micromotion’at frequencyΩ. In axial direction,the single ion only oscillates at frequencyωz.
Apparently,these frequencies depend on end-cap and RF voltages. Motion of one ion is simulated by our program,and the oscillation frequencies are extracted along each axis, as demonstrated in Fig. 2(a), which validates the correctness of end-cap and RF voltages.

Fig. 2. (a) Oscillation frequencies extracted from simulation of one single ion. The frequencies are all from the Fourier component with the largest amplitude. (b)Relationship between minimum separation of ions and Uend.The number of ions is 64.
Moreover, when the number of ions is sufficiently small that all ions are aligned through thezaxis, the distance betweenNions(quantity of electric charge of each ion isQandmis the ion mass)will increase away from the center ofzaxis.The minimum separation between ions is expressed as[22]

Figure 2(b)shows the minimum simulated separation and the value predicted by theory. Because the simulated ions experience forces,including the voltage confinement alongzaxis and the Coulomb force from the other ions,simulation of the minimum separation of ions tests the realization of both the Coulomb force and voltage confinement.
The forces experienced by ions decide the spatial configuration of ion crystal. In our experiment, an explicit ion crystal picture of Ca+was obtained by an EMCCD(electronmultiplying charge coupled device). Under our experimental settings, we estimated the number of ions based on the size of the ion cloud,[23]and after repeated release of trapped ions, we selected the experimental results of approximately 1.9(0.5)×104Ca+ions as the correctness verification of the simulation model. The corresponding ion number was calculated as 1.9(0.5)×104. Figure 3 shows pictures of ion crystal obtained from the experiment and simulation, verifying that our simulation results are consistent with the real experimental results.

Fig.3. Ca+ ion crystal obtained from experiment and simulation at different RF voltages and end-cap voltages. (a)Vrf=400 V.(b)Vrf=240 V.The number of Ca+ is 1.9(0.5)×104.
3. Relationship between ions’ temperature and electric parameters
3.1. Simulation results
As shown in Fig.4,increasement of RF and end-cap voltages change the spatial configuration of ion crystal. Typically,increasing RF voltage and end-cap voltage lead to substantial compression and extension on the radial distribution of the ion system, respectively. Because the effect of laser force is significant,[24-26]during the simulation process,the laser force is set as a constant value,verified by Subsection 2.2.

Fig. 4. Spatial configuration of ion crystal obtained from simulation. (a)Spatial configuration of ion crystal cloud changes with end-cap voltage at Vrf =520 V.(b)Spatial configuration of ion crystal cloud changes with RF voltage at Uend =10 V. Red dots represent the ions of Ca+ and green dots represent the ions of Cd+. The ion numbers of Ca+ and Cd+ are 192 and 960,respectively.
Note that although reducing the end-cap voltage will lead to the decline of ion temperature,considering the actual situation that the ions should be stably trapped,the end-cap voltage should have a lower limit. In our previous sympathetic cooling experiment,[27]we found that when the end-cap voltage is lower than 10 V, the ion loss rate increases; thus, we usually set the end-cap voltage above 10 V. The specific lower limit of the end-cap voltage is related to the specific trap parameters,vacuum degree,laser parameters,and other experimental conditions.
Theoretically, the temperature of the ions in the thermal equilibrium state affected by the voltages can be explained by the RF heating effect.[21,28,29]The RF heating effect is correlated with the oscillation amplitude and frequency of the ions. Through the image obtained from the simulation (see in Fig.4),it can be observed that when the end-cap voltage increases and the RF voltage decreases,more ions are arranged outside the central axis, which means that oscillation amplitude is amplified. Further, it is verified that the frequency of the motion is affected by the voltages. When the oscillation amplitude and the movement frequency both affected by the voltages, the specific changes of the ion temperature need to be discussed in detail. In Subsection 3.2,motion equation under the pseudo-potential model is applied to provide a more reasonable and clear explanation.
Figure 5 demonstrates the specific ions’axial temperature at different RF voltage and end-cap voltage. According to the simulation results, the optimum RF voltage corresponding to the lowest temperature is approximately 520 V. Still, before the optimum RF voltage, the temperature decreases with the increasement of RF voltage, and after the optimum voltage,the temperature increases with the increasing of RF voltage.Furthermore, the end-cap voltage and temperature are positively correlated.

Fig. 5. Temperature from simulation: (a) axial temperature at different end-cap voltages with Vrf =320 V; (b) axial temperature at different end-cap voltages with Vrf =520 V; (c) axial temperature at different end-cap voltages with Vrf =720 V; (d) axial temperature at different RF voltages with Uend=10 V;(e)axial temperature at different RF voltages with Uend=50 V;(f)axial temperature at different RF voltages with Uend=90 V.The ion numbers of 40Ca+ and 113Cd+ are 192 and 960,respectively.
3.2. Energy and temperature
The motion of one single ion can be well expressed by Eq. (3). When considering large-scale ion cloud trapping,modifications and assumptions should be mentioned. Owing to the Coulomb force, more ions will distribute around the z axis. Average position of ions are placed to (r1x,r1y,r1z),which causes ‘excess micro-motion’.[21]Thus the motion of ions is modified as

To illustrate the energy change of ion cloud clearly, it is better to first fully describe the ion motion modes. According to Eq. (5), the one-dimensional motion of the ions can be mainly described by the superposition of the secular motion and the micro-motion. However,considering that the ions move in three-dimensional(3D)space,the movement of ions in the 3D direction will be coupled with each other, resulting in more complicated ion movement patterns. Therefore,although the motion modes of ions become complex due to mutual coupling, they are result of combined secular motion and micro-motion. By calculating the kinetic energy of the ions in the micro-motion and secular motion modes,the overall energy of the ions can be reflected. In addition,due to the high coupling of ion motion modes,the energies of ions in the three degrees of freedom are positively correlated. Therefore,we can use the motion equation of the ion in one direction to estimate the total energy of the ion in the complex motion within the three-dimensional space.
For a 3D ion system,interaction among ions leads to motion and energy coupling under different dimensions. Thus,it is assumed that ions’ triaxial energy is in the same order of magnitude and positively correlated:

Furthermore, according to our simulation, ions’ axial micro-motion mainly results from motion coupling among different dimensions and is less affected by the RF driving field,while ions’radial motion is a direct superposition of the micromotion and secular motion.[30]To analyze the energy and temperature evolution of the ions more comprehensively,we used the axial motion equation of the ions,obtained from the equivalent harmonic pseudo-potential approximation, to figure out the energy and temperature of ions in the 3D sympatheticallycooled ion system.
Averaged over a period of secular motion,the kinetic energy of ions inxdirection can be obtained as[21]


where the number of ions isN,r1xiis the average position ofi-th ion alongxdirection, indicating the deviation of ions towards the central axis.
By using Eq.(9),the evolution process of sympathetically cooled ions’temperature and energy under different voltages,portrayed by Fig.5,can be distinctly described:
According to Eq. (9), energy and temperature of ions in a 3D ion sympathetic cooling system are positively correlated with the amplitude of secular motion,average position of ions andqx,y. On the one hand, by increasing the RF voltage, the spatial configuration is compressed, indicating the decline of secular motion amplitude and average position value. Thus,increasingqx,y(determined by increasing RF voltage)and decreasing secular motion amplitude together with average position value imply the minimum ion energy and temperature at a certain RF voltage. On the other hand, because increasing end-cap voltage amplifies the secular motion amplitude and average position,while have slight influence onqx,y,[20]ions’temperature and energy are reasonably positively correlated with the end-cap voltage.
Moreover, it is assumed that ion crystal configuration is determined by all ions’ motion amplitude and average position.Thus,the configuration can microscopically represent the average of square of the secular motion amplitude and average position. In this study,we chose the maximum radial width of ion crystal as the cardinal parameter of the ion crystal configuration. Thereafter,the axial temperature was microscopically evaluated by a new indexu:

whereRscrepresents the maximum radial width of sympathetically cooling ion crystal(Cd+)in our simulation.
The dimension of indexuis square of meter. It contains important information that affect ions energy, including electric parameters and oscillation amplitude.It reflects the energy and spatial configuration change under different voltages. Under a specific ion crystal trapped in linear Paul trap,it helps to estimate relative temperature value conveniently and quickly.Further,it allows us to measureRscand determine correspondinguthrough the simulation output. The exact calculation results are depicted as follows:

Fig. 6. Index to evaluate temperature of sympathetic cooling ions. (a)Temperature from simulation and the index at different RF voltages with Uend =10 V. (b) Temperature from simulation and the index at different end-cap voltages with Vrf=520 V.The number of ions is the same as that in Fig.4.Discontinuous point data around 620 V are a phenomenon of random fluctuations of macroscopic physical quantities. Under the thermal equilibrium state,the macroscopic physical quantities of ions such as temperature,velocity,and energy,should own certain degree of random fluctuations.This type of random fluctuation becomes more significant when the voltage parameter changes slightly.
The temperature change trend reflected by the indexuis consistent with the simulation results, especially when the temperature reaches at a minimum withVrf=520 V.
Though the temperature evolution process,as discovered and illustrated by MD simulation and pseudo-potential model,we confirmed the RF optimum voltage(around 520 V)through a sympathetically-cooled113Cd+ion microwave clock(shown in Fig.7).[26]
Detailed experimental setup and temperature measurement method can be found in Ref. [27]. The temperature evolution processes are experimentally measured by evaluating the Doppler broadening owing to ion motion of the 5p2P3/2F=2,mF=2→5s2S3/2F=1,mF=1 transition. At the published studies, we estimated the loss of ions based on the intensity of the fluorescence radiation of the ions. The fitted fluorescence decay curve is an exponential decay curve,and the time constant is approximately 84 h. Thus, it is reasonable to assume that the number of ions remains unchanged within 1 hour,and the experimental error caused by the loss of ions can be ignored.[27]

Fig.7. Influence of electric parameters on ions’axial temperature. (a)Corresponding temperature at different RF voltages with Uend=10 V.(b)Corresponding temperature at different end-cap voltages with Vrf=520 V.The temperature data of 40Ca+ and 113Cd+ ion crystals under sympathetic cooling situation are adopted from Ref.[26].
Though the changing trend obtained from simulation and experiment is consistent, some details are slightly different.We believe that the main reasons for the inconsistency of the simulation results,experimental results,and theoretical calculation results are as follows:
(i) In the experiment, the potential of the ion trap is not a perfect quadruple potential, which will cause additional RF heating.
(ii)The number of ions in the experiment is significantly higher than the simulation calculation. It is believed that even under the same electrical parameters,the ion cloud size formed by different numbers of ions changes notably.Increasing number of ions leads to expansion of the ion cloud,which implies an intensified RF heating. Thus, the temperature measured through the experiment is much higher than that of the simulation.
(iii)Theoretical calculation of the relative temperature of the ion requires the identification of the specific size of the ion cloud. Although the ion cloud image captured by the EMCCD and obtained by the simulation result are notably clear, there are still errors in determining the size of the ion cloud.
The sympathetic cooling system simulated in this study is aimed at the sympathetic cooling of metal ions,and distinguished with sympathetic cooling system of highly charged ions, atoms, and molecular ions. For metal ions of different masses, although their spatial configuration is different, their motion modes are still superposition of micro-motion and secular motion. Then the influencing factors of ions’ energy in the linear trap should be consistent. The indexuprovides us a convenient method to estimate the ions’temperature changing trend in experiment, which avoids scanning probe laser frequency to measure the Doppler broadening of a transition.
4. Conclusion
In this paper,we simulated a sympathetically-cooled ion system. The MD simulation results offered detailed information of any given ion at a certain time, based on which axial temperature of the ion crystal under different voltages was calculated.
Using the pseudo-potential approximation model, key factors, composed of secular motion amplitude, average position andqx,y, affecting ions’ temperature and energy were elaborated. RF and end-cap voltages were found to have influence on these factors and can change the ions’axial temperature accordingly.
Based on the key factors,indexu,a square of the product ofqandRsc, is able to help us determine ions’ temperature relatively and quickly. The temperature change, indicated by the index,is consistent with the simulation result,and both are verified by experimental data.
Though our work is limited by the number of simulated ions and applicable scope of the pseudo-potential approximation model,the result is still helpful for ion temperature measurement, sympathetic ion cooling efficiency improvement,and ion spatial configuration control.
杂志排行

Chinese Physics B的其它文章
- Erratum to“Floquet bands and photon-induced topological edge states of graphene nanoribbons”
- Viewing the noise propagation mechanism in a unidirectional transition cascade from the perspective of stability*
- Nonlinear signal transduction network with multistate*
- Optical strong coupling in hybrid metal-graphene metamaterial for terahertz sensing*
- Any-polar resistive switching behavior in Ti-intercalated Pt/Ti/HfO2/Ti/Pt device*
- Magnetic two-dimensional van der Waals materials for spintronic devices*