Quantitative kinetic analysis on oxygen reduction reaction:A perspective
2021-11-16JuanWangChangXinZhaoJiaNingLiuDingRenBoQuanLiJiaQiHuangQiangZhang
Juan Wang,Chang-Xin Zhao,Jia-Ning Liu,Ding Ren,Bo-Quan Li,**,Jia-Qi Huang,*,Qiang Zhang,***
a School of Materials Science and Engineering,Beijing Institute of Technology,Beijing,100081,China
b Advanced Research Institute of Multidisciplinary Science,Beijing Institute of Technology,Beijing,100081,China
c Beijing Key Laboratory of Green Chemical Reaction Engineering and Technology,Department of Chemical Engineering,Tsinghua University,Beijing,100084,China
Keywords:Oxygen reduction reaction Electrocatalysis Quantitative kinetic analysis Koutecky–Levich equation Mass transfer
ABSTRACT
1.Introduction
With the increasing global concern on energy and environmental disruption,clean and sustainable energy storage devices,represented by metal–air batteries and fuel cells,have drawn great attention because of their sustainability and environmental friendliness[1–4].Such energy storage devices involve an oxygen reduction reaction(ORR)within their cathode side during discharging.ORR is a multi-electron and multi-phase electrochemical process and is highly sluggish in its kinetics,leading to reduced energy efficiency and limited energy output under working conditions[5–7].Therefore,high-active ORR electrocatalysts are necessary to enhance electrochemical performance[8–10].
In developing high-performance ORR electrocatalysts,establishing systematic test systems and using scientific evaluation methods are of great significance[11–13].Electrocatalytic ORR involves multiple as well as mutually coupled processes regarding surface reaction and mass transfer[14].Specifically,surface reaction corresponds to electron transfer,where the adsorbed oxygen reactants are reduced to water or hydroxide anion products at the active surface of electrocatalysts.The efficiency of surface reaction is directly associated with the intrinsic activity of the ORR electrocatalysts.The mass transfer process involves transport of the reactants and products between the bulk electrolyte and the electrocatalyst surface to support continuous electrochemical reaction.Both the above-mentioned processes are highly associated with ORR performance[15–18].Therefore,intrinsic ORR activity and mass transfer capability should be equally emphasized as two main factors when evaluating the electrocatalytic performance of ORR electrocatalysts[19,20].
Experimentally,linear sweep voltammetry(LSV)on a rotating disk electrode controlled by a three-electrode system is generally used to evaluate ORR performance[21].Half-wave potential(E1/2),the potential to reach half of the limiting current density obtained from the LSV curve,is a widely accepted indicator for evaluating this ORR performance.Higher E1/2corresponds to lower overpotential to reach the specific current density and is equivalent to higher ORR performance.Although the E1/2indicator is simple and effective,it fails to decouple the two factors regarding intrinsic activity and mass transfer capability and is therefore insufficient for guiding in-depth understanding and rational design of advanced ORR electrocatalysts[19–23].To this end,in-depth quantitative kinetic analysis to decouple the factors is a significant step in constructing a new research paradigm on the investigation of ORR electrocatalysis for both fundamental scientific research and practical application.
Herein a quantitative kinetic analysis method is proposed to afford decoupled kinetic information from linear sweep voltammetry curves based on the Koutecky–Levich(K–L)equation.Independent parameters regarding exchange current density,electron transfer number,and electrochemical active surface area can be respectively determined following the proposed method.The inherent parameters of the electrocatalysts can be quantitatively acquired beyond the half-wave potential indicator to guide directional performance enhancement.In addition,the proposed method deepens understanding of ORR electrocatalysis in a fundamental manner and is expected to shed light on other essential heterogeneous electrocatalytic processes.
2.Results and discussion
Experimentally,performance evaluation of ORR electrocatalysts is mainly based on a three-electrode system[24].A rotating disk electrode(RDE)is used as the working electrode[25].Under continuous rotation of the working electrode,a stable velocity field of the electrolyte fluid is established to provide forced convection with a well-defined diffusion boundary layer.The LSV test is performed on the three-electrode system,where the current density is recorded as a function of the applied voltage on the working electrode.
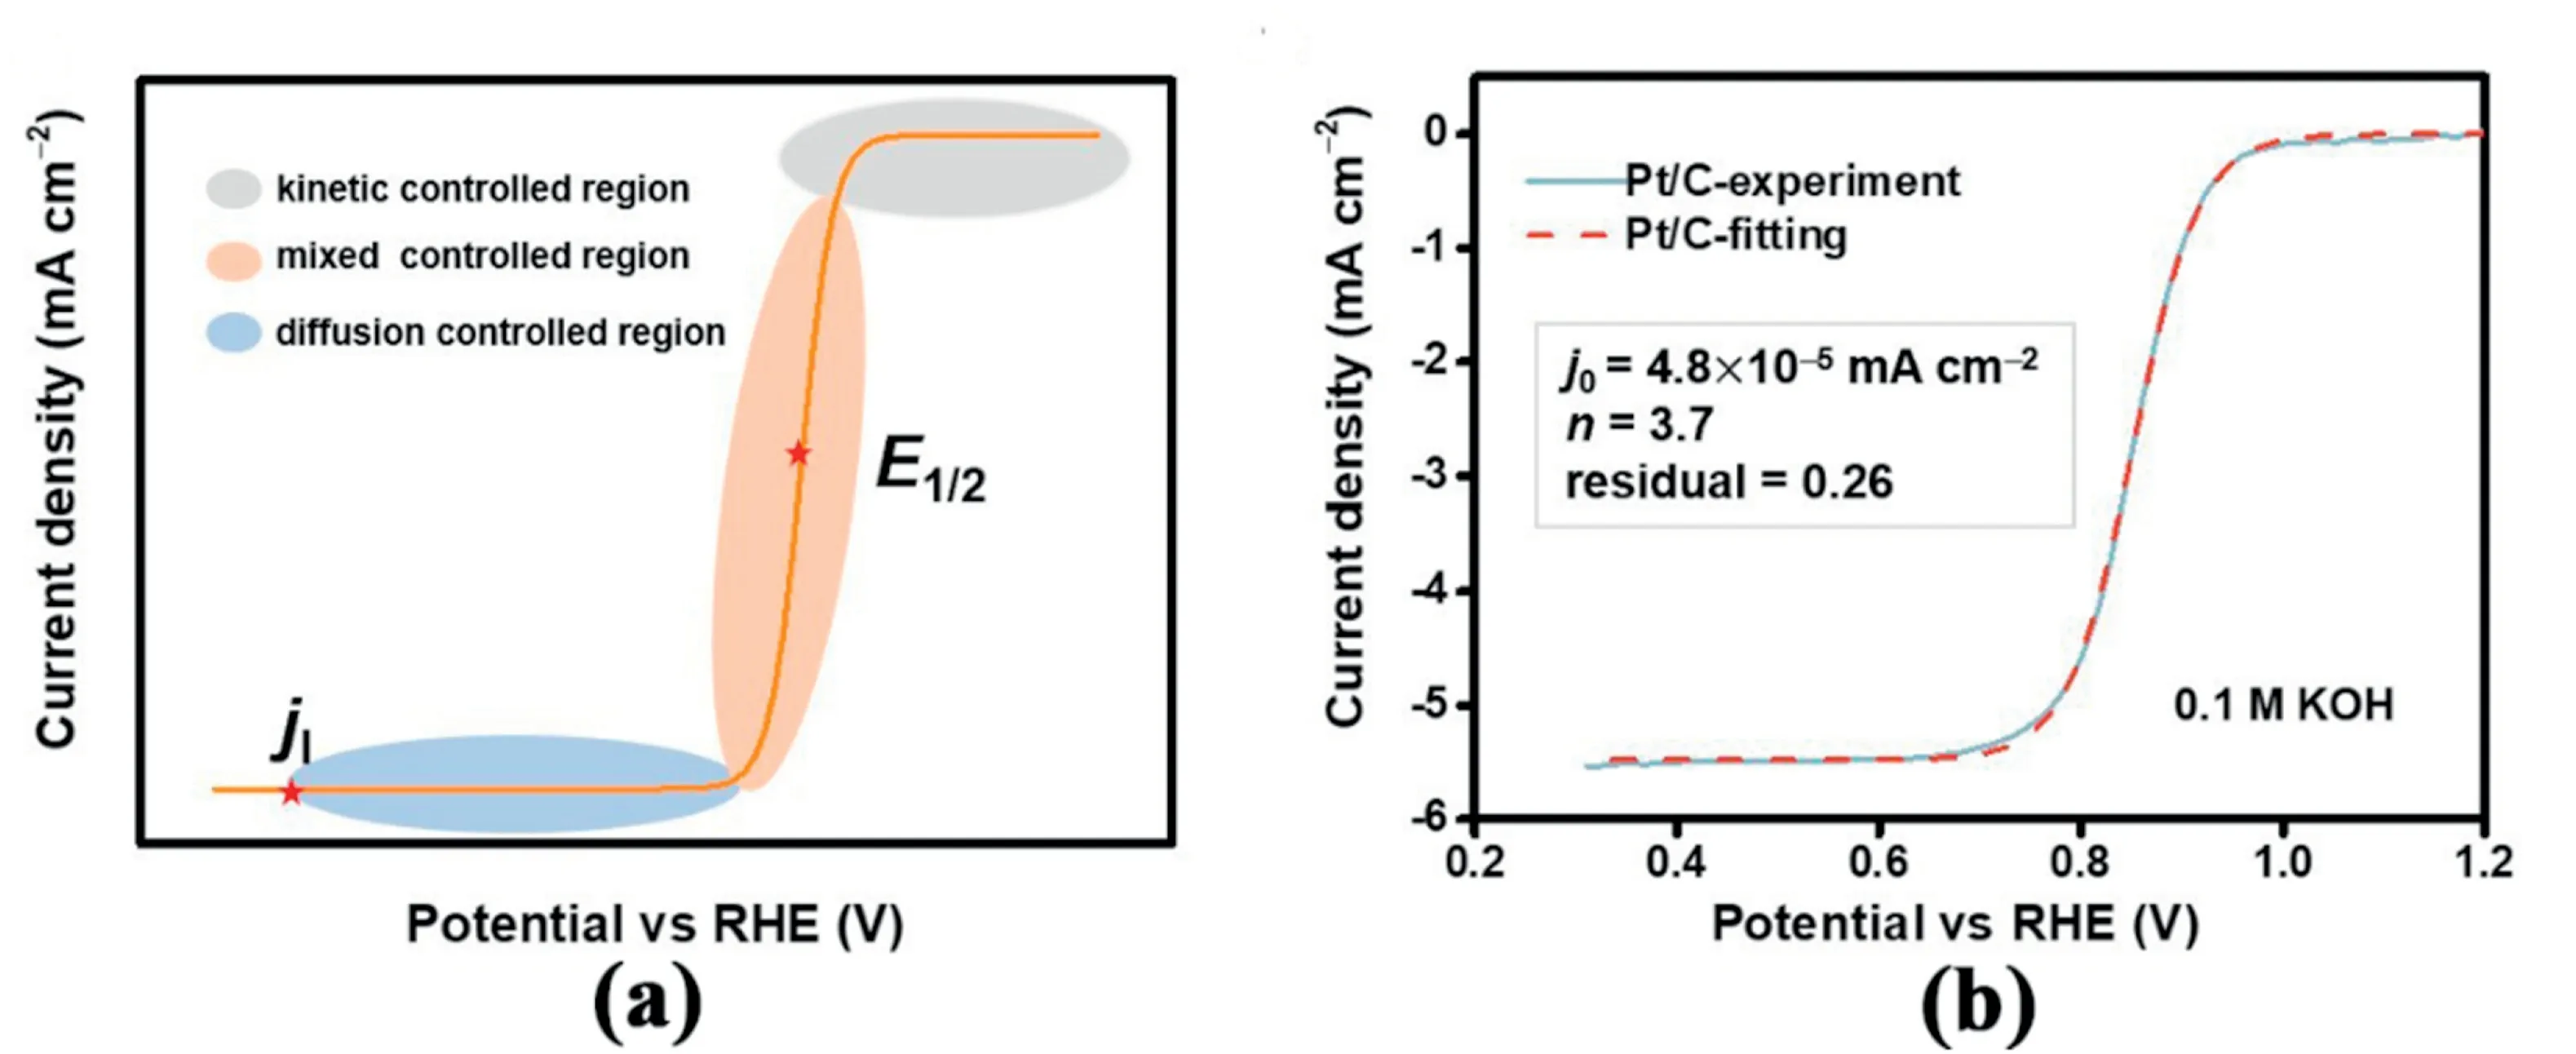
As shown in Fig.1a,the LSV curve is intuitively“S-shaped”.Generally,the LSV curve can be divided into three regions and each part corresponds to an electrocatalytic process dominated by different factors[26].Specifically,in the high-potential gray area,the overpotential is insufficient to cross the reaction barrier to effect substantial electrochemical reactions.Therefore,within such a potential range,the surface reaction kinetics serve as the limiting factor on overall electrocatalytic performance,and this is called the surface reaction-controlled region.In the low-potential blue region,the potential deviates far enough from the equilibrium potential.The reaction rate of dissolved oxygen on the electrode is so fast that the dissolution and diffusion of oxygen become the limitation and the current remains almost unchanged with increased overpotential,and this is thus called the diffusion-controlled region.Between these two regions,ORR is co-dominated by surface reaction and mass diffusion shown as the orange region and called the mixed controlled region.The E1/2in the mixed controlled region is generally employed to evaluate the activity of the electrocatalyst and therefore simultaneously reflects the coupling behavior of surface reaction and mass diffusion[27].
From the perspective of basic electrochemistry,the establishment of a well-defined mathematical model is helpful in better understanding the coupled ORR process and provide theoretical guidance.The equations corresponding to the two model limiting situations are first provided.Specifically,under infinite fast mass transfer capability and slow surface reaction kinetics,the polarization dominantly originates from kinetic polarization and the relationship between current density and overpotential can be described using the Butler–Volmer(B–V)equation(Equation(1)).With very fast surface reaction kinetics and the mass transfer obstacle,the concentration polarization contributes to the main electrode polarization and the apparent electrochemical reaction rate is determined by the mass transfer capability described using the Levich(L)equation(Equation(2)).

For the B–V equation,jkand j0represent the kinetic current density and exchange current density,respectively.η is the overpotential,α is exchange coefficient,F is the Faraday constant(F=96485C mol-1),n is the electron transfer number,and R is the molar gas constant.For the L equation,ilis the limiting current,C0is the bulk concentration of saturated O2in electrolyte(1.2×10⁻³mol L-1),D is the diffusion coefficient of O2(1.9×10⁻⁵cm2s-1),μ is the kinematic viscosity of the electrolyte(0.01cm2s-1),and A is the active surface area and here it is assumed to be the geometric area.Notably,currents can be transformed to current densities by dividing by the active surface area.Also,the above values are determined at25°C and will be accordingly changed at other evaluation temperatures.
The ORR process is actually co-affected by surface reaction and mass transfer,which can be described via the K–L equation(Equation(3)).As is intuitively exhibited in the K–L equation,jkand jlare integrated to comprehensively describe ORR regarding coupled factors of surface reaction and mass transfer.


Fig.1.(a)Schematic illustration of the ORR LSV curve.(b)Experimental and fitting ORR LSV curves for Pt/C.j0and n are simulated accordingly.
To interpret experimental data from a theoretical perspective,the K–L equation lays the theoretical foundation of LSV measurements and affords an explanation for the‘S’-shaped LSV curves[28,29].From the perspective of tracing the theoretical roots of the experimental data,fitting the experimental LSV curves is expected to obtain key parameters in the K–L equation.These are very helpful in decoupling the key factors in terms of surface reaction and mass transfer.That is,based on the K–L equation and the necessary data processing,one can acquire the intrinsic performance indices of the electrocatalysts via mathematical fitting on the LSV curves.
To demonstrate the feasibility of decoupling influential factors via LSV fitting,mathematical fitting(least square method)on the LSV curve of Pt/C electrocatalyst was first performed on the basis that the Pt/C electrocatalyst constitutes the state-of-the-art and benchmark for ORR electrocatalysis undergoing a typical4e-reduction pathway.Additionally,hydrogen adsorption may occur in the potential range of0–0.3V(versus reversible hydrogen electrode,RHE)and lead to the deviation of the measured current density[30].Therefore,the range of0.3–1.2V vs RHE is chosen for the calculation.
Fig.1b shows the fitting results.The fitting curve is generally consistent with the experimental LSV curve.The residual is only0.26,indicating that the fitting well reproduces the experimental data and shows the effectiveness of the model.The intrinsic activity can be represented by the exchange current density(j0)and the electron transfer number(n).The result shows j0=4.8×10⁻⁵mA cm-2and n=3.7based on the Pt/C electrocatalyst.Both fitting results of j0and n are close to the actual values,demonstrating the reliability of such quantitative analysis[31].
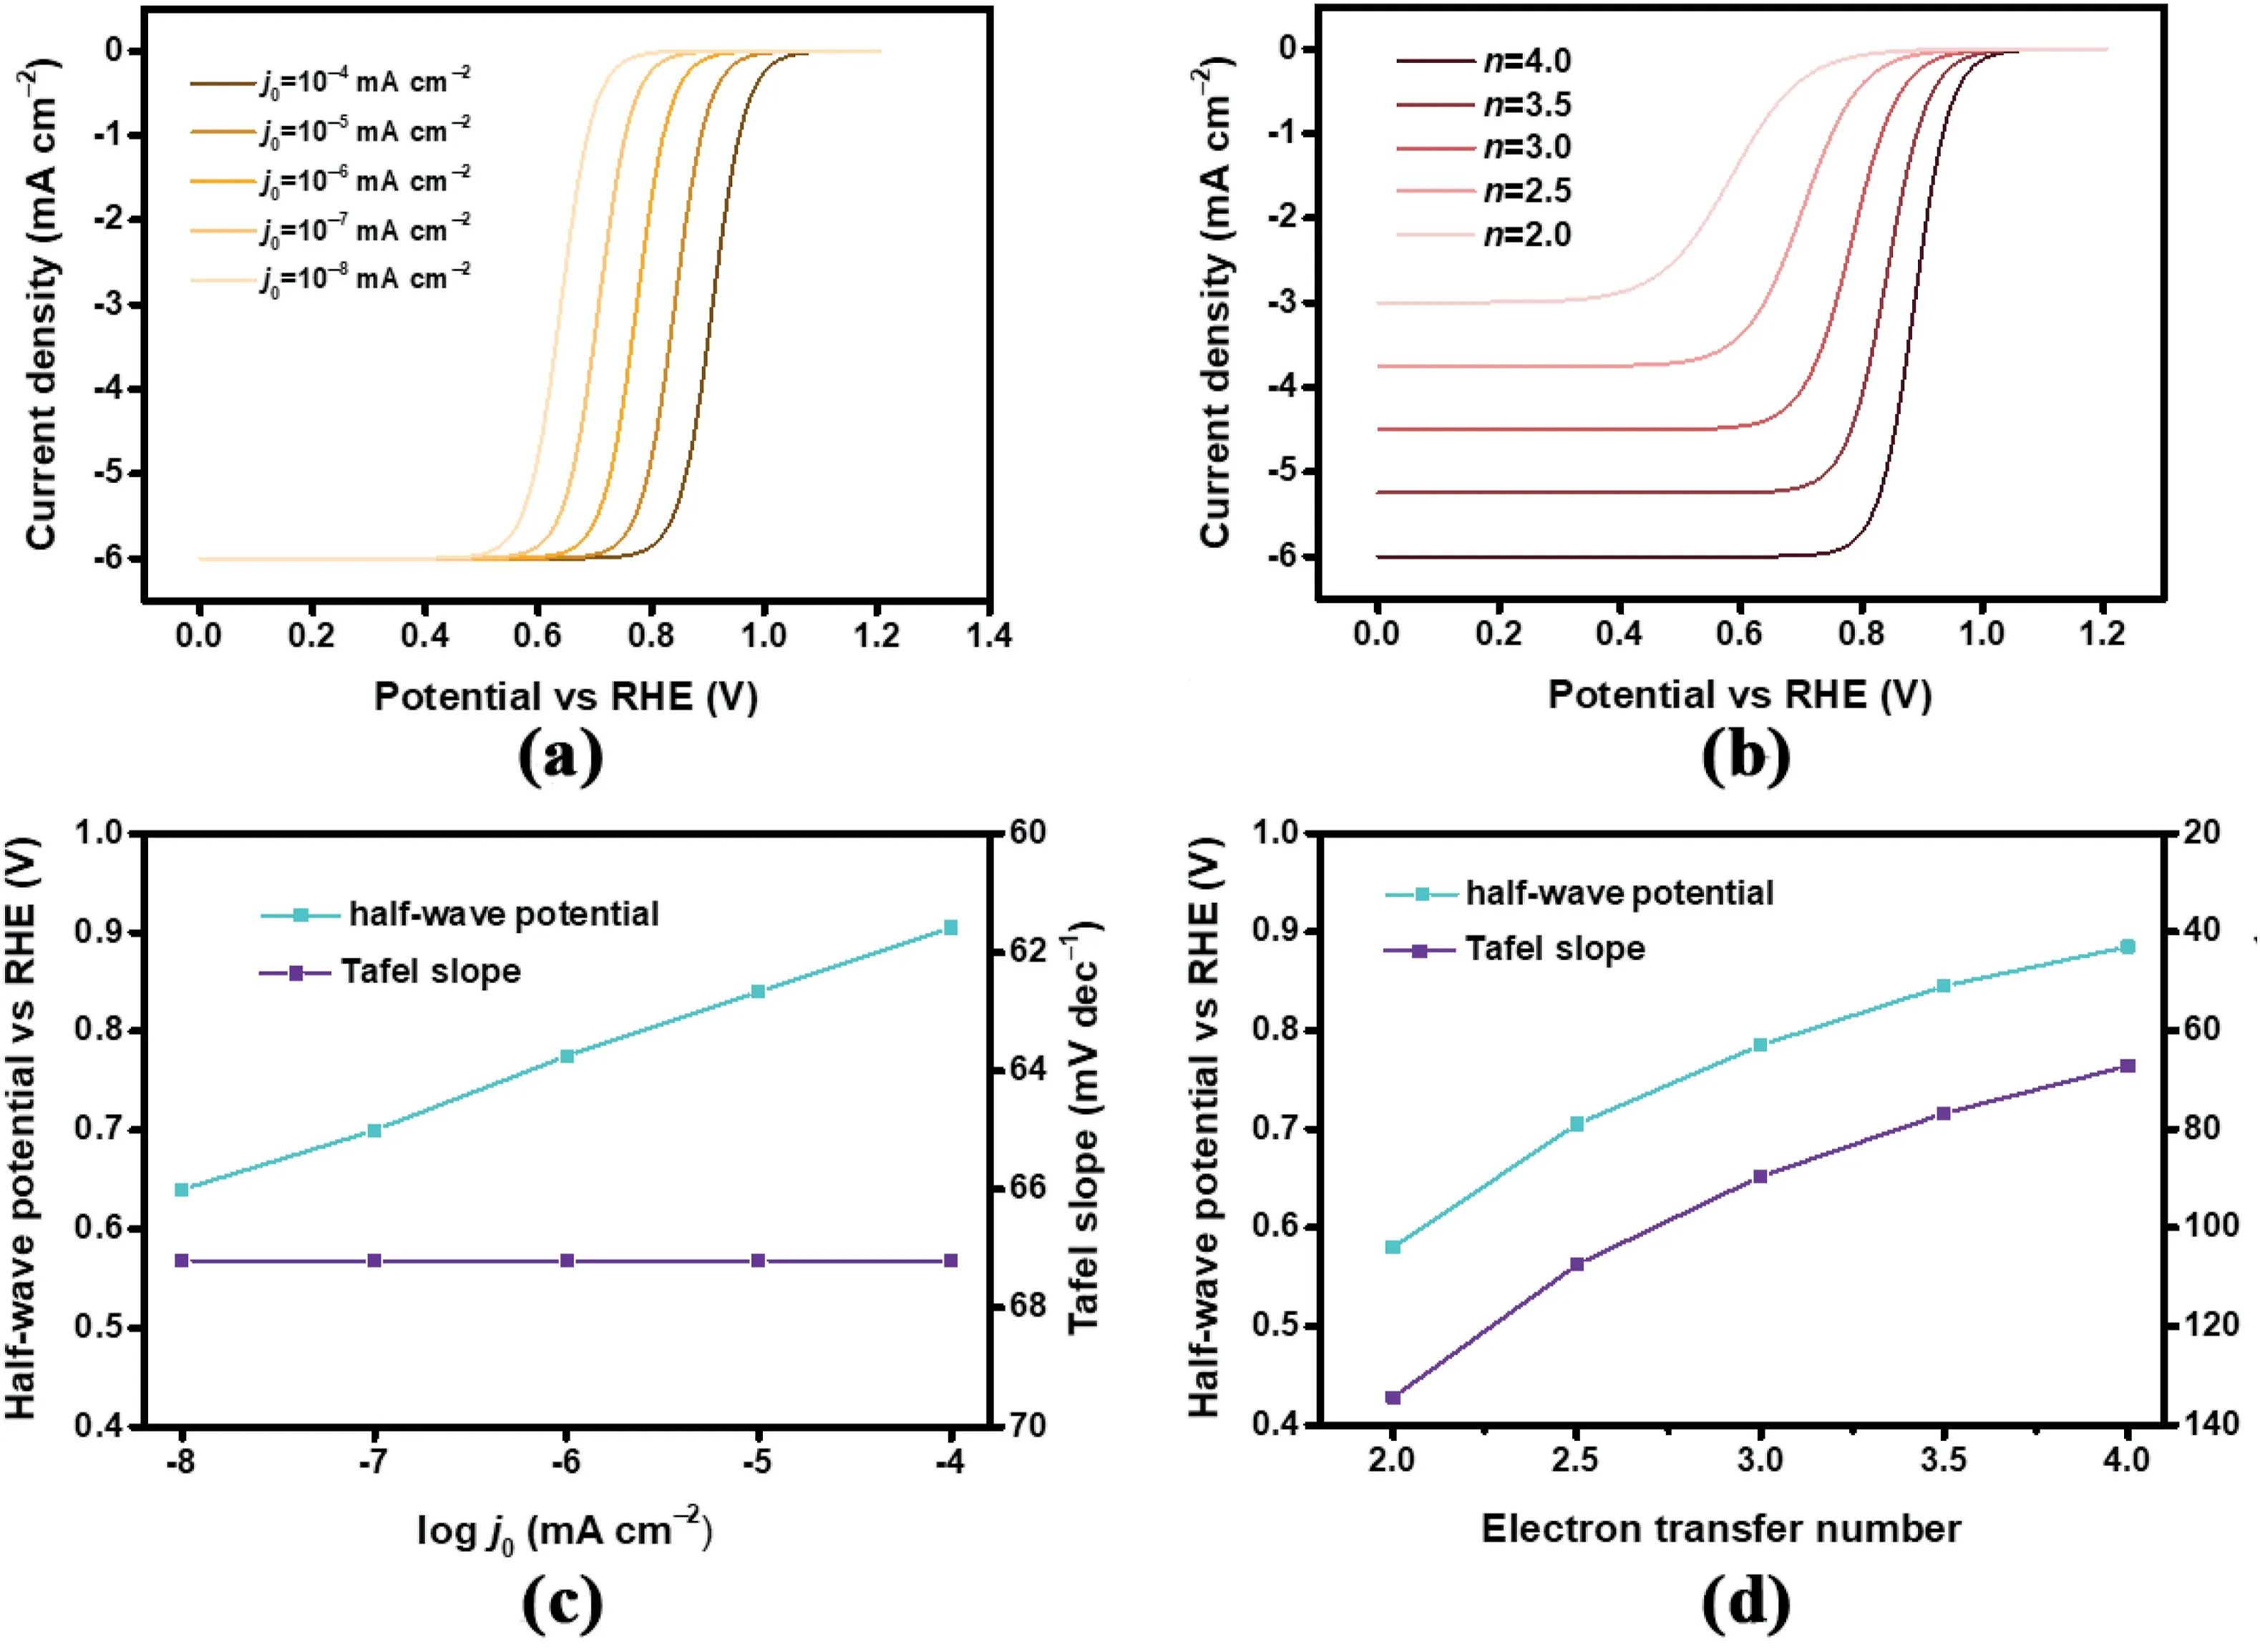
To more intuitively reveal the influence of the independent intrinsic parameters on overall performance,a series of theoretical LSV curves with different parameters are presented.Exchange current density and electron transfer number that quantitatively reflect the reaction kinetics and selectivity of ORR electrocatalysis are selected as the independent variables to monitor the variation of corresponding LSV curves,together with the influenced E1/2and Tafel slope as the commonly used indicators.As shown in Fig.2a,the trend of the LSV curves is directly affected by the exchange current density.With an increase in the exchange current density,the curve is right-shifted corresponding to higher ORR performance.The E1/2is reasonably enhanced and gradually close to the equilibrium potential(Fig.2b).The shape of the LSV curves is unaffected with a similar current density–potential(j–V)response trend and consequently constant Tafel slopes result.
To study the influence of the electron transfer number,a series of electron transfer numbers values of2.0,2.5,3.0,3.5,and4.0were selected to produce the theoretical LSV curves with j0set at a constant reasonable value of10-4mA cm-2[32].As shown in Fig.2c,with the increase of electron transfer number,corresponding LSV profiles vary from each other greatly including higher limiting current densities,overall right-shifted curves,and more significant j–V responses.Additionally,the E1/2gradually increases together with reduced Tafel slope,both of which manifest enhanced electrocatalytic ORR performance.
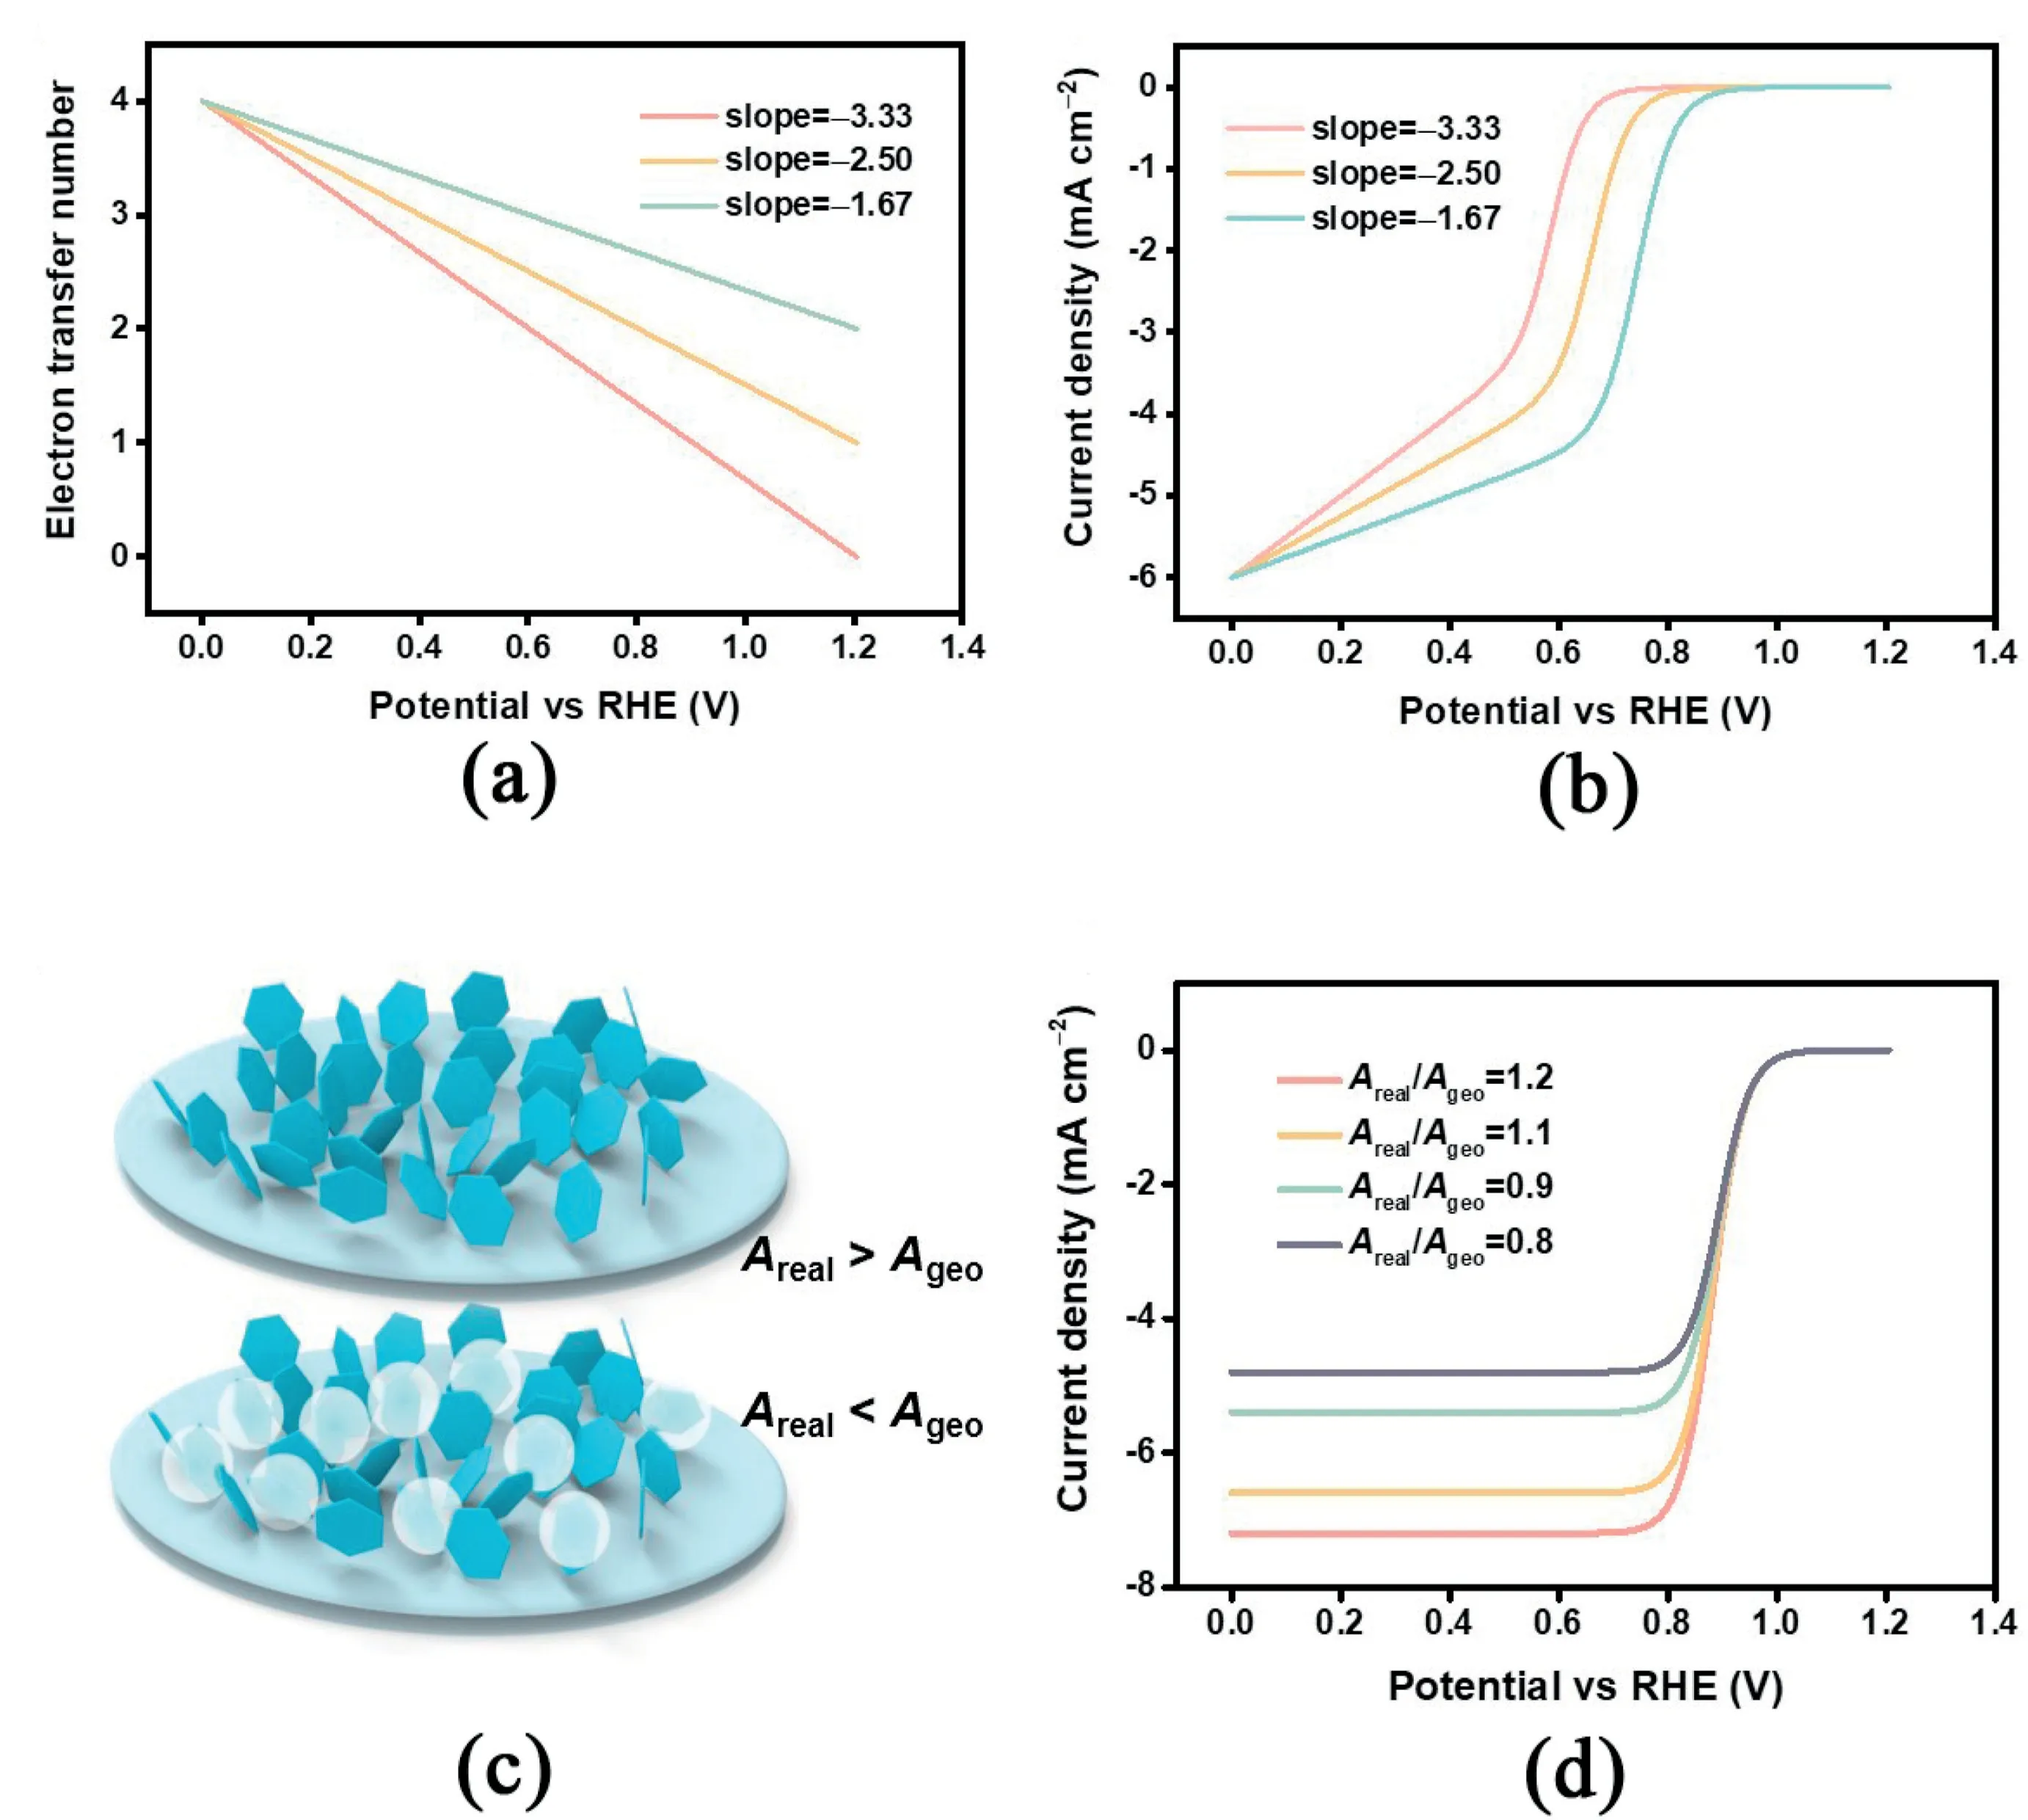
The above discussion is based on a simple model with assumptions including a plane electrode and constant electron transfer number.However,under actual electrochemical evaluation conditions,more complex surface reaction and mass transfer circumstances are usually involved,resulting in deformed‘S-shaped’LSV curves.Therefore,introducing a necessary amendment based on the K–L equation is expected to further reveal in-depth properties of the ORR electrocatalysts and expand the feasibility of the proposed quantitative kinetic analysis method.First,the electron transfer number describing the selectivity between2e-or4e-ORR pathway is sensitive to the applied potential[33,34].Therefore,the electron transfer number may vary as the potential changes and deviates from the hypothesis of n being a constant value[35].To exhibit the amendment based on the electron transfer number,a series of linear relations between n and potential are selected to produce the corresponding theoretical LSV curves(Fig.3a).

Fig.2.(a)Simulated LSV curves with different j0from10-8to10-4mA cm-2and(b)corresponding half-wave potential and Tafel slope.(c)Simulated LSV curves with different n from2to4and(d)corresponding half-wave potential and Tafel slope.
As exhibited in Fig.3b,the current densities cannot reach a steadystate value at high overpotential in the diffusion control region.Such a phenomenon with gradually increasing jlis common for some carbonbased ORR electrocatalysts.The E1/2is smaller when the electron transfer number is smaller among the three relationships.The Tafel slope also changes in the same manner.For example,Shin et al.constructed a composite graphene framework with N,S co-doped carbon dots[36].The electrocatalyst showed a gradually enhanced current density in the diffusion control area and did not converge to a constant value.
The actual active surface area(Areal)is generally considered to be the geometric area(Ageo)based on the assumption of plane thin-film electrodes[37].However,for porous electrodes,using nanosized electrocatalysts in most cases,the above assumption is invalid in that the active surface area is larger than the geometric area[38].On the other hand,uneven electrocatalyst loading or a bubble on the surface result in reduced active surface area and loss of electrocatalytic ORR activity as the active sites can be covered and lose contact with the electrode or the reactants(Fig.3c).Therefore,the assumption of constant active surface area is unreasonable under certain conditions.The influence of the active surface area mainly lies in the difference of the limiting current density(Fig.3d).When the active surface area is smaller than the geometric surface area,the limiting current density should be relatively smaller and vice versa.In experiments,Shinde et al.designed P,S co-doped carbon nitride sponges sandwiched with carbon nanocrystals and found the limiting current density to be much greater than the theoretical limiting current density[39].Under such conditions,the active surface area should be calibrated accordingly to accurately describe the effects originating from the electrode structures instead of intrinsic electrocatalytic activity.Notably,although both reduced n and low Arealmay lead to reduced limiting current density,they have different specific effects on the overall LSV curve.Varied Arealmainly influences the current density in the mass transfer control area,while varied n has a great effect on the Tafel slope in addition to that on the limiting current density.The proposed quantitative analysis method herein can distinguish the above two aspects.In addition,using the rotating ring-disk electrode method can experimentally decouple n and Arealby determining the n value based on the ring and disk currents.
The above discussion demonstrates the feasibility and effectiveness of the quantitative kinetic analysis method on ORR electrocatalysis.Specifically,based on the K–L equation,several essential parameters regarding exchange current density,electron transfer number,and active surface area that are directly associated to the overall ORR performance are decoupled.The combination of conducting experiments and qualification analysis enables us to determine the limiting factor on a specific ORR electrocatalyst and point out the direction for further improvements.For instance,when the exchange current density is inferior to other electrocatalysts,the intrinsic activity will be improved[40–42].Heteroatom doping,defect engineering,and electronic structure modulation are effective strategies[43–49].Likewise,when the LSV curve is not as typical as expected,such as the current density not converging to a stable value,it suggests unsatisfactory selectivity[50].Otherwise,if the limiting current density is stable and reaching a relatively small value,it may originate from poor mass transfer.The above discussion demonstrates the significance of quantitative kinetic analysis for rational ORR electrocatalyst design.

Fig.3.(a)Assumed linear relations between n and potential and(b)resulted simulated LSV curves.(c)Schematic for different situations between Areal and Ageo and(d)simulated LSV curves based on different relations between Areal and Ageo.
3.Conclusion
In summary,a quantitative approach for decoupling the kinetic factors of ORR electrocatalysis is proposed by theoretical simulation on the experimental linear sweep voltammetry curves based on the Koutecky–Levich equation.The exchange current density,electron transfer number,and electrochemical active surface area can be reliably determined following the proposed method,making it convenient to decouple the intrinsic activity and mass transfer capacity of on a specific ORR electrocatalyst.The above strategy not only provides pivotal information for rational design on advanced ORR electrocatalysts,but also offers a new research direction on the investigation of ORR electrocatalysis and is potentially applicable to other essential electrocatalytic processes including the nitrogen reduction,carbon dioxide reduction,and fuel oxidation reactions etc.
Declaration of competing interest
The authors declare no conflict of interest.
Acknowledgements
This work was supported by Beijing Natural Science Foundation(JQ20004),National Key Research and Development Program(2016YFA0202500),and Scientific and Technological Key Project of Shanxi Province(20191102003).We thank Chen-Xi Bi and Dr.Jia Yu for helpful discussion.
Appendix A.Supplementary data
Supplementary data to this article can be found online at https://doi.org/10.1016/j.nanoms.2021.03.006.
杂志排行
Namo Materials Science的其它文章
- Low-cost fabrication of highly dispersed atomically-thin MoS2nanosheets with abundant active Mo-terminated edges
- Hierarchically electrospun nanofibers and their applications:A review
- RTV silicone rubber composites reinforced with carbon nanotubes,titanium-di-oxide and their hybrid:Mechanical and piezoelectric actuation performance
- Advanced carbon materials with different spatial dimensions for supercapacitors
- Surface microstructure-controlled ZrO2for highly sensitive room-temperature NO2sensors
- Applications of carbon nanomaterials in perovskite solar cells for solar energy conversion
