Examination of n-T9 conditions required by N=50, 82, 126 waiting points in r-process
2021-10-12NguyenDuyLyNguyenNgocDuyNguyenKimUyenandVinhPham
Nguyen Duy Ly, Nguyen Ngoc Duy, Nguyen Kim Uyenand Vinh N T Pham
1 Faculty of Fundamental Sciences, Vanlang University, Ho Chi Minh City 700000, Vietnam
2 Department of Physics, Sungkyunkwan University, Suwon 16419, Republic of Korea
3 Department of Physics,Ho Chi Minh City University of Education,Ho Chi Minh City 700000,Vietnam
Abstract We examined the conditions of neutron density(n)and temperature(T9)required for the N=50,82,and 126 isotopes to be waiting points(WP)in the r-process.The nuclear mass based on experimental data presented in the AME2020 database (AME and AME ± Δ) and that predicted using FRDM,WS4, DZ10, and KTUY models were employed in our estimations.We found that the conditions required by the N=50 WP significantly overlap with those required by the N=82 ones,except for the WS4 model.In addition, the upper (or lower) bounds of the n-T9 conditions based on the models are different from each other due to the deviations in the two-neutron separation energies.The standard deviations in the nuclear mass of 108 isotopes in the three N=50,82,and 126 groups are about rms=0.192 and 0.434 MeV for the pairs of KTUY-AME and WS4-KTUY models,respectively.We found that these mass uncertainties result in a large discrepancy in the nn-T9 conditions, leading to significant differences in the conditions for simultaneously appearing all the three peaks in the r-process abundance.The newly updated FRDM and WS4 calculations can give the overall conditions for the appearance of all the peaks but vice versa for their old versions in a previous study.The change in the final r-process isotopic abundance due to the mass uncertainty is from a few factors to three orders of magnitude.Therefore,accurate nuclear masses of the r-process key nuclei,especially for 76Fe, 81Cu, 127Rh, 132Cd, 192Dy,and 197Tm,are highly recommended to be measured in radioactive-ion beam facilities for a better understanding of the r-process evolution.
Keywords: neutron capture, r-process, nuclear mass, isotopic abundance, precise mass measurement
1.Introduction
The synthesis of elements beyond iron is believed to mainly proceed via the rapid neutron-capture process (r-process) [1, 2].Analyses on the galactic elemental evolution [3–6] indicate that elemental abundance of the Solar system with three peaks at A ≈80 (Ge-Kr), 130(Te-Xe), and 195 (Os-Pt) is a result of the r-process [7–10].Indeed, about half of heavy elements, up to thorium,are produced in this process via a combination of the(n,γ), (γ, n) reactions, β-decay, and fission.Once the neutron capture is faster than the radioactive decay(mainly via β--decay)of the exotic seed nuclei, neutron-rich isotopes are enriched,leading to an expansion of the nuclear landscape far from the β stability.The competition between the(n,γ)-(γ,n)reaction and β--decay fluxes strongly impacts the isotopic abundance and reaction path of nucleosynthesis.A freeze-out of the neutron capture flux can occur when the (n, γ)-(γ, n) equilibrium is established under specific stellar conditions of neutron density and temperature[11–13],leading to the enrichment of long-lived isotopes, which are referred as waiting points (WP).In the equilibrium, the so-called WP nuclei await the β decay to shift the reaction path along the r-process towards the stability[14–16].Since the WP, whose neutron numbers are in the vicinity of neutron shell-closures at N=50,82,126,have relatively long lifetimes, their enrichment during the freeze-out results in the corresponding peaks at A=80, 130, 195 in the r-process abundance.Notice that the three peaks in the Solar-system r-process are thought not to be produced under the same set of stellar conditions[11,17,18].Hence,studies on the astrophysical conditions for the equilibrium and β-decay half-lives of extremely neutron-rich nuclei are important for a better understanding of the scenarios of the r-process.
Since the behaviors of the r-process strongly depend on the(n,γ),(γ,n),and β-decay rates[19–22],both nuclear properties(e.g.mass, spin, half-life, etc) of unstable isotopes far from stability and astrophysical conditions are important inputs for r-process calculations.For instance, in the study of r-process matter flow,Niu et al[23]indicated that reaction paths from20Ca to50Sn can be expanded up to 14(or 4)neutrons from N=82 if the β-decay half-lives based on the RHFB+QRPA model[24, 25] (or measurements [26, 27]) were employed in the calculations.Recently, some new developments for predicting the β-decay rate (or half-life) have been conducted, which are helpful for r-process studies.For example, a large-scale shell model including Gamow-Teller and first-forbidden transitions developed by Zhi et al[28]and the interacting shell model using large spaces of single-particle valence and many-body Hamiltonians proposed by Kostensalo et al[29]are emerging as good candidates for calculating the half-lives of heavy nuclei.The Hartree–Fock calculation including forbidden transitions with Skyrme interaction and pairing correlations can also well reproduce measured half-lives of neutron-rich nuclei with A ≈190[30].In other studies[10,31–33],it was found that the determination of the neutron density and temperature conditions for the (γ, n)-(n, γ) equilibrium establishment or WP approximation strongly depends on neutron and/or two-neutron separation energies of neutron-rich nuclei.In particular, the deviations in two-neutron separation energies of78Ni and84Zn due to the differences among the RMF [34], FRDM [35], and WS [36, 37] mass models lead to a large change, from 1023to 1026cm-3at 1 GigaKelvin(GK),in the neutron density required by the N=50 WP[33].The same phenomenon is also observed for the N=82 isotones[33].The results in these studies indicate that the (n, γ)-(γ, n) equilibrium, the waiting-point approximation for the N=50, 82, 126 nuclei, and subsequently isotopic abundance are very sensitive to nuclear mass.Unfortunately, the nuclear masses and half-lives of these WP are mostly predicted using theoretical models.
Recently, experimental studies on the nuclear mass have been expanded with the help of modern radioactive ion beam facilities [38–41].Several theoretical works have been developed to improve accuracy in the mass predictions[34–36, 42–44].For instance, Wang et al proposed a semiempirical formula (namely WS) based on the macroscopicmicroscopic method [35] with the isospin dependence and Skyrme energy density function being taken into account to predict the nuclear mass of isotopes up to A ≈312 [36, 37].The neutron separation energies estimated by using this model differ from those measured in laboratories by an average standard deviation of 0.332 MeV for 1988 nuclei[36].In another work,the Skyrme–Hartree–Fock–Bogoliubov(HFB) formula was developed by Goriely et al to predict the nuclear mass with a standard deviation of 0.581 MeV in a comparison with experimental data [42].Still in a theoretical study, the nuclear masses of isotopes calculated using the FRDM formula newly updated by Moller et al in 2019 differ from measured data by a standard error of only 0.4948 MeV[44].On the other hand, available experimental data until October 2020,including uncertainty,of the nuclear mass have been evaluated by Wang et al, which were reported in the AME2020 database in March 2021 [45].In that work, the reliably experimental and extrapolated data have been reviewed to provide the last updated nuclear mass data.
As aforementioned,the stellar conditions estimated in the r-process waiting-point approximation strongly depend on the masses of neutron-rich isotopes,especially for relatively longlived nuclei.Therefore, in this study, we employed reliable nuclear mass in the newly updated AME2020 database to examine the neutron density and temperature (nn–T9) conditions required by the N=50, 82 WP.Notice that the neutron-and two-neutron separation energies of the N=126 WP and their neighbors are still not available in AME2020.The conditions are also investigated using the updated nuclear mass calculations based on the FRDM [44], Weizsacker–Skyrme (WS4) [46], Duflo-Zuker (DZ10) [47, 48], and Koura–Tachibana–Uno–Yamada(KTUY)[49]models for all the considered N=50,82,and 126 WP.The mass uncertainty due to different models is examined to suggest the best prediction for further studies.The stellar conditions associated with the different mass data sets(FRDM,AME2020 with and without uncertainty, WS4, DZ10, and KTUY) are compared to each other to determine the lower and upper bounds of the nn–T9conditions for r-process simulations.Subsequently,we investigated the impact of the uncertainty in the nn–T9conditions on the r-process isotopic abundance.
The present paper is constructed as follows.The theoretical framework for the WP approximation is presented in section 2.The results of the stellar conditions based on the updated mass data from AME2020,FRDM,WS4,DZ10,and KTUY calculations are discussed in section 3.The summary of this work is given in section 4.
2.Theoretical framework
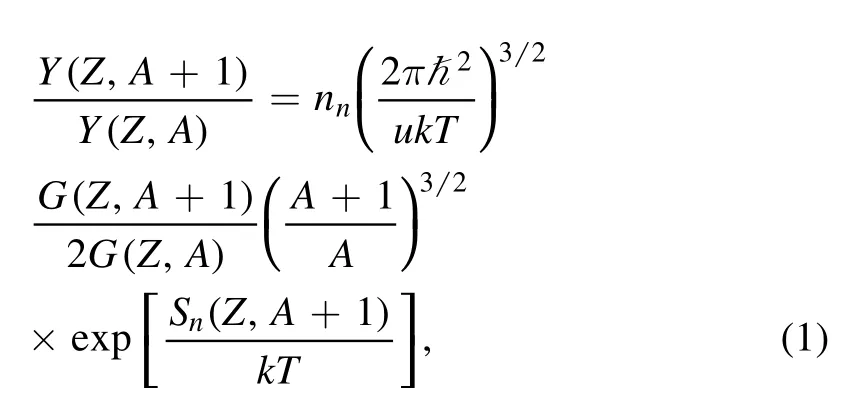
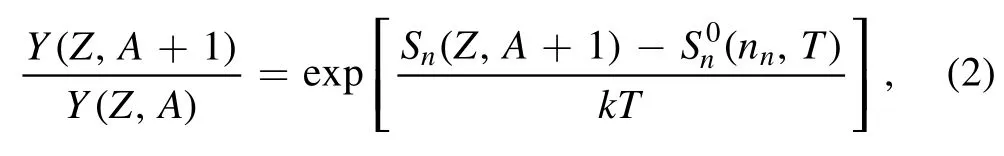
The (n, γ)-(γ, n) equilibrium can be established under high neutron density (nn≥1020) and temperature (T ≥109) conditions.Under such scenario, the abundance ratio of (Z, A+1)and(Z,A)isotopes is calculated by the Saha relation as[11–13]where Y(Z, A), u, G(Z, A), and Snare the abundance of the(Z, A) nuclide, atomic mass unit, temperature-dependent partition function [50] of the (Z, A) nuclide, and one-neutron separation energy; k and ħ denote Boltzmann and reduced Planck constants, respectively.Due to the equilibrium, the r-process is paused at WP, leading to peaks established at A ≈80, 130, and 195 (N=50, 82, and 126).At the highest abundance for each element, the abundance ratio is approximately equal to 1.By ignoring small differences in the partition functions and mass numbers of two neighboring isotopes, the relation in equation (1) can be rewritten as [33]
where the average neutron-separation energy(nn,T)is calculated by
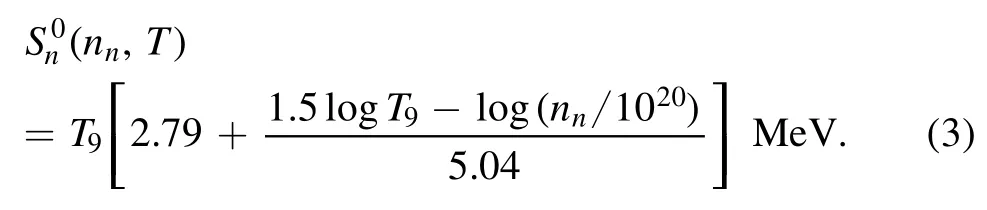
In equation (3), T9is the temperature T in the unit of Giga-Kelvin (GK).Notice that the average neutron-separation energiesn,T)of all the nuclei at the highest abundance are almost the same.
Since all the WP have even neutron numbers (even-N)due to the paring effect on neutron binding, the abundance ratio of two neighboring even-N isotopes can be estimated by
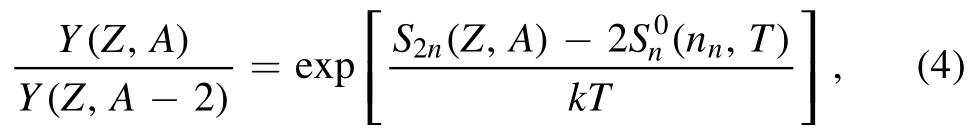
where S2n(Z, A) is the two-neutron separation energy of the isotope (Z, A).Obviously, the abundance of the (Z, A) even-N nuclide is increased with increasing neutron number N when Y(Z, A)/Y(Z, A-2)>1 untilS2n<from this point the abundance is decreasing with N when Y(Z,A)/Y(Z,A-2)<1.As a result, abundance peaks locate at the nuclei whose twoneutron separation energies fulfill the following condition [33]

By taking equation (3) together with equation (5), the nn–T9conditions for a (Z, A) nuclide to be a WP can be determined.Obviously,the formalisms above indicate that the estimation of the nn–T9conditions strongly depends on the accuracy of the nuclear mass.Hence, in this study, the neutron- and/or twoneutron separation energies taken from the newly updated AME2020 database [45] and nuclear mass predicted using the last updated FRDM, WS4, DZ10, and KTUY models are utilized for the WP approximation.Notice that the two-neutron separation energy of the(Z,A)nuclide can be deduced in terms of the mass excesses, M(Z, A) and M(Z, A-2) (in MeV), as
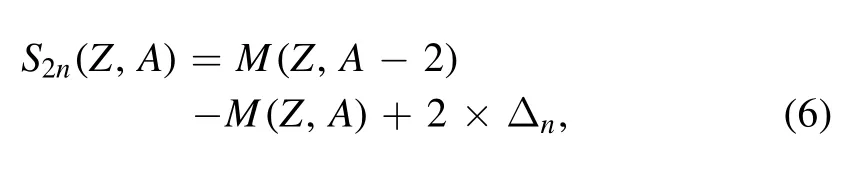
with Δn=8.071 MeV being the neutron mass excess.The deviation ΔS2nin the two-neutron separation energy due to the mass-excess uncertainty is determined using the error propagation rule in statistics [51].Subsequently, the average neutron separation(nn,T)in equation (5) is selected in the range of
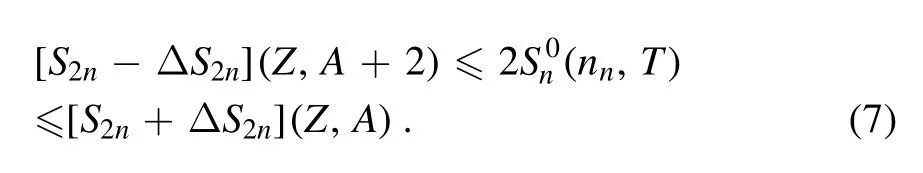
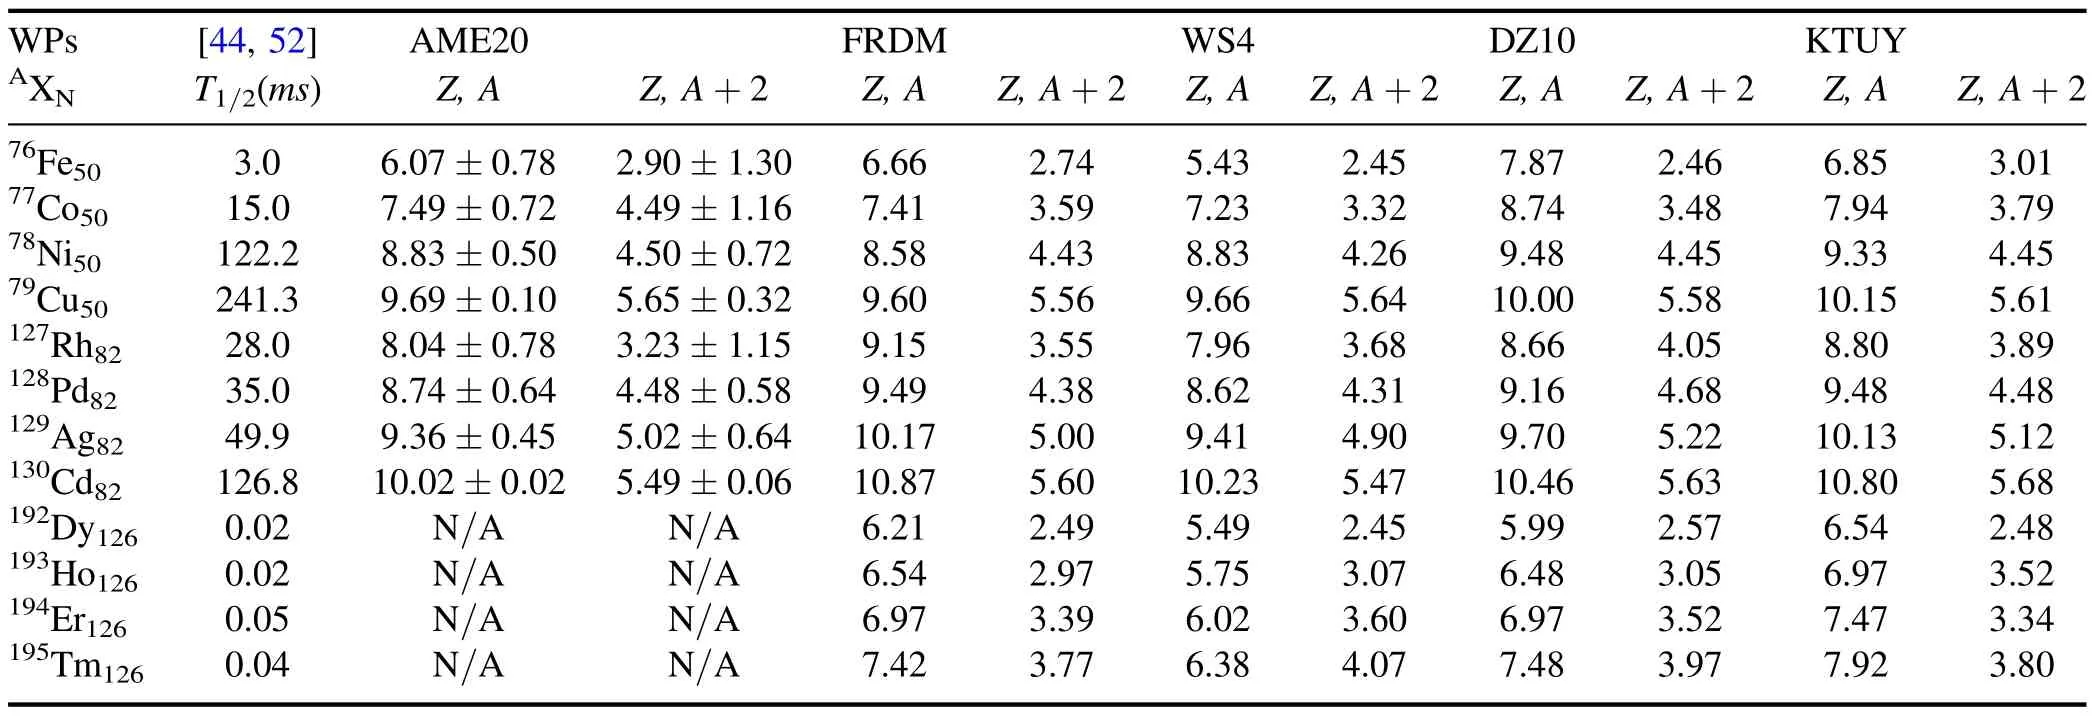
Table 1.Two-neutron separation energies(S2n,in MeV)of the 76Fe, 77Co, 78Ni, 79Cu, 127Rh, 128Pd, 129Ag, 130Cd, 192Dy, 193Ho, 194Er, 195Tm critical waiting points(WPs)[(Z,A)nuclei],and their even-N neighbors[(Z,A+2)nuclei].The separation energy values calculated using the FRDM,WS4,DZ10,and KTUY models taken from[44,46,48,49],respectively,are compared to available experimental data obtained from the AME2020 database [45].The half-lives of the isotopes are taken from the NUBASE2020 database [52] or new QRPA calculations in [44].
3.Results and discussion
We considered the waiting-point approximation for twelve extremely neutron-rich nuclei with N=50,82,and 126 which are76Fe,77Co,78Ni,79Cu,127Rh,128Pd,129Ag,130Cd,192Dy,193Ho,194Er,and195Tm.The nuclear masses of these isotopes are still very uncertain.In table 1, we list the two-neutron separation energies of the investigated WP (Z, A) and their even-N neighboring isotopes (Z, A+2), which were employed for the examination of the nn-T9conditions required by the considered WP.Figure 1 shows the nn–T9conditions, which are based on the six mass data sets[AME2020(AME),AME2020 with uncertainty(AME±Δ),FRDM, WS4, DZ10, and KTUY] required by the N=50[panels (A)–(F)] and N=82 [panels (G)–(L)] WP.It is clear that the upper and lower bounds of temperature (or neutron density) at a given neutron density (or temperature) required by the heavier isotones are higher (or lower) than those required by the lighter ones.For example, with the AME mass data, the required neutron density is ranging in nn=2.5×10²¹–3.1×1026cm-3for79Cu while it is nn=9×1025–9×1029cm-3for76Fe at T=2 GK, as can be seen in panel (A).Still with the AME data set,panel (G) shows that the condition is ranging in nn=8.5×1024–5.4×1028cm-3for130Cd but nn=1026–3.8×1029cm-3for128Pd at T=3 GK.The same behaviors are also observed for the AME±Δ,FRDM,WS4,DZ10, and KTUY mass models.This phenomenon can be understood by the greater two-neutron separation energies(S2n) of the heavier elements.For instance, the two-neutron separation energy is S2n=9.69 (or 5.65)MeV for79Cu (or81Cu) but it is S2n=6.07 (or 2.9)MeV for76Fe (or78Fe).Subsequently, the average neutron separation energies for76Fe and79Cu are 1.45 ≤(nn,T9)Fe≤3.035 MeV and 2.825 ≤(nn,T9)Cu≤4.845 MeV, respectively.
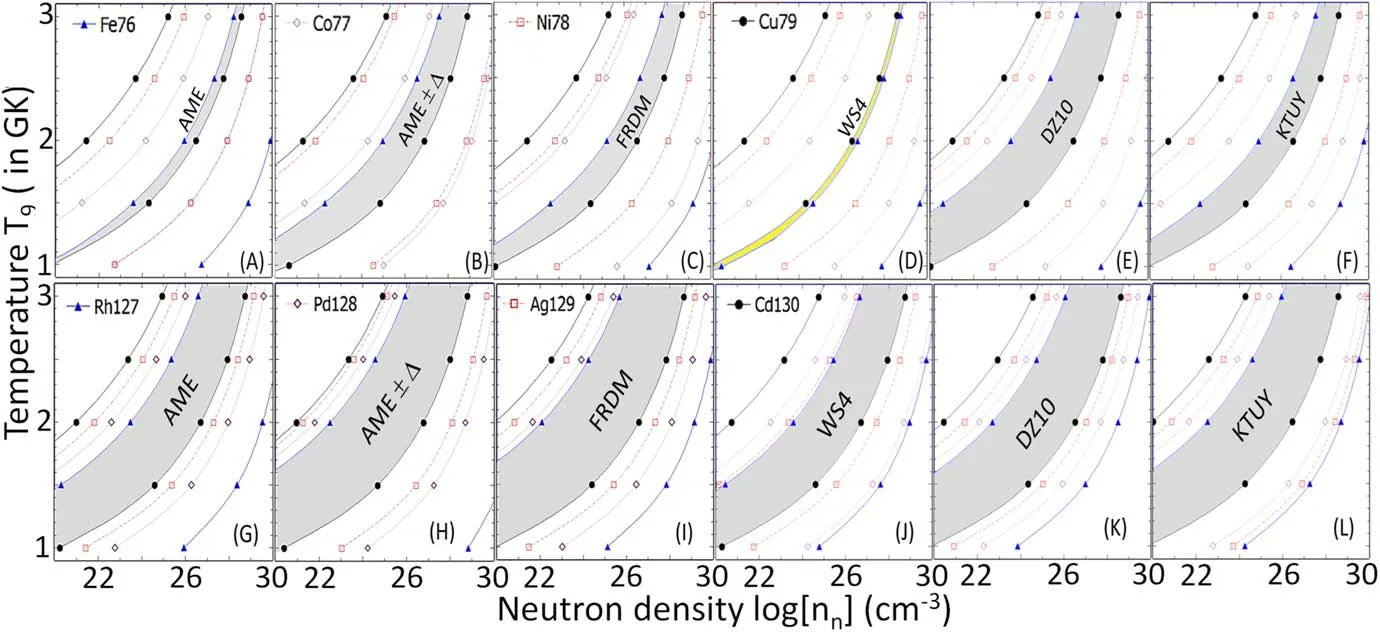
Figure 1.nn-T9 conditions needed for [panels (A)–(C)] 76Fe, 77Co, 78Ni, 79Cu and [panels (D)–(F)] 127Rh, 128Pd, 129Ag, 130Cd to be the N=50 and N=82 WP, respectively, in the r-process.The conditions were estimated using two-neutron separation energies, S2n, from AME2020, AME2020 with uncertainty ΔS2n [(AME ± Δ)], and FRDM, WS4, DZ10, and KTUY calculations.The grey shaded areas in panels(A)–(C),(E),and(F)[or(G)–(L)]denote the overall conditions for all the investigated N=50[or N=82]WP.Yellow shaded are in panel (D) indicates the separation between conditions required by 76Fe and 79Cu.
The shaded areas in the panels (A)–(F) or (G)–(L) of figure 1 are shown for the overall nn-T9conditions based on the AME, AME ± Δ, FRDM, WS4, DZ10, and KTUY nuclear masses for the N=50 or N=82 WP of interest.In the panels (A)–(F), the upper curves were determined using the two-neutron separation energy of the lightest N=50 WP,S2n(76Fe); the lower curves were deduced using S2n(81Cu),which is the two-neutron separation energy of the N=50+2 isotope of the heaviest N=50 WP(79Cu),except for the WS4 model in the panel(D).Similarly to the N=50 chain,the upper and lower curves for the N=82 WP were deduced using the two-neutron separation energies of127Rh (N=82) and132Cd(N=82+2), respectively.For the exception with the WS4 calculations,S2n(81Cu)=5.6406 MeV is larger than S2n(76Fe)=5.4335 MeV [refer to panel (D) of figure 2], leading to the separation between the condition bands required by76Fe and79Cu to be WP.In other words,there is no nn-T9condition for both76Fe and79Cu to simultaneously be WP.This exception is interesting because it clearly shows the sensitivity of the WP nn-T9conditions to the mass models.
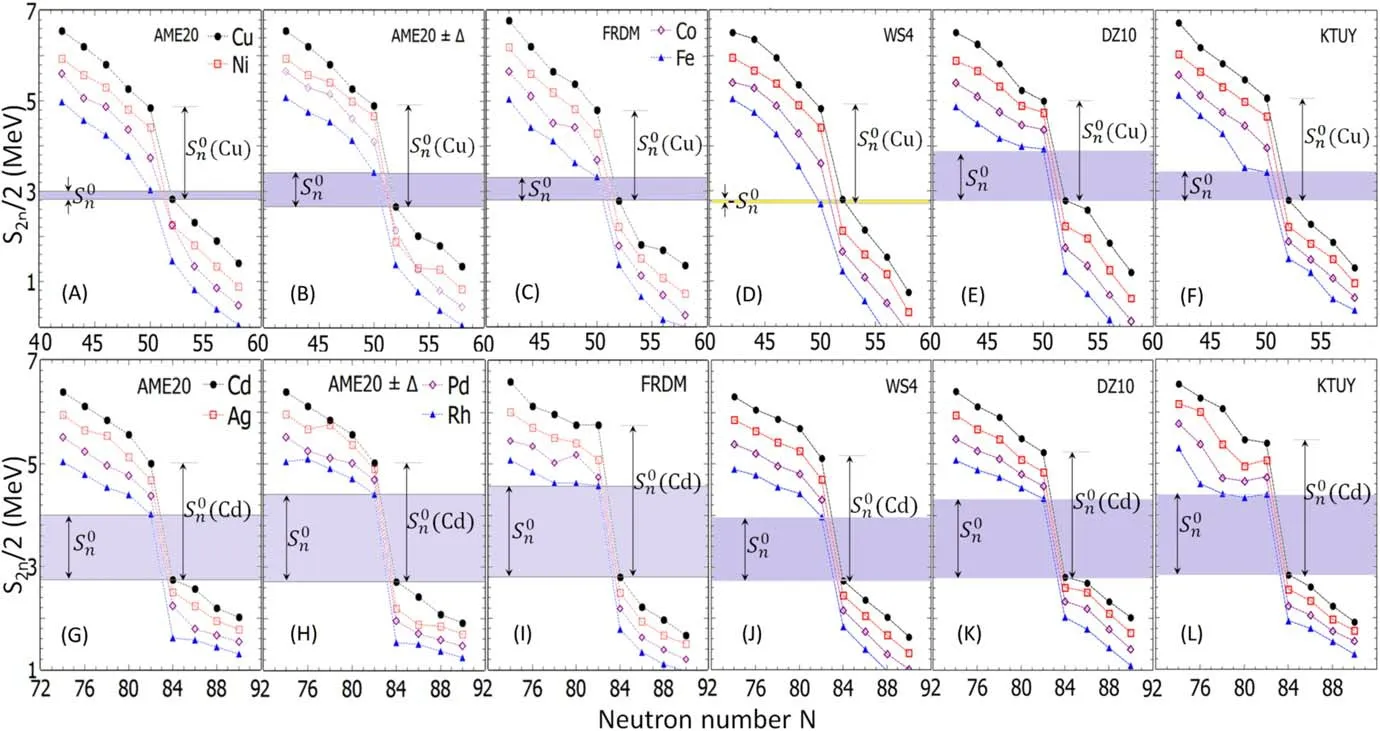
Figure 2.Two-neutron separation energies S2n/2(in MeV)based on the AME2020 database and FRDM,WS4,DZ10,KTUY mass models of the even-N isotopes considered in the present study.The grey shaded areas denote the average neutron separation energies,which result in the overall nn-T9 conditions required by N=50 or 82 waiting points.Yellow shaded area in panel(D)indicates the value which does not fulfill the conditions required by both 76Fe and 79Cu to be simultaneous waiting points.
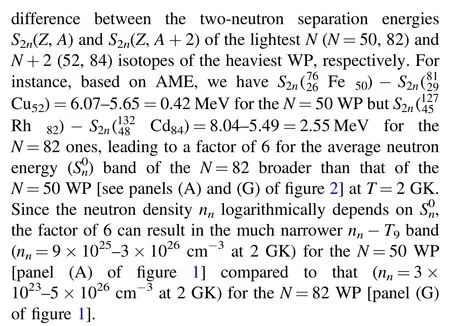
Similarly to the N=50 and 82 nuclei, the nn-T9conditions for the N=126 WP of162Dy,163Ho,164Er,and165Tm are determined by taking two-neutron separation energies S2nof162Dy and167Tm for the upper and lower bounds, respectively.The results of the conditions [upper panels (A)–(D)]based on the energies [lower panels (E)–(H)] calculated using the FRDM, WS4, DZ10, and KTUY models are shown in figure 3.Notice that the results based on AME cannot be considered due to the lack of experimental data for these nuclei.The results show that S2nvalues of the N=126 nuclei are about 1 MeV lower than those of the N=50 and 82 ones.This leads to the higher nn–T9conditions for the N=126 WP.For instance, the upper limit of neutron densities required by the N=126 isotopes are nn=1024and nn=1029(cm-3) at T=1 and 2.5 GK, respectively, which are about 1–4 orders of magnitude higher than those required by the N=50 and 82 WP.On the other hand, the lower and upper limits of the nn-T9conditions are also very uncertain,which may vary by 1–2 orders of magnitude due to the uncertainties in the twoneutron separation energies based on different mass models.Moreover,it can be seen in panels(A)–(D)that the conditions based on the WS4 and DZ10 models are mostly similar to each other but different from those based on the FRDM and KTUY methods.These results can be understood by the differences in S2ns of the investigated isotopes, as shown in panels (E)–(H).
Figure 3.Comparisons of the overall nn–T9 conditions required by the N=126 waiting points[upper panels]and associated S2n/2(in MeV)based on the FRDM,WS4,DZ10,and KTUY mass models of N=126 neighboring even-N isotopes[lower panels].The shaded areas in the lower panels indicates the values, which result in the shaded areas in the conditions in the upper panels.
The results and discussion above obviously indicate that the nn-T9conditions are sensitive to the mass predictions.Hence, it is worth studying the significant difference among the models to examine the influence of mass predictions on the overall conditions required by the WP.In figure 4, we show the differences in the two-neutron separation energies among the nuclear mass models[AME,FRDM,WS4,DZ10,KTUY] for 108 investigated isotopes, which are shown in figures 2 and 3.The difference is defined by the standard deviation, rms, which is given by
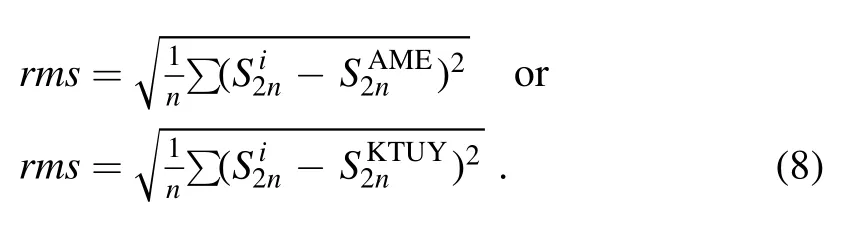
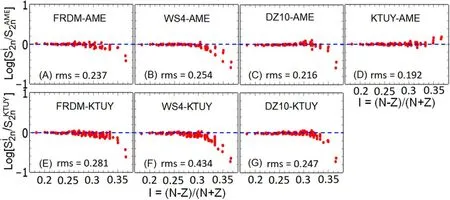
Figure 4.Differences in the two-neutron separation energies between the FRDM, WS4, DZ10, KTUY calculations and experimental data AME2020 [panels (A)–(D)] and between FRDM, WS4, DZ10 and KTUY calculations [panels (E)–(G)].The dashed lines are to guide the eyes.
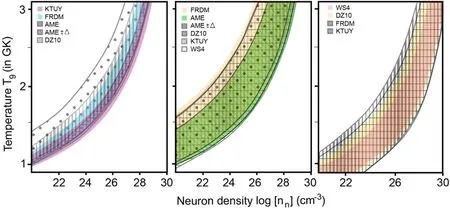
Figure 5.Comparisons of the overall nn–T9 conditions required by N=50[left panel],N=82[middle panel],and N=126 waiting points based on various mass models (AME, AME ± Δ, FRDM, WS4, DZ10, and KTUY).The overlapped areas indicate the same nn-T9 conditions which are determined by all the mass models.Notice that the WS4 results are not included in the case of N=50 because there is no conditions for both Fe and Cu to be simultaneous waiting points as discussed in previous sections.
The results show that the WS4 calculations give a larger deviation (rms=0.254 MeV) [panel (B)] compared to the FRDM, DZ10, and KTUY computations in the comparisons to experimental data (AME).In contrast, the KTUY prediction is close to the AME2020 data since the deviation is only rms=0.192 MeV between them [panel (D)].This result suggests that the KTUY model is reliable to be employed for the investigations of then n–T9conditions required by the N=50, 82, and 126 WP.Since the KTUY calculation is closer to experimental data, we examined the differences between the others and KTUY,as can be seen in panels(E)–(G).It was found that the KTUY prediction is closer to the DZ10 calculation than to the FRDM estimation.The largest deviation of rms=0.434 MeV in panel(F)indicates that it is significantly different between the WS4 and KTUY predictions.On the other hand, the comparisons show that the deviations among the predictions based on different models are increased with increasing neutron numbers, which correspond to the charge asymmetry factor I >0.315.In other words, the uncertainty in mass calculations for extremely neutron-rich isotopes with I >0.315 is still very large, which is from a few factors to one order of magnitude.
Although with a small deviation of rms ≤0.254 MeV,the mass uncertainty strongly impacts the overall nn–T9conditions required by the N=50,82,and 126 WP,as can be seen in figure 5.For instance,in the case of the N=50 WP,it can be seen in the left panel that the nn–T9band based on the AME data set (vertical hatched band) is very narrow while it is much broader if the AME ±Δ or the other mass data(i.e.FRDM, DZ10, etc) are taken into the calculations.The deviation between the nn–T9bandwidths can be understood by the uncertainty, which results in the large difference between the AME and AME ± Δbands [see panels (A)and (B) of figure 2], of the two-neutron separation energies of the concerned nuclei.The difference between these bandwidths is found to be0.76 - 0.21 =0.55 MeV due to the uncertainties of ΔS2n(76Fe)=0.78 and ΔS2n(81Cu)=0.32 MeV in the twoneutron separation energies of76Fe and81Cu,respectively.As a result,the bandwidth of the neutron density required by the N=50 WP is extended from 9.2×1025–3.1×1026(AME,vertically hatched band) to 9.5×1024–7.8×1026cm-3(AME±Δ,horizontally hatched band)at T=2 GK.In other words, the current uncertainties of about 12% and 5% in the experimental two-neutron separation energies of76Fe and81Cu lead to a large deviation by a factor of 35 in the nn–T9conditions required by the N=50 WP at 2 GK.For the FRDM data, thebandwidth is 0.34 MeV, which is larger than that(0.21 MeV)of the AME-band[see panels(A)and(C) of figure 2], leading to a difference of one order of magnitude between the nn–T9bandwidths based on the AME(vertically hatched band) and FRDM (blue shaded are) data sets.Still in the left panel, it is clear that the DZ10 model results in the widest range of the conditions while the KTUY method can give a range comparable with that based on the AME mass data.
For the N=82 WP (middle panel of figure 5), the nn-T9condition are also uncertain because of the deviation in the two-neutron separation energies of127Rh(N=82) and132Cd (N=82+2).It can be seen in the middle panel of figure 5 that the nn-T9bandwidths based on AME,AME±Δ, and FRDM are 2.8×10²³–4.7×1026(green shaded band), 3.5×10²²–5.1×1026(vertically hatched band), and 1.2×10²²–3.2×1026(yellow shaded area) cm-3at T=2 GK, respectively.These nn-T9bandwidths correspond to the(nn,T9)bandwidths of 1.3, 1.7, and 1.8 MeV in the panels (G), (H), and (I) of figure 2, respectively.The results show that the uncertainty in the S2nenergies of the even-N isotopes can lead to a change of one order of magnitude in the lower thresholds of the neutron density required for127Rh,128Pd,129Ag, and130Cd (N=82) to be the r-process WP.Besides,it was found that the pairs of AME-WS4 and DZ10-KTUY calculations are in good agreement with each other due to almost the samevalues, as can be seen in panels(G)–(J) and (K)–(L) of figure 2, respectively.On the other hand, in the right panel of figure 5, we show the conditions required by the N=126 WP, which were calculated using FRDM (vertically hatched band), WS4 (purple shaded area),DZ10(yellow shaded area),and KTUY(horizontally hatched band)models.The results indicate that the condition based on the WS4 model is narrowest while that based on the KTUY is widest.These results confirm that the estimations of the stellar conditions for the r-process WP are very sensitive to the mass models.
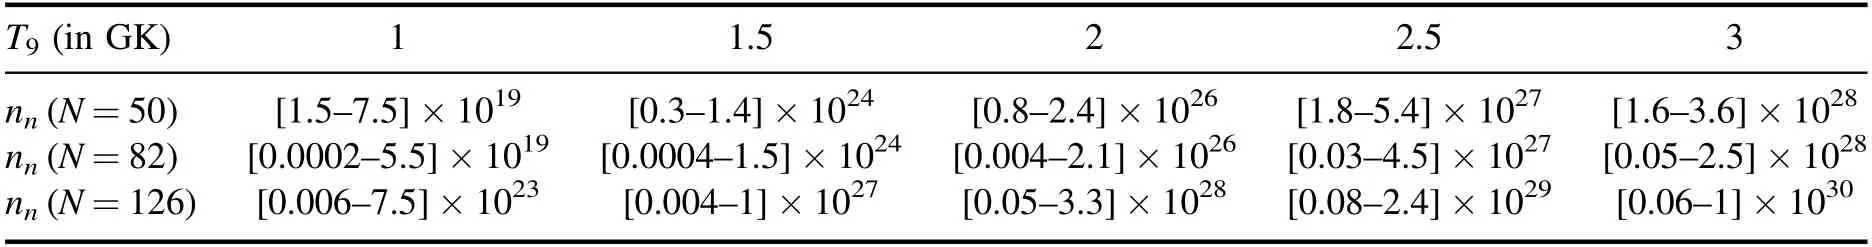
Table 2.Summary of the nn-T9 conditions,which are overlaps calculated by all the mass models(AME,AME±Δ,FRDM,WS4,DZ10,KTUY), for the N=50 and 82 waiting points; and by the FRDM,WS4, DZ10, KTUY models for the N=126 nuclei.Notice that neutron density nn is in the unit of cm-3.
Because the WP calculations strongly depend on mass models as discussed above, it is necessary to determine the general nn-T9conditions required by the WP regardless of a specific mass model.By taking whole the conditions calculated with the various models, we can determine the mixed areas in figure 5,which indicate the general conditions so that all the mass models are satisfied.The conditions are summarized in table 2.It is clear that the N=126 isotopes required much higher neutron density and temperature, up to two orders of magnitude, to be the r-process WP.These results are consistent with those obtained by Xu et al in[33].
Since the total half-lives of the N=50 (∑T1/2(76Fe-79Cu)≈382 ms [52]), N=82 (∑T1/2(127Rh-130Cd)≈240 ms[52]),and N=126(∑T1/2(192Dy-195Tm)≈130 ms[44])are about 752 ms,the distribution of isotopes in the first(N=50 or A ≈80), second (N=82 or A ≈130), and third(N=126 or A ≈195) peaks in the r-process abundance during the β--decay waiting time of 0.752 s strongly depends on the nn-T9conditions.The conditions for all the peaks simultaneously appearing in the waiting time can be determined by taking the overlaps of the nn-T9condition bands required by the N=50, N=82, and N=126 WP, as shown in figure 6.It is found that the nn-T9conditions needed for the N=50 isotopes (horizontally hatched bands) to be the WP also fulfill the requirement for the N=82 ones for all the models.In other words, when the temperature and neutron density of stellar environments (i.e.the bubble of high entropy neutrino-driven winds, neutron merging stars, etc)satisfy the yellow shaded areas,both the A ≈80 and A ≈130 peaks are simultaneously produced in the r-process.This result is similar to that obtained in a previous study conducted by Xu et al [33] with the HFB-17, RMF, and previous versions of the FRDM[35]and WS[36]mass models.We found that the three peaks can appear at the same time if the FRDM and KTUY models [panel (C) and (F)] are employed in the calculations.This finding contradicts the calculations [33]using the HFB-17, WS, and the previous version of the FRDM [35] models.Besides, the conditions for the simultaneous appearance of the peaks are very sensitive in the case of the DZ10 model as can be seen in panel (E).If the neutron density is decreased by a factor of 3,there is no appearance of the N=126 peak.
To evaluate the impact of the nn-T9condition differences due to the mass uncertainty on the nucleosynthesis via the r-process, we calculated the r-process abundance of isotopes using the nn-T9conditions, which were shown in figure 6, as the input of the calculation.The other necessary inputs are determined as follows:the β-decay rates of WP are obtained from the NUBASE2020 database[52]or in[44];the(n,γ),and(γ,n)reaction rates of the WP are calculated using the TALYS code [53] based on the Hauser-Fesbach model[50]; and the β-decay and β-delayed neutron emission rates are taken from [35].Since the astrophysical sites for the r-process are still very complicated, we assumed that the r-process occurs in a high-entropy neutron-driven wind,which is popularly believed to be a suitable site for the main r-process [54–57].For the computation, we employed the calculation method which was well described in[58]by using the r-Java computer code [58].
The estimated r-process abundances based on each mass model are shown in figure 7.Although these abundances are much (more than 3–4 orders of magnitude) lower, the positions of the peaks are consistent with those of the Solar system, which are adopted from [59].Notice that the lower abundance of the simulations can be understood by the short r-process timescale, which is a few milliseconds [10] compared to 4.6 billion years of the Solar system [60].The left panel shows that there is no appearance of the third peak since the conditions are only overlapped for the N=50 and 82 WP,as can be seen in panels(A)and(E) of figure 6.A very faint peak around A ≈190 (the third peak) clearly reflects the narrow overlapped band of the condition in the case of the DZ10 model.On the other hand, the nucleosyntheses based on the AME and DZ10 models of the isotopes beyond the second peak are also different from each other.The AME abundance is much lower than that based on the DZ10 mass data.It was found that the small deviation of rms <0.216 MeV in the AME and DZ10 two-neutron separation energies(S2n)can lead to a large discrepancy,up to two orders of magnitude, in the abundances.For the FRDM and KTUY cases,the overlapped conditions in panels(C)and(F) of figure 6 clearly result in the simultaneous appearances of all the three peaks, as can be seen in the right panel.Besides, the KTUY abundance is higher than that based on the FRDM for the A <190, and vice versa for the A >190 nuclei.Moreover, their abundances are sensitive to the nuclear mass of the investigated WP.We found that the deviation of rms=0.281 in the two-neutron separation energies based on the FRDM and KTUY models results in a difference up to three and two orders of magnitude in the abundances of the isotopes in the ranges of A=110–140 and A=200–250, respectively.Obviously, the r-process calculation is still very uncertain with the current predicted nuclear mass.The results of the present study indicate that the mass uncertainty should be reduced to be, at least, smaller than 0.216 MeV.Unfortunately, there are large discrepancies in both theoretical calculations and experimental data, e.g.results reported in [61] and [45].Therefore, precise mass measurements for extremely neutron-rich nuclei of76Fe,77Co,78Ni,79Cu,127Rh,128Pd,129Ag,130Cd,192Dy,193Ho,194Er,195Tm, and their even-N neighboring isotopes are necessary for a better understanding of the r-process properties (i.e.reaction paths, isotopic abundance, etc).
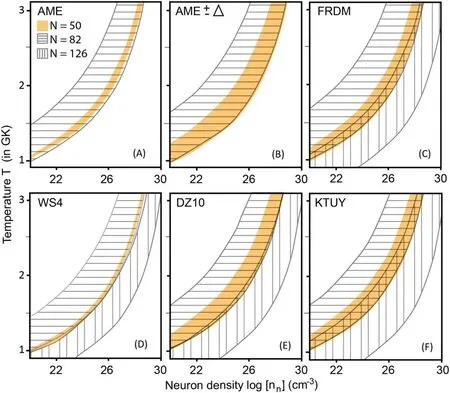
Figure 6.The overall nn-T9 conditions required for both A=80,A=130,and/or A=195 peaks simultaneously appearing in the r-process abundance.The yellow shaded,vertically hatched,and/or horizontally hatched bands indicate the conditions required for the N=50 N=82,and/or N=126 isotones to be waiting points, respectively, which were calculated using the AME, AME±Δ, FRDM, WS4, DZ10, and KTUY data sets.
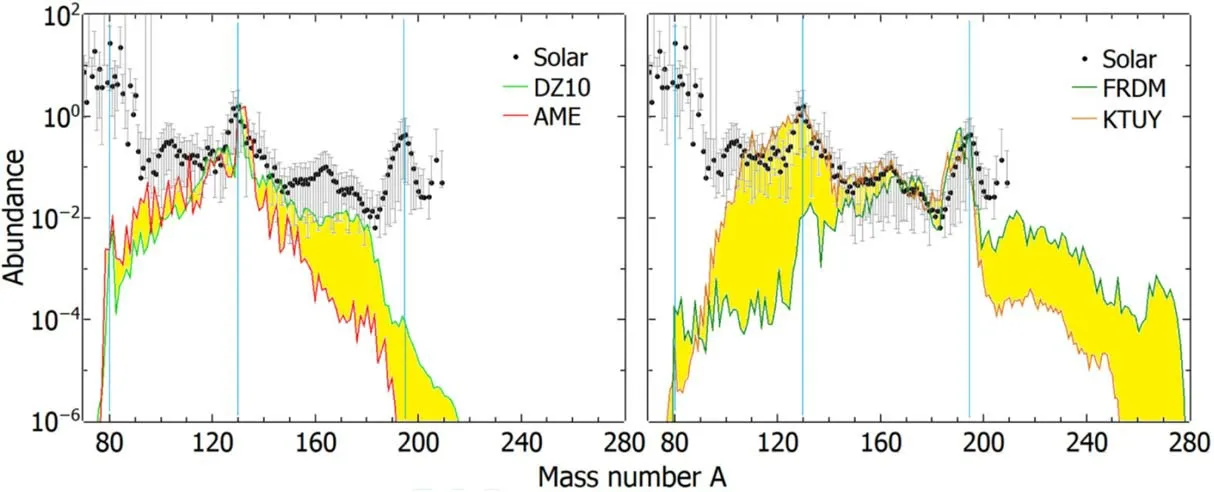
Figure 7.The r-process abundances of isotopes calculated using the nn-T9 conditions based on the AME,DZ10,FRDM,and KTUY mass data sets.Notice that the calculated abundances are upscaled by a factor of 1000 to normalize with the A=130 peak of the Solar abundance which is taken from[59](black dots with error bars).The yellow shaded areas indicate the differences among the abundances based on the different models.The thin lines are to guide the eyes at the A ≈80, 130, and 190 peaks.
4.Conclusion
In the present study, we estimated the neutron density and temperature conditions required by the WP, which distribute in the A=80,130,and 195 peaks of the r-process abundance,using the newest updated two-neutron separation energies from the AME2020 database (with [AME ± Δ] and without uncertainty [AME]) and from calculations based on the FRDM,WS4,DZ10,and KTUY models.The findings in this work are different from those investigated using the RMF,HFB, and WS mass models in a previous work.The results indicate that the n–T9conditions based on the AME data are much narrower than those estimated using the AME±Δ and FRDM mass data.The FRDM and KTUY calculations are in a good agreement for the nn–T9condition approximation.The stellar condition ranging from the upper to lower bounds for the N=50 isotones is mostly smaller and overlaps with that for the N=82 ones when the AME,AME±Δ,FRDM,DZ10, and KTUY models are employed.Subsequently, with these models, the n–T9conditions necessary for the N=50 WP fulfill the conditions to simultaneously produce both A=80 and A=130 peaks in the r-process abundance.In contrast,the results based on the WS4 are different from those of the others for the simultaneous appearances of all the three peaks.Moreover, the conditions required by the N=126 isotopes are much higher than and mostly out of those required by the N=50 and 82 ones.On the other hand, the systematic study on the two-neutron separation energy indicates that the KTUY model is closer to experimental data in the AME2020 database than to the others.Hence,the KTUY model is reasonable to be employed for the mass predictions.The results show that the current mass uncertainties of76Fe and81Cu,127Rh,132Cd,192Dy,and197Tm strongly impact the determination of the n–T9conditions at the (n, γ)–(γ, n)equilibrium for the N=50, 82, and 126 WP, leading to a large discrepancy in the r-process abundance.Therefore,precise mass measurements for these nuclei are necessary to reduce the uncertainty in the r-process WP approximation.Finally, this work provides useful information for further studies on the r-process.
Acknowledgments
This work was supported by the National Research Foundation of Korea (NRF) Grant funded by the Korean Ministry of Education, Science, and Technology (No.NRF-2020R1C1C1006029).
ORCID iDs
杂志排行
Communications in Theoretical Physics的其它文章
- Strange quark star and the parameter space of the quasi-particle model
- Representations of hypergraph states with neural networks*
- A universal protocol for bidirectional controlled teleportation with network coding
- Improved analysis of the rare decay processes of Λb
- Three-dimensional massive Kiselev AdS black hole and its thermodynamics
- Analysis of the wave functions for accelerating Kerr-Newman metric